521 Martin St · Greensboro, NC
Flood risk 1/10 · Minimal
- FEMA flood zone
- X (unshaded)
- Chance of flooding over 30 yrs
- 0.0%
- Est. flood insurance / yr
- $507 – $1,088
Fire risk 1/10 · Minimal
- Est. fire insurance / yr
- $906 – $1,684
Heat risk 6/10 · Moderate
- Hot days now (above 103°F)
- 7 days/yr
- Hot days in 30 yrs
- 17 days/yr
Wind risk 4/10 · Minor
- Chance of severe wind over 30 yrs
- 14.0%
Air-quality risk 2/10 · Minimal
- Unhealthy air days now
- 1 days/yr
- Unhealthy air days in 30 yrs
- 2 days/yr
Risk factors via First Street. Map © Google.
Why this score? — see what drove the B+ grade
The composite is a weighted blend of 9 inputs, each scored 0–100. Each bar is that input's sub-score; the figure is the points it added to the 100-point composite (weight × sub-score).
- Cash flow +30.0/30.0
- ARV discount +15.0/15.0
- DSCR +10.0/10.0
- 1% rule +9.4/10.0
- Livability +4.0/5.0
- Schools +3.6/10.0
- Rent growth +3.0/5.0
- Condition / age +2.5/5.0
- Appreciation +0.0/10.0
$89,000
🖨 Deal sheet 📄 Offer letter ✓ Due diligence
Listing remarks
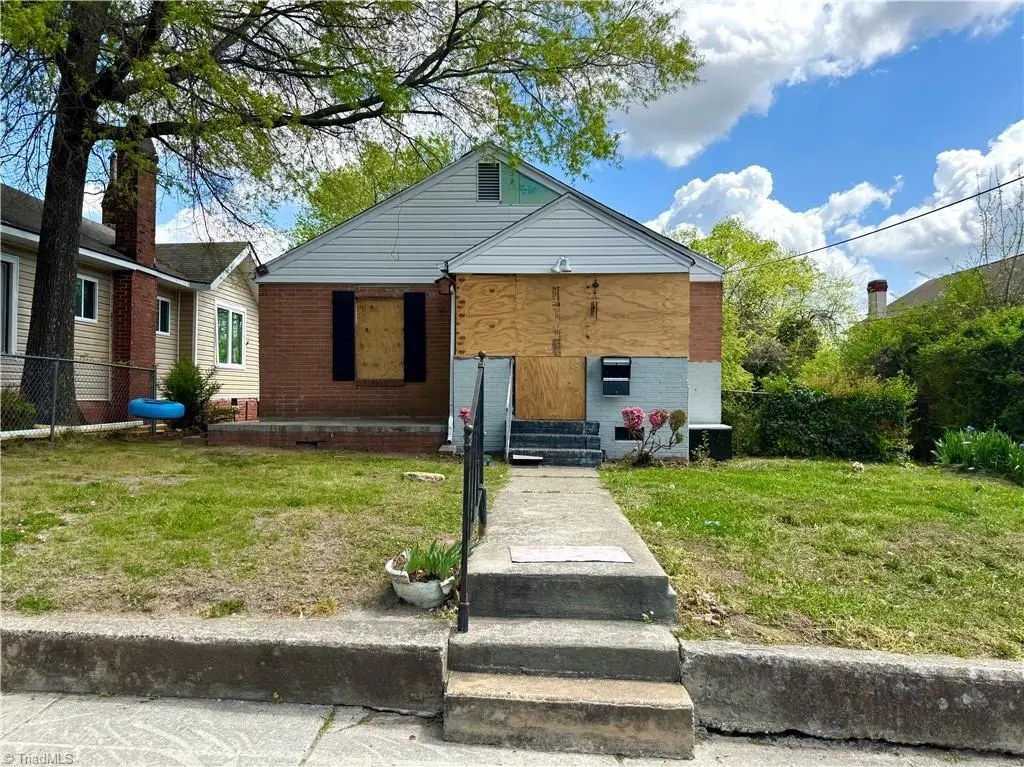
Investor Alert! Two parcels offered below tax value in a convenient Greensboro location bordering the campus of Bennett College. Situated 5 minutes or less from each: Downtown Greensboro, North Carolina A & T State University, and UNCG! This property sits in a storied and evolving corridor near The Historic Magnolia House and offers a view of the Bennett College water tower, a recognizable local landmark! With two parcels included and zoning RS-5, this property presents an intriguing opportunity for redevelopment, investment, or future residential use in a location surrounded by universities, heritage, and ongoing revitalization. Important: Do NOT enter the structure. The home is con
Key facts
- 5,227 sq ft lot
- Built 1935
- Listed 12 days
Property features AI
Finance
- HOA & community: No homeowners association
Exterior
- Parking: Driveway; On-street parking
- Utilities: Public sewer; Electric water heater
- Home design: Residential stick/site-built house; One level; Built in 1935; Existing structure
- Construction: Brick and vinyl siding exterior; Crawl space foundation
- Exterior features: Public water; No pool; Publicly maintained road
Interior
- Bathrooms: 1 full bathroom
- Heating & cooling: Heating fuel: Oil; Heating: Oil (see remarks); Cooling: Other
- Interior features: Primary bedroom on the main level
- Laundry & utility: Electric water heater
Neighborhood map
What this means for you Summary
Snapshot
- This is a 2-bed/1.0-bath single-family listed at $89k.
Deal economics
- At list price, monthly cash flow is $466 ($6k/yr) — positive.
- The deal already cash-flows at list — no discount required.
- Meets the 1% rule at list price ($1k rent vs $89k).
- Cap rate 12.6% vs local median 3.8% in Greensboro — top-decile yield for the area; either an underpriced asset or a hidden risk that comps aren't pricing in. Stress-test before assuming the spread holds.
Location & tenants
- Location reads 81/100 on livability (#12 in NC, #1,335 nationally) — a professional / high-income tenant draw. Strengths: amenities A+, commute A+, cost of living A+; Watch: employment D, crime F.
- Guilford County Schools (urban): math 39% / reading 45% proficiency, ranked #99 of 178 in NC (top 56%) — families likely to look elsewhere, expect single-tenant / working-renter base with shorter leases.
- Market conditions: Rents rising (+2.2%/yr); 261 active listings in the ZIP; 26 comparable units currently listed for rent nearby; rentals at typical pace (median 24d on market — plan ~3-4 weeks tenant-placement turnaround); 3,843 units permitted in Guilford County in 2024 (2,397 in 5+ unit buildings).
Forward outlook
- Local home prices are declining (-3.0%/yr); year-one equity from $615 of loan paydown is wiped out by about $3k of value loss. Plan a longer hold.
- Guilford County population projected at +26% by 2050 — long-run rental-demand tailwind backs the buy-and-hold thesis.
- At projected returns (-3.0% appreciation + 2.2% rent growth), your $25k cash investment doubles in ~6 years — after that, you're playing with house money.
Negotiation context
- Only 12 days on market — expect competitive offers; lowballing is unlikely to land.
Risks & watch-outs
- Watch-outs: built in 1935 — expect roof / HVAC / electrical / plumbing capex.
- Climate carrying-cost: extreme-heat days projected 7→17/yr by 2055 (HVAC capex compounding) — expect insurance premiums to compound above CPI over the hold.
Questions for the listing agent
- Built in 1935 — when were the roof, HVAC, electrical panel, plumbing, and water heater last replaced?
- Is there a deadline driving the sale (1031 exchange, divorce, estate, relocation)? That informs how much negotiation room exists.
- Crime grade is F in this area — have there been break-ins, vandalism, or insurance claims at this property in the last 3 years? What carrier currently insures it and at what premium?
- What's the average days-on-market for RENTAL listings here right now (not sales)? A rising rental-DOM trend means longer vacancies and softer asking-rent achievability than the comps imply.
- What's the recent tenant-quality profile in this submarket — average credit score on applications, eviction rate, late-payment / NSF rate, and stable-employment percentage? A property-management company in the area should have these aggregated.
- How much new for-sale + rental construction is in the pipeline within 1–3 miles? Heavy new supply typically softens prices + rents 12–24 months out; constrained supply supports both.
Investment metrics
- 1% rule
- 1.44% ✓
- Cap rate
- 12.58%
- Cash-on-cash
- 22.45%
- DSCR
- 2.00
- GRM
- 5.8
CMA / ARV
- ARV (on-the-fly)
- $127,680
- Comps found
- 9
Show comp detail 9 sales within ~0.75 mi
| Address | Dist | Beds/Ba | Sqft | Sold | Price | $/sf | Match |
|---|---|---|---|---|---|---|---|
| 521 Martin St | 0.00mi | 2/1.0 | 840 (0%) | 1mo | $65,000 | $77 | 99 |
| 703 Law St | 0.51mi | 3/1.0 (+1) | 824 (-2%) | 5mo | $137,000 | $166 | 64 |
| 1011 S Pearson St | 0.39mi | 2/1.0 | 768 (-9%) | 17mo | $110,000 | $143 | 53 |
| 620 Julian St | 0.50mi | 3/1.0 (+1) | 784 (-7%) | 9mo | $138,500 | $177 | 53 |
| 907 Logan St | 0.61mi | 3/1.0 (+1) | 880 (+5%) | 9mo | $130,000 | $148 | 51 |
| 817 Tuscaloosa St | 0.65mi | 2/1.0 | 720 (-14%) | 4mo | $160,000 | $222 | 42 |
| 800 Bluford St | 0.60mi | 3/1.0 (+1) | 960 (+14%) | 3mo | $223,500 | $233 | 41 |
| 1207 Gorrell St | 0.60mi | 2/1.5 | 926 (+10%) | 23mo | $141,000 | $152 | 34 |
| 306 Regan St | 0.54mi | 3/1.0 (+1) | 953 (+14%) | 21mo | $140,000 | $147 | 30 |
Match score weights: distance 35% · size 25% · config 20% · recency 20%. Top-matched comps best support the ARV.
Projected returns pro-forma
-3.0% appreciation · 2.18% rent growth · sell at horizon
- IRR
- 14.4%
- Equity multiple
- 1.57×
- Total profit
- $14,201
- Equity at exit
- $13,270
- IRR
- 22.5%
- Equity multiple
- 2.86×
- Total profit
- $46,276
- Equity at exit
- $7,695
Cash invested: $24,920 (down + closing). Projections, not guarantees.
Landlord ↔ Tenant lean methodology
- Overall (STATE)
- 85 Strongly Landlord-Friendly
- State North Carolina
- 85 Strongly Landlord-Friendly · R+3
- County
- — inherits STATE
- City
- — inherits STATE
ZIP-level market 27406
- Rents YoY
- 2.2%
- Active inventory
- 261
- Price-to-rent
- 5.8×
Monthly cashflow live
- Estimated rent
- $1,283 high interval (Pro) →
- Mortgage (P&I)
- −$467
- Tax from tax record
- −$44 /mo · $522/yr
- Insurance
- −$37
- HOA
- −$0
- Vacancy / Maint / Mgmt
- −$269
- Net cashflow
- $466
Break-even live
UW: 25.0% down · 7.5% · 30yr · 1.5% tax · 5.0% vac · 8.0% maint · 8.0% mgmt
Financing live
Cash to close
- Down payment
- $22,250
- Closing costs
- $2,670
- Reserves months
- —
- Total cash needed
- —
Loan-product check · same deal, 3 products live
Conventional
25% down · 7.5% · 30yr
- Down + closing
- —
- Monthly P&I
- —
- Monthly cashflow
- —
- DSCR
- —
- Eligible?
- —
Personal DTI + credit; lowest rate.
DSCR
20% down · 8.5% · 30yr
- Down + closing
- —
- Monthly P&I
- —
- Monthly cashflow
- —
- DSCR
- —
- Eligible?
- —
No personal income docs; deal must DSCR.
Hard money
10% down · 12.0% · 12mo
- Down + closing
- —
- Monthly P&I
- —
- Monthly cashflow
- —
- DSCR
- —
- Eligible?
- —
Short-term bridge; refi at stabilization.
Rent comps 26 comps
| Address | Beds | Baths | Sqft | Rent | $/sqft | DOM | Units | Dist |
|---|---|---|---|---|---|---|---|---|
| 710 Reid St Greensboro, NC | 3.0 | 1.0 | 925 | $1,395 | $1.51 | 14d | 1 | 0.28mi |
| 1001 E Bragg St Apt B Greensboro, NC | 2.0 | 1.0 | 700 | $925 | $1.32 | 14d | 1 | 0.34mi |
| 321 S Elm St Greensboro, NC | 1.0–2.0 | 1.0–2.0 | 950 | $1,787 | $1.88 | 14d | 8 | 0.48mi |
| 405 E Whittington St Greensboro, NC | 2.0 | 1.0 | 700 | $995 | $1.42 | 23d | 1 | 0.62mi |
| 800 Arlington St Unit A Greensboro, NC | 2.0 | 1.0 | 650 | $1,250 | $1.92 | 14d | 1 | 0.62mi |
| 1003 Martin Luther King Junior Dr Unit B Greensboro, NC | 1.0 | 1.0 | 580 | $595 | $1.03 | 23d | 1 | 0.66mi |
| 201 N Elm St Greensboro, NC | 2.0 | 2.0 | 1046 | $2,298 | $2.20 | 14d | 2 | 0.66mi |
| 909 Tuscaloosa St Greensboro, NC | 2.0 | 1.0 | 840 | $1,195 | $1.42 | 23d | 1 | 0.68mi |
| 220 W Market St Greensboro, NC | 1.0 | 1.0 | 858 | $1,200 | $1.40 | 23d | 2 | 0.70mi |
| 702 Ross Ave Greensboro, NC | 2.0 | 1.0 | 672 | $1,200 | $1.79 | 23d | 1 | 0.71mi |
| 904 Stephens St Greensboro, NC | 3.0 | 1.0 | 1052 | $1,490 | $1.42 | 14d | 1 | 0.86mi |
| 503 S O Henry Blvd Greensboro, NC | 2.0 | 1.0 | 860 | $850 | $0.99 | 23d | 1 | 0.94mi |
| 403 S O Henry Blvd Unit Alexander Homes Greensboro, NC | 2.0 | 1.0 | 860 | $875 | $1.02 | 23d | 1 | 0.95mi |
| 801 W McGee St #25 Greensboro, NC | 2.0 | 2.0 | 960 | $1,550 | $1.61 | 21d | 1 | 0.96mi |
| 451 N Eugene St Greensboro, NC | 1.0–2.0 | 1.0–2.0 | 1021 | $2,309 | $2.26 | 14d | 6 | 1.01mi |
| 711 Summit Ave Greensboro, NC | 1.0 | 1.0 | 700 | $1,025 | $1.46 | 23d | 1 | 1.01mi |
| 1112 Stephens St Greensboro, NC | 2.0 | 1.0 | 744 | $1,250 | $1.68 | 19d | 1 | 1.03mi |
| 404 W Smith St Greensboro, NC | 1.0–2.0 | 1.0–2.0 | 803 | $1,719 | $2.14 | 14d | 8 | 1.09mi |
| 2007 S Benbow Rd Greensboro, NC | 3.0 | 1.0 | 960 | $1,100 | $1.15 | 23d | 1 | 1.18mi |
| 516 S Mendenhall St Unit 512-G Greensboro, NC | 2.0 | 1.0 | 812 | $1,299 | $1.60 | 14d | 1 | 1.22mi |
| 2011 Lutheran St Greensboro, NC | 2.0 | 1.0 | 800 | $985 | $1.23 | 23d | 1 | 1.24mi |
| 2001 Spencer St Greensboro, NC | 2.0 | 1.0 | 720 | $1,295 | $1.80 | 23d | 1 | 1.25mi |
| 402 Winston St Greensboro, NC | 2.0 | 1.0 | 640 | $1,150 | $1.80 | 23d | 1 | 1.38mi |
| 2117 Tuscaloosa St Greensboro, NC | 3.0 | 1.0 | 1000 | $1,600 | $1.60 | 23d | 1 | 1.38mi |
| 112 S Raleigh St Greensboro, NC | 3.0 | 1.0 | 1000 | $1,200 | $1.20 | 23d | 1 | 1.40mi |
| 110 S Raleigh St Greensboro, NC | 3.0 | 1.0 | 1000 | $1,200 | $1.20 | 23d | 1 | 1.40mi |
Listing history 3 events
-
2026-04-23status Pending
-
2026-04-14historical Due Diligence Period
-
2026-04-10$89,000 Active
ⓘ Source: listings_history table (triggers on properties + properties_extension) + one-shot
backfill from property_details.listing_events for pre-trigger history.
Tax reassessment forecast NC · Resets to sale price
- Current annual tax
- $522 · $44/mo
- Projected year-2 tax
- $730 · $61/mo
- Expected delta
- +$208/yr (+$17/mo · 39.7%)
ⓘ Screening estimate from a state-policy table — verify with the county assessor before closing.
Climate risk First Street
- Flood 1/10 Low FEMA zone X (unshaded) · 0% chance over 30 yrs
- Wildfire 1/10 Low
- Heat 6/10 Major 7 d/yr ≥103°F today · 17 d/yr by 30 yrs out
- Wind 4/10 Moderate 14% chance of damaging wind over 30 yrs
- Air quality 2/10 Low 1 unhealthy d/yr today · 2 by 30 yrs out
Nearby sold comps map
Loading sold comps map…
Walkable amenities ~0.75 mi
Loading nearby amenities…
Taxation est. · year 1
- Rental income
- $15,396
- − Mortgage interest
- −$4,985
- − Property taxes
- −$522
- − Insurance
- −$445
- − Repairs & maintenance
- −$1,232
- − Management
- −$1,232
- − Depreciation
- −$2,589
- Taxable income
- $4,391
- Est. tax owed @ 24.0%
- −$1,054
- After-tax cash flow
- $4,541/yr
For passive investors: Depreciation is non-cash, so a rental often shows a tax loss while cash-flowing — sheltering income. Rental losses are passive: they offset passive income freely, and up to $25,000/yr can offset ordinary (W-2) income if you actively participate and your MAGI is under $100k (phasing out to $0 by $150k); unused losses carry forward. On sale, claimed depreciation is recaptured at up to 25%, and gains may owe capital-gains tax (a 1031 exchange can defer both). Figures are a year-1 estimate at your 24.0% rate — not tax advice; consult a CPA.
Schools (NCES district)
- District
- Guilford County Schools
- NCES district ID
- 3701920
- Math proficiency
- 39% ▲ 1.00%
- Reading proficiency
- 45% ▲ 1.00%
- Median HH income
- $46,315
- Composite
- 35.78/100
- National rank
- #4842
- State rank
- #99 of 178 in NC
Livability — Greensboro
- Score
- 81/100
- State rank
- #12
- US rank
- #1335
Category grades
Schools grade is shown separately in the Schools card above.
Census & demographics
- Census place
- Greensboro, NC
- County
- Guilford County · 487,190 people
- City population
- 329,421
- Metro
- Greensboro-High Point, NC
- Population (ZIP)
- 60,651
- Household income
- $59,563
- Rent vs Own
- Severe rent burden
- 2462.0
Population outlook (Guilford County) Hauer SSP2
- Today (2025)
- 584,596 people
- By 2030
- 616,851 · +5.5%
- By 2040
- 678,451 · +16.1%
- By 2050
- 734,788 · +25.7%
- By 2075
- 862,985 · +47.6%
- By 2100
- 948,704 · +62.3%
Race, ethnicity, and origin ACS 2023
- Neighborhood character
- Diverse neighborhood (Simpson 0.64)
- Race & ethnicity
- Black 52% White 26% Hispanic / Latino 13% Two or more races 10% Asian 2%
- Hispanic origin (detail)
- Mexican 7% Puerto Rican 2%
- Common ancestry
- Italian 1% Serbian 1% Lithuanian 1%
- Foreign-born
- 10% · Canada, Vietnam, United Kingdom
- Languages at home
- 83% English-only · Spanish 11% Vietnamese 1% Other Asian/Pacific 1%
Political lean MEDSL · Guilford
- 2024 margin
- Strong D (+21.8) · D 60.2% · R 38.4% · Other 1.4%
- 2008→2024 swing
- +3.5pp toward D · 2008: 18.4pp · 2024: 21.8pp
- All cycles
- 2024: D+21.8 2020: D+23.1 2016: D+20.0 2012: D+16.5 2008: D+18.4
Not yet ingested
- Civics
- —
Market trends
- HPI YoY
- ▼ -146.70%
- Current HPI
- 243.2612
- Rent YoY
- ▲ 2.18%
- Metro
- Greensboro-High Point, NC
- State GDP YoY
- ▲ 3.28%
- F500 in state
- 26
Industry mix (Fortune 500 HQ in NC)
| Industry | F500 HQs | Revenue |
|---|---|---|
| Financial Services | 2 | $213B |
|
||
| Retail | 2 | $95B |
|
||
| Industrial Conglomerate | 1 | $38B |
|
||
| Metals / Steel | 1 | $35B |
|
||
| Utilities | 1 | $30B |
|
||
| Industrial Machinery | 1 | $19B |
|
||
Price history
3 events — show timeline
- 2026-04-23 Pending — Triad MLS
- 2026-04-14 Contingent — Triad MLS
- 2026-04-10 Listed $89,000 Triad MLS
Property tax history
+3.8%/yrLatest (2025): $522 · -1.0% YoY. Source: county tax records.
Cash-flow waterfall
monthlySold comps — $/sqft
last 12 mo · ≤1 miLoading sold comps…