 🏷️ Likely Rental
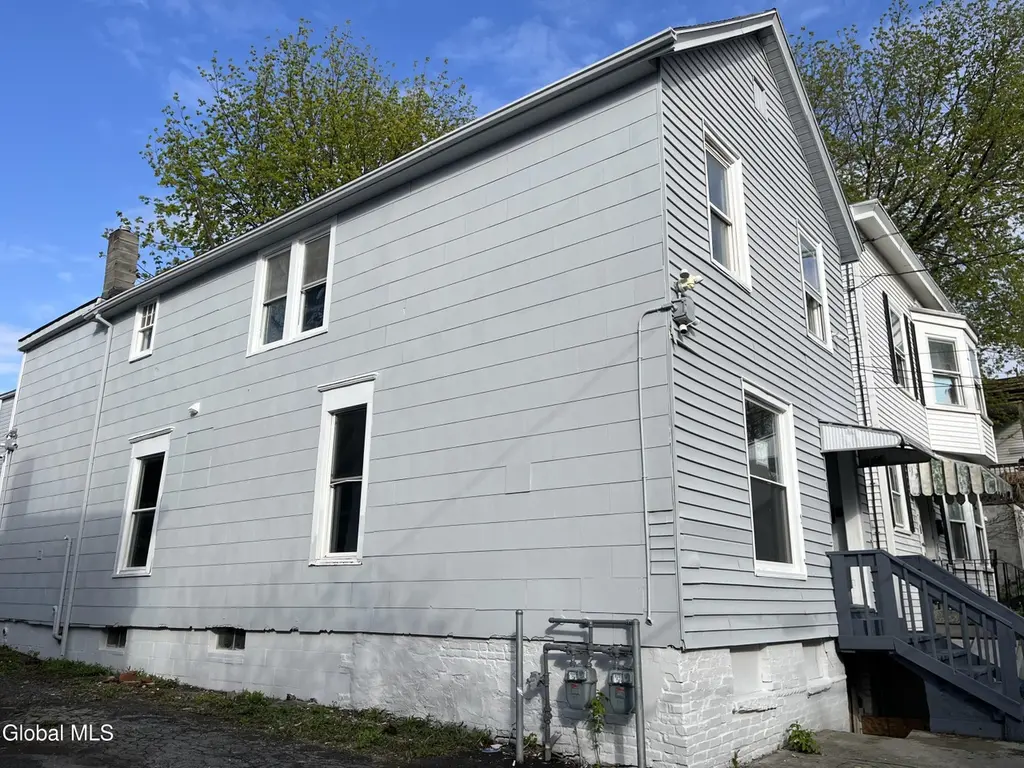
683 State St · Albany, NY
Flood risk 6/10 · Moderate
- FEMA flood zone
- X (unshaded)
- Chance of flooding over 30 yrs
- 0.75%
- Est. flood insurance / yr
- $473 – $860
Fire risk 1/10 · Minimal
- Est. fire insurance / yr
- $691 – $1,283
Heat risk 4/10 · Minor
- Hot days now (above 97°F)
- 7 days/yr
- Hot days in 30 yrs
- 16 days/yr
Wind risk 3/10 · Minor
- Chance of severe wind over 30 yrs
- 5.0%
Air-quality risk 1/10 · Minimal
- Unhealthy air days now
- 0 days/yr
- Unhealthy air days in 30 yrs
- 0 days/yr
Risk factors via First Street. Map © Google.
Why this score? — see what drove the B+ grade
The composite is a weighted blend of 9 inputs, each scored 0–100. Each bar is that input's sub-score; the figure is the points it added to the 100-point composite (weight × sub-score).
- Cash flow +30.0/30.0
- ARV discount +15.0/15.0
- DSCR +10.0/10.0
- 1% rule +9.1/10.0
- Livability +4.0/5.0
- Schools +3.2/10.0
- Rent growth +3.0/5.0
- Condition / age +2.5/5.0
- Appreciation +0.0/10.0
$369,000
🖨 Deal sheet 📄 Offer letter ✓ Due diligence
Multi-family units
County records classify this as Multi-Family (2-4 Unit). Listing-text estimate: 1 unit. estimate disagrees with records
Listing remarks MLS
Fully renovated and presents a turnkey multifamily investment with immediate lease-up potential in one of Albany's most durable rental submarkets. RENOVATIONS & CAPEX IMPROVEMENTS: New LVP flooring throughout Fully updated bathrooms with marble-look porcelain tile & rainfall fixtures New windows and doors Updated exterior siding Recessed lighting + modern finishes Updated Electrical and Plumbing Newer roof True Turnkey Asset -- No renovation risk or CapEx pipeline 3BR Units Rare Amenity Combo: Onsite Parking + in unit laundry Delivered Vacant -- Control tenant selection + maximize rents immediately Proven Submarket -- Stable occupancy with diverse renter base Situated in Pine Hills, one of Albany's most established rental markets: Minutes to University at Albany Strong access to healthcare, education, and state employment hubs Consistent demand from students, professionals, and workforce tenants Projected CAP Rate: >10% (Pro Forma) Agent is the Owner
Key facts
- 2,613 sq ft lot
- 4 parking spots
- Built 1900
Neighborhood map
What this means for you Summary
Snapshot
- This is a 6-bed/2.0-bath multifamily listed at $369k.
Deal economics
- At list price, monthly cash flow is $2k ($19k/yr) — positive.
- The deal already cash-flows at list — no discount required.
- Meets the 1% rule at list price ($5k rent vs $369k).
- Recommended offer: $347k (6.0% below list) — sets the bar for market timing.
- Cap rate 11.5% vs local median 5.7% in Albany — top-decile yield for the area; either an underpriced asset or a hidden risk that comps aren't pricing in. Stress-test before assuming the spread holds.
Location & tenants
- Location reads 79/100 on livability (#129 in NY, #2,083 nationally) — a middle-class / working-renter tenant base. Strengths: amenities A+, commute A+, housing A+; Watch: employment C-, crime F.
- Albany City School District (urban): math 37% / reading 40% proficiency, ranked #543 of 590 in NY (top 92%) — families likely to look elsewhere, expect single-tenant / working-renter base with shorter leases; 66% free/reduced lunch — lower-income household profile, screen leases tightly.
- Market conditions: Rents rising (+1.9%/yr); 124 active listings in the ZIP; solid renter incomes; 675 units permitted in Albany County in 2024 (451 in 5+ unit buildings).
- At $5,211/mo this rent would consume 75% of the median local household income ($83k/yr) (locally 1704% of renters already pay >50% of income on rent) — very limited rent-growth headroom before tenants either downsize or default.
Forward outlook
- Local home prices are declining (-3.0%/yr); year-one equity from $3k of loan paydown is wiped out by about $11k of value loss. Plan a longer hold.
- Albany County population projected at +9% by 2050 — modest demand growth; plan on rents tracking national, not racing it.
- At projected returns (-3.0% appreciation + 1.9% rent growth), your $103k cash investment doubles in ~8 years — after that, you're playing with house money.
Negotiation context
- It's been on market 62 days — a 6% lower offer ($347k) is reasonable based on typical stale-listing flexibility.
- 13 sale attempts since 21y ago; this cycle's ask is 18350% above the opening price — seller raised mid-cycle; expect resistance to lowballs.
- Current owner paid $152k; list at $369k implies a 142% gain — meaningful room to come down on a strong offer.
Risks & watch-outs
- Watch-outs: built in 1900 — expect roof / HVAC / electrical / plumbing capex.
- Climate carrying-cost: major flood risk — expect insurance premiums to compound above CPI over the hold.
Questions for the listing agent
- It's been on market 62 days. Have you received any prior offers? Is the seller open to a 6% concession, seller financing, or rate buy-down credit?
- Built in 1900 — when were the roof, HVAC, electrical panel, plumbing, and water heater last replaced?
- Why hasn't it sold? Are there any deal-killer items the seller is aware of (foundation, flood, title, zoning, code violations)?
- Is there a deadline driving the sale (1031 exchange, divorce, estate, relocation)? That informs how much negotiation room exists.
- Crime grade is F in this area — have there been break-ins, vandalism, or insurance claims at this property in the last 3 years? What carrier currently insures it and at what premium?
- What's the average days-on-market for RENTAL listings here right now (not sales)? A rising rental-DOM trend means longer vacancies and softer asking-rent achievability than the comps imply.
- What's the recent tenant-quality profile in this submarket — average credit score on applications, eviction rate, late-payment / NSF rate, and stable-employment percentage? A property-management company in the area should have these aggregated.
- How much new apartment / multifamily construction is in the pipeline within 1–3 miles? Heavy new supply (>2% of stock underway) typically softens rents 12–24 months out; light construction supports rent growth.
Investment metrics
- 1% rule
- 1.41% ✓
- Cap rate
- 11.51%
- Cash-on-cash
- 18.62%
- DSCR
- 1.83
- GRM
- 5.9
CMA / ARV
- ARV (median comp)
- $461,762
- List price
- $369,000
- Delta
- -20.09%
- Verdict
- UNDERPRICED
- Comps
- 20 within 1.0 mi
Show comp detail 12 sales within ~0.75 mi
| Address | Dist | Beds/Ba | Sqft | Sold | Price | $/sf | Match |
|---|---|---|---|---|---|---|---|
| 184 Quail St | 0.07mi | 6/3.0 | 1,853 (+11%) | 4mo | $231,000 | $125 | 71 |
| 348 1st St | 0.59mi | 6/2.0 | 1,606 (-4%) | 5mo | $250,000 | $156 | 63 |
| 538 Hamilton St | 0.33mi | 6/3.0 | 1,524 (-9%) | 6mo | $285,000 | $187 | 61 |
| 446 1st St | 0.45mi | 6/2.0 | 1,848 (+11%) | 1mo | $160,000 | $87 | 60 |
| 339 2nd St | 0.60mi | 6/2.0 | 1,784 (+7%) | 1mo | $175,000 | $98 | 60 |
| 44-46 Quail St | 0.47mi | 6/2.0 | 1,818 (+9%) | 7mo | $153,000 | $84 | 57 |
| 106 Spring St | 0.14mi | 5/2.0 (-1) | 1,896 (+14%) | 13mo | $236,000 | $124 | 55 |
| 951 State St | 0.59mi | 5/2.0 (-1) | 1,632 (-2%) | 13mo | $365,000 | $224 | 53 |
| 320 1st St | 0.63mi | 5/3.0 (-1) | 1,638 (-2%) | 10mo | $213,000 | $130 | 50 |
| 312 Third St | 0.66mi | 6/2.0 | 1,772 (+6%) | 16mo | $130,000 | $73 | 45 |
| 331 1st St | 0.61mi | 6/2.0 | 1,800 (+8%) | 17mo | $189,900 | $106 | 44 |
| 309 Manning Blvd | 0.74mi | 5/2.0 (-1) | 1,868 (+12%) | 10mo | $305,000 | $163 | 32 |
Match score weights: distance 35% · size 25% · config 20% · recency 20%. Top-matched comps best support the ARV.
Projected returns pro-forma
-3.0% appreciation · 1.85% rent growth · sell at horizon
- IRR
- 9.1%
- Equity multiple
- 1.35×
- Total profit
- $36,388
- Equity at exit
- $55,019
- IRR
- 17.3%
- Equity multiple
- 2.35×
- Total profit
- $139,466
- Equity at exit
- $31,904
Cash invested: $103,320 (down + closing). Projections, not guarantees.
Landlord ↔ Tenant lean methodology
- Overall (STATE)
- 15 Strongly Tenant-Friendly
- State New York
- 15 Strongly Tenant-Friendly · D+10
- County
- — inherits STATE
- City
- — inherits STATE
ZIP-level market 12203
- Home prices YoY
- -31.0%
- Rents YoY
- 1.9%
- Active inventory
- 124
- Price-to-rent
- 17.7×
Monthly cashflow live
- Estimated rent
- $5,211 high interval (Pro) →
- Mortgage (P&I)
- −$1,935
- Tax from tax record
- −$425 /mo · $5,100/yr
- Insurance
- −$154
- HOA
- −$0
- Vacancy / Maint / Mgmt
- −$1,094
- Net cashflow
- $1,603
Break-even live
3-unit breakdown (identical units grouped — click to expand)
| Units | Beds | Baths | Est. rent |
|---|---|---|---|
| 3× units | 3 | 1 | $5,211 |
| #1 | 3 | 1 | $1,737 |
| #2 | 3 | 1 | $1,737 |
| #3 | 3 | 1 | $1,737 |
| Total (3 units) | $5,211 | ||
UW: 25.0% down · 7.5% · 30yr · 1.5% tax · 5.0% vac · 8.0% maint · 8.0% mgmt
Financing live
Cash to close
- Down payment
- $92,250
- Closing costs
- $11,070
- Reserves months
- —
- Total cash needed
- —
Loan-product check · same deal, 3 products live
Conventional
25% down · 7.5% · 30yr
- Down + closing
- —
- Monthly P&I
- —
- Monthly cashflow
- —
- DSCR
- —
- Eligible?
- —
Personal DTI + credit; lowest rate.
DSCR
20% down · 8.5% · 30yr
- Down + closing
- —
- Monthly P&I
- —
- Monthly cashflow
- —
- DSCR
- —
- Eligible?
- —
No personal income docs; deal must DSCR.
Hard money
10% down · 12.0% · 12mo
- Down + closing
- —
- Monthly P&I
- —
- Monthly cashflow
- —
- DSCR
- —
- Eligible?
- —
Short-term bridge; refi at stabilization.
Listing history 46 events
-
2026-06-18days on market $369,000 Active 62 DOM
-
2026-06-17days on market $369,000 Active 61 DOM
-
2026-06-16days on market $369,000 Active 60 DOM
-
2026-06-15days on market $369,000 Active 59 DOM
-
2026-06-14remarks 699-char remark
-
2026-06-14days on market $369,000 Active 57 DOM
-
2026-06-10days on market $369,000 Active 54 DOM
-
2026-06-08days on market $369,000 Active 52 DOM
-
2026-06-07days on market $369,000 Active 51 DOM
-
2026-06-03days on market $369,000 Active 47 DOM
-
2026-06-02days on market $369,000 Active 46 DOM
-
2026-06-01days on market $369,000 Active 45 DOM
-
2026-05-31days on market $369,000 Active 44 DOM
-
2026-05-31days on market $369,000 Active 43 DOM
-
2026-05-04price $1,950
-
2026-04-29$2,000
-
2026-04-28historical $2,000
-
2026-04-21price $2,000
-
2026-04-19$2,100
-
2026-04-17$369,000 Active 995-char remark
Show marketing remark (995 chars)
Fully renovated and presents a turnkey multifamily investment with immediate lease-up potential in one of Albany's most durable rental submarkets. RENOVATIONS & CAPEX IMPROVEMENTS: New LVP flooring throughout Fully updated bathrooms with marble-look porcelain tile & rainfall fixtures New windows and doors Updated exterior siding Recessed lighting + modern finishes Updated Electrical and Plumbing Newer roof True Turnkey Asset -- No renovation risk or CapEx pipeline 3BR Units Rare Amenity Combo: Onsite Parking + in unit laundry Delivered Vacant -- Control tenant selection + maximize rents immediately Proven Submarket -- Stable occupancy with diverse renter base Situated in Pine Hills, one of Albany's most established rental markets: Minutes to University at Albany Strong access to healthcare, education, and state employment hubs Consistent demand from students, professionals, and workforce tenants Projected CAP Rate: >10% (Pro Forma) Agent is the Owner
-
2026-01-02historical $1,650
-
2025-12-23historical
-
2025-12-17$1,650
-
2025-12-04$269,000 Active
-
2022-02-24price $1,500
-
2021-07-06soldstatus $152,500
-
2021-06-25soldstatus $152,500 Closed (Final Sale)
-
2021-06-25soldstatus $152,500 Closed
-
2021-06-25soldstatus $152,500
-
2021-03-31status Pending
-
2021-03-30status Pend (Under Cntr)
-
2021-03-22$169,900 New
-
2021-03-22$169,900 Active
-
2021-03-22$169,900
-
2021-03-22$169,900
-
2011-06-13historical
-
2011-02-01$105,000
-
2010-11-06historical
-
2010-05-05$105,000
-
2007-06-29soldstatus $65,000
-
2007-06-12historical
-
2007-05-30$59,000
-
2005-03-15soldstatus $103,000
-
2005-03-11soldstatus $100,000
-
2005-02-01historical
-
2005-01-22$99,900
ⓘ Source: listings_history table (triggers on properties + properties_extension) + one-shot
backfill from property_details.listing_events for pre-trigger history.
Tax reassessment forecast NY · Partial reset (capped growth)
- Current annual tax
- $5,100 · $425/mo
- Projected year-2 tax
- $5,668 · $472/mo
- Expected delta
- +$568/yr (+$47/mo · 11.1%)
ⓘ Screening estimate from a state-policy table — verify with the county assessor before closing.
Climate risk First Street
- Flood 6/10 Major FEMA zone X (unshaded) · 75% chance over 30 yrs
- Wildfire 1/10 Low
- Heat 4/10 Moderate 7 d/yr ≥97°F today · 16 d/yr by 30 yrs out
- Wind 3/10 Moderate 5% chance of damaging wind over 30 yrs
- Air quality 1/10 Low 0 unhealthy d/yr today · 0 by 30 yrs out
Nearby sold comps map
Loading sold comps map…
Walkable amenities ~0.75 mi
Loading nearby amenities…
Taxation est. · year 1
- Rental income
- $62,532
- − Mortgage interest
- −$20,670
- − Property taxes
- −$5,100
- − Insurance
- −$1,845
- − Repairs & maintenance
- −$5,003
- − Management
- −$5,003
- − Depreciation
- −$10,735
- Taxable income
- $14,178
- Est. tax owed @ 24.0%
- −$3,403
- After-tax cash flow
- $15,832/yr
For passive investors: Depreciation is non-cash, so a rental often shows a tax loss while cash-flowing — sheltering income. Rental losses are passive: they offset passive income freely, and up to $25,000/yr can offset ordinary (W-2) income if you actively participate and your MAGI is under $100k (phasing out to $0 by $150k); unused losses carry forward. On sale, claimed depreciation is recaptured at up to 25%, and gains may owe capital-gains tax (a 1031 exchange can defer both). Figures are a year-1 estimate at your 24.0% rate — not tax advice; consult a CPA.
Schools (NCES district)
- District
- Albany City School District
- NCES district ID
- 3602460
- Math proficiency
- 37% ▲ 6.00%
- Reading proficiency
- 40% ▲ 7.00%
- Median HH income
- $40,568
- Composite
- 32.34/100
- National rank
- #5744
- State rank
- #543 of 590 in NY
Livability — Albany
- Score
- 79/100
- State rank
- #129
- US rank
- #2083
Category grades
Schools grade is shown separately in the Schools card above.
Census & demographics
- Census place
- Albany, NY
- County
- Albany County · 196,626 people
- City population
- 116,921
- Metro
- Albany-Schenectady-Troy, NY
- Population (ZIP)
- 30,771
- Household income
- $83,147
- Rent vs Own
- Severe rent burden
- 1704.0
Population outlook (Albany County) Hauer SSP2
- Today (2025)
- 320,794 people
- By 2030
- 327,401 · +2.1%
- By 2040
- 338,218 · +5.4%
- By 2050
- 348,467 · +8.6%
- By 2075
- 381,693 · +19.0%
- By 2100
- 393,809 · +22.8%
Race, ethnicity, and origin ACS 2023
- Neighborhood character
- Predominantly White (69%)
- Race & ethnicity
- White 69% Black 10% Asian 8% Hispanic / Latino 7% Two or more races 7%
- Hispanic origin (detail)
- Mexican 2% Puerto Rican 2%
- Common ancestry
- Romanian 5% Lithuanian 3% Slovak 2%
- Foreign-born
- 16% · Canada, China, South Korea
- Languages at home
- 82% English-only · Other Indo-European 6% Spanish 3% Russian/Polish/Slavic 2%
Political lean MEDSL · Albany
- 2024 margin
- Strong D (+25.8) · D 62.9% · R 37.1%
- 2008→2024 swing
- -3.6pp toward R · 2008: 29.4pp · 2024: 25.8pp
- All cycles
- 2024: D+25.8 2020: D+31.4 2016: D+24.3 2012: D+31.0 2008: D+29.4
Not yet ingested
- Civics
- —
Market trends
- HPI YoY
- ▼ -133.05%
- Current HPI
- 296.0467
- Rent YoY
- ▲ 1.85%
- Metro
- Albany-Schenectady-Troy, NY
- State GDP YoY
- ▲ 2.60%
- F500 in state
- 92
Industry mix (Fortune 500 HQ in NY)
| Industry | F500 HQs | Revenue |
|---|---|---|
| Financial Services | 10 | $950B |
|
||
| Consumer Goods | 9 | $162B |
|
||
| Insurance | 4 | $225B |
|
||
| Telecommunications | 2 | $144B |
|
||
| Pharmaceuticals | 2 | $112B |
|
||
| Media / Entertainment | 2 | $69B |
|
||
Price history
-98.0% since first listed32 events — show timeline
- 2026-05-04 Price Changed $1,950 TURBOTENANT
- 2026-04-29 Listed for Rent $2,000 TURBOTENANT
- 2026-04-28 Rental Removed $2,000 TURBOTENANT
- 2026-04-21 Price Changed $2,000 TURBOTENANT
- 2026-04-19 Listed for Rent $2,100 TURBOTENANT
- 2026-04-17 Listed $369,000 Global MLS
- 2026-01-02 Rental Removed $1,650 TURBOTENANT
- 2025-12-23 Listing Removed — Global MLS
- 2025-12-17 Listed for Rent $1,650 TURBOTENANT
- 2025-12-04 Listed $269,000 Global MLS
- 2022-02-24 Price Changed $1,500 RENT.
- 2021-07-06 Sold (Public Records) $152,500 Public Records
- 2021-06-25 Sold (MLS) $152,500 HVCRMLS
- 2021-06-25 Sold (MLS) $152,500 OneKey® MLS as Distributed by MLS Grid
- 2021-06-25 Sold (MLS) $152,500 Global MLS
- 2021-03-31 Pending — OneKey® MLS as Distributed by MLS Grid
- 2021-03-30 Pending — Global MLS
- 2021-03-22 Listed $169,900 HVCRMLS
- 2021-03-22 Listed $169,900 HVCRMLS
- 2021-03-22 Listed $169,900 OneKey® MLS as Distributed by MLS Grid
- 2021-03-22 Listed $169,900 Global MLS
- 2011-06-13 Listing Removed — Global MLS
- 2011-02-01 Listed $105,000 Global MLS
- 2010-11-06 Listing Removed — Global MLS
- 2010-05-05 Listed $105,000 Global MLS
- 2007-06-29 Sold (MLS) $65,000 Global MLS
- 2007-06-12 Listing Removed — Global MLS
- 2007-05-30 Listed $59,000 Global MLS
- 2005-03-15 Sold (Public Records) $103,000 Public Records
- 2005-03-11 Sold (MLS) $100,000 Global MLS
- 2005-02-01 Listing Removed — Global MLS
- 2005-01-22 Listed $99,900 Global MLS
Property tax history
+7.1%/yrLatest (2025): $5,100 · -0.7% YoY. Source: county tax records.
Cash-flow waterfall
monthlySold comps — $/sqft
last 12 mo · ≤1 miLoading sold comps…