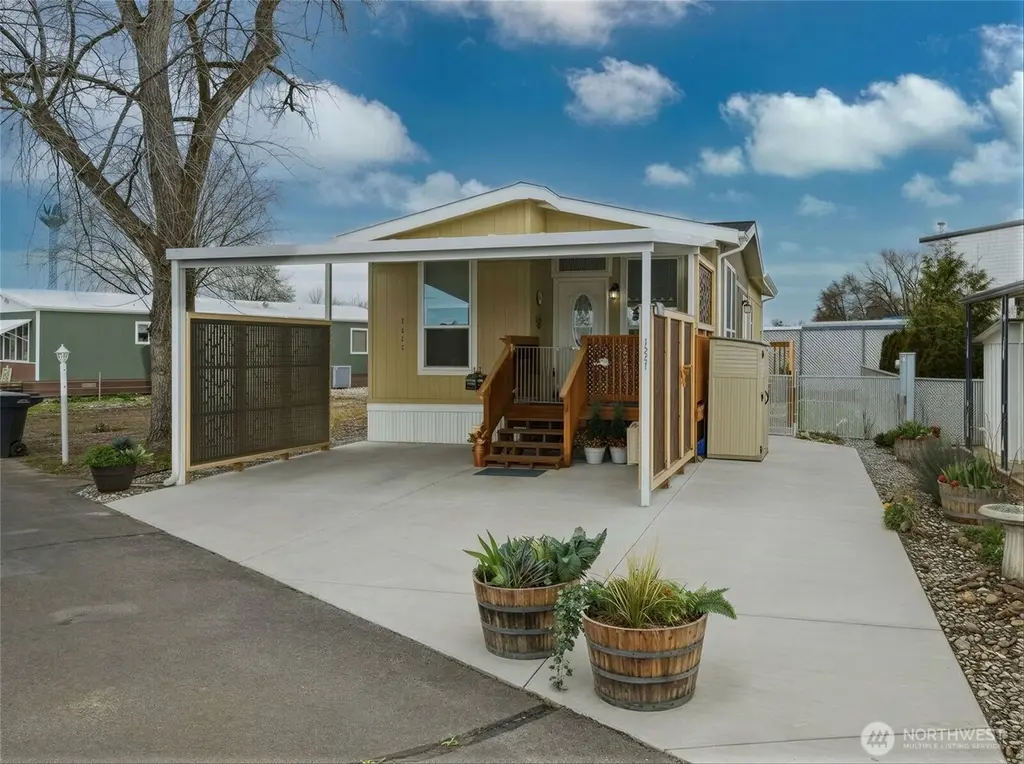
1221 Arkansas Dr · Walla Walla, WA
Flood risk 4/10 · Minor
- FEMA flood zone
- —
- Chance of flooding over 30 yrs
- 0.22%
- Est. flood insurance / yr
- —
Fire risk 1/10 · Minimal
- Est. fire insurance / yr
- $604 – $1,122
Heat risk 4/10 · Minor
- Hot days now (above 98°F)
- 7 days/yr
- Hot days in 30 yrs
- 15 days/yr
Wind risk 1/10 · Minimal
- Chance of severe wind over 30 yrs
- —
Air-quality risk 8/10 · Major
- Unhealthy air days now
- 9 days/yr
- Unhealthy air days in 30 yrs
- 13 days/yr
Risk factors via First Street. Map © Google.
Why this score? — see what drove the C- grade
The composite is a weighted blend of 9 inputs, each scored 0–100. Each bar is that input's sub-score; the figure is the points it added to the 100-point composite (weight × sub-score).
- Cash flow +17.8/30.0
- ARV discount +7.5/15.0
- DSCR +5.6/10.0
- 1% rule +4.2/10.0
- Schools +4.1/10.0
- Livability +4.0/5.0
- Condition / age +4.0/5.0
- Rent growth +3.1/5.0
- Appreciation +0.0/10.0
$154,500
🖨 Deal sheet (PDF) 📄 Offer letter ✓ Due diligence
Listing remarks
Welcome to this beautifully maintained, newer manufactured home where thoughtful design meets modern comfort. Purchased in 2025 & gently lived in by its original owner, this residence offers a near-new experience w/ a host of tasteful upgrades already in place. Step inside to an inviting open-concept layout, where a spacious living & dining area seamlessly connects to a bright, well-appointed kitchen. The stylish kitchen features ample cabinetry, generous counter space, a tile backsplash, stainless steel appliances, & a central island w/ bar seating & storage—perfect for casual dining & entertaining alike. The primary suite is complete w/ a large closet &
Key facts
- Bright kitchen
- Large closet
- Tiled backsplash
Tags
Neighborhood map
What this means for you Summary
Snapshot
- This is a 2-bed/2.0-bath manufactured listed at $154k. Condition is rated good.
Deal economics
- At list price, monthly cash flow is $126 ($2k/yr) — positive.
- The deal already cash-flows at list — no discount required.
- To meet the 1% rule (rent ≥ 1% of price), the offer needs to be $142k (8.0% below list).
- Recommended offer: $142k (8.0% below list) — sets the bar for 1% rule.
- Cap rate 7.3% vs local median 2.3% in Walla Walla — top-decile yield for the area; either an underpriced asset or a hidden risk that comps aren't pricing in. Stress-test before assuming the spread holds.
Location & tenants
- Location reads 79/100 on livability (#105 in WA, #2,015 nationally) — a middle-class / working-renter tenant base. Strengths: amenities A+, commute A+, housing A+; Watch: schools C-.
- Walla Walla Public Schools (urban): math 41% / reading 50% proficiency, ranked #179 of 291 in WA (top 62%) — families likely to look elsewhere, expect single-tenant / working-renter base with shorter leases.
- Market conditions: Rents rising (+2.4%/yr); 427 active listings in the ZIP; 14 comparable units currently listed for rent nearby; rentals lingering (median 46d on market — plan ~5-8 weeks vacancy on turnover, expect pricing pressure); 100% of comp listings sitting > 30 days — soft ceiling on asking rent; 206 units permitted in Walla Walla County in 2024 (50 in 5+ unit buildings).
Forward outlook
- Local home prices are declining (-3.0%/yr); year-one equity from $1k of loan paydown is wiped out by about $5k of value loss. Plan a longer hold.
- Walla Walla County population projected at +8% by 2050 — modest demand growth; plan on rents tracking national, not racing it.
Negotiation context
- It's been on market 57 days — a 3% lower offer ($150k) is reasonable based on typical stale-listing flexibility.
- 2 sale attempts since 2y ago; this cycle's ask has dropped $10k (6%) from the opening price — seller is motivated, your offer sets the floor, not the list.
Questions for the listing agent
- It's been on market 57 days. Have you received any prior offers? Is the seller open to a 8% concession, seller financing, or rate buy-down credit?
- Is there a deadline driving the sale (1031 exchange, divorce, estate, relocation)? That informs how much negotiation room exists.
- What's the average days-on-market for RENTAL listings here right now (not sales)? A rising rental-DOM trend means longer vacancies and softer asking-rent achievability than the comps imply.
- What's the recent tenant-quality profile in this submarket — average credit score on applications, eviction rate, late-payment / NSF rate, and stable-employment percentage? A property-management company in the area should have these aggregated.
- How much new for-sale + rental construction is in the pipeline within 1–3 miles? Heavy new supply typically softens prices + rents 12–24 months out; constrained supply supports both.
Investment metrics
- 1% rule
- 0.92% ✗
- Cap rate
- 7.27%
- Cash-on-cash
- 3.51%
- DSCR
- 1.16
- GRM
- 9.1
CMA / ARV
- ARV (median comp)
- $44,929
- List price
- $154,500
- Delta
- 243.87%
- Verdict
- OVERPRICED
- Comps
- 6 within 1.0 mi
Show comp detail 9 sales within ~0.75 mi
| Address | Dist | Beds/Ba | Sqft | Sold | Price | $/sf | Match |
|---|---|---|---|---|---|---|---|
| 1253 Arkansas Dr | 0.07mi | 2/1.0 | 800 (-1%) | 6mo | $44,900 | $56 | 86 |
| 1308 Samuel Dr | 0.09mi | 2/1.0 | 826 (+2%) | 5mo | $45,000 | $54 | 84 |
| 1205 Arkansas Dr | 0.04mi | 2/1.0 | 840 (+4%) | 12mo | $65,000 | $77 | 78 |
| 1315 Dixie Ln | 0.29mi | 2/2.0 | 924 (+14%) | 1mo | $44,000 | $48 | 62 |
| 1306 Dixie Ln | 0.31mi | 2/1.0 | 784 (-3%) | 23mo | $15,000 | $19 | 57 |
| 1311 Dixie Ln | 0.29mi | 2/1.0 | 752 (-7%) | 20mo | $56,000 | $74 | 54 |
| 1308 Fort Ln | 0.35mi | 2/2.0 | 924 (+14%) | 10mo | $18,500 | $20 | 52 |
| 1309 Tollgate Ln | 0.26mi | 2/1.0 | 882 (+9%) | 23mo | $17,000 | $19 | 50 |
| 1317 Fort Ln | 0.33mi | 2/1.0 | 924 (+14%) | 21mo | $49,000 | $53 | 40 |
Match score weights: distance 35% · size 25% · config 20% · recency 20%. Top-matched comps best support the ARV.
Projected returns pro-forma
-3.0% appreciation · 2.4% rent growth · sell at horizon
- IRR
- -11.4%
- Equity multiple
- 0.59×
- Total profit
- $-17,859
- Equity at exit
- $23,036
- IRR
- -3.1%
- Equity multiple
- 0.80×
- Total profit
- $-8,732
- Equity at exit
- $13,358
Cash invested: $43,260 (down + closing). Projections, not guarantees.
Landlord ↔ Tenant lean methodology
- Overall (STATE)
- 28 Tenant-Leaning
- State Washington
- 28 Tenant-Leaning · D+8
- County
- — inherits STATE
- City
- — inherits STATE
ZIP-level market 99362
- Rents YoY
- 2.4%
- Active inventory
- 427
- Price-to-rent
- 9.1×
Monthly cashflow live
- Estimated rent
- $1,421 high interval (Pro) →
- Mortgage (P&I)
- −$810
- Tax from tax record
- −$121 /mo · $1,457/yr
- Insurance
- −$64
- HOA
- −$0
- Vacancy / Maint / Mgmt
- −$298
- Net cashflow
- $126
Break-even live
Sensitivity live
| Price | -10% $214 | -5% $170 | +0% $126 | +5% $83 | +10% $39 |
|---|---|---|---|---|---|
| Rent | -10% $14 | -5% $70 | +0% $126 | +5% $183 | +10% $239 |
| Rate | -1.0pp $204 | -0.5pp $166 | base $126 | +0.5pp $86 | +1.0pp $46 |
UW: 25.0% down · 7.5% · 30yr · 1.5% tax · 5.0% vac · 8.0% maint · 8.0% mgmt
Financing live
Cash to close
- Down payment
- $38,625
- Closing costs
- $4,635
- Reserves months
- —
- Total cash needed
- —
Loan-product check · same deal, 3 products live
Conventional
25% down · 7.5% · 30yr
- Down + closing
- —
- Monthly P&I
- —
- Monthly cashflow
- —
- DSCR
- —
- Eligible?
- —
Personal DTI + credit; lowest rate.
DSCR
20% down · 8.5% · 30yr
- Down + closing
- —
- Monthly P&I
- —
- Monthly cashflow
- —
- DSCR
- —
- Eligible?
- —
No personal income docs; deal must DSCR.
Hard money
10% down · 12.0% · 12mo
- Down + closing
- —
- Monthly P&I
- —
- Monthly cashflow
- —
- DSCR
- —
- Eligible?
- —
Short-term bridge; refi at stabilization.
Rent comps 14 comps
| Address | Beds | Baths | Sqft | Rent | $/sqft | DOM | Units | Dist |
|---|---|---|---|---|---|---|---|---|
| 208 Marjorie Pl Unit marj208 Walla Walla, WA | 3.0 | 2.0 | 1080 | $1,295 | $1.20 | 45d | 1 | 0.68mi |
| 1914 Sunset Dr Unit 1914SUN-B Walla Walla, WA | 2.0 | 1.5 | 952 | $1,625 | $1.71 | 45d | 1 | 0.72mi |
| 831 S 2nd Ave #2 Walla Walla, WA | 2.0 | 1.0 | 620 | $1,495 | $2.41 | 45d | 1 | 0.84mi |
| 330 S 4th Ave Unit 1 Walla Walla, WA | 1.0 | 1.0 | 550 | $900 | $1.64 | 45d | 1 | 0.84mi |
| 332 S 3rd Ave Walla Walla, WA | 2.0 | 1.0 | 1084 | $1,630 | $1.50 | 45d | 1 | 0.90mi |
| 420 Catherine St #3 Walla Walla, WA | 2.0 | 1.0 | 890 | $1,295 | $1.46 | 45d | 1 | 1.09mi |
| 101 Kenwood St #205 Walla Walla, WA | 2.0 | 1.0 | 845 | $1,325 | $1.57 | 45d | 1 | 1.15mi |
| 2121 S 2nd Ave Apt 304 Walla Walla, WA | 2.0 | 1.5 | 975 | $1,530 | $1.57 | 45d | 1 | 1.15mi |
| 385 Catherine St Unit 387C Walla Walla, WA | 1.0 | 1.0 | 550 | $950 | $1.73 | 45d | 1 | 1.18mi |
| 942 NE Spitzenburg St Apt B104 College Place, WA | 2.0 | 1.5 | 975 | $1,530 | $1.57 | 45d | 1 | 1.27mi |
| 104 S Palouse St Walla Walla, WA | 1.0 | 1.0 | 800 | $1,100 | $1.38 | 45d | 1 | 1.30mi |
| 378 S Park St Walla Walla, WA | 2.0 | 1.5 | 800 | $1,200 | $1.50 | 45d | 1 | 1.30mi |
| 105 N Spokane St Unit 201 Walla Walla, WA | 2.0 | 1.0 | 750 | $1,250 | $1.67 | 45d | 1 | 1.32mi |
| 327 E Rose St Walla Walla, WA | 1.0–2.0 | 1.0–2.0 | 863 | $2,421 | $2.80 | 45d | 8 | 1.42mi |
Listing history 6 events
-
2026-05-17status Pending
-
2026-03-27price $154,500
-
2026-03-20$164,000 Active
-
2025-01-17soldstatus $149,000 Closed
-
2025-01-10status Pending
-
2024-06-01$159,000 Active
ⓘ Source: listings_history table (triggers on properties + properties_extension) + one-shot
backfill from property_details.listing_events for pre-trigger history.
Tax reassessment forecast WA · Resets to sale price
- Current annual tax
- $1,457 · $121/mo
- Projected year-2 tax
- $1,514 · $126/mo
- Expected delta
- +$57/yr (+$5/mo · 3.9%)
ⓘ Screening estimate from a state-policy table — verify with the county assessor before closing.
Climate risk First Street
- Flood 4/10 Moderate 22% chance over 30 yrs
- Wildfire 1/10 Low
- Heat 4/10 Moderate 7 d/yr ≥98°F today · 15 d/yr by 30 yrs out
- Wind 1/10 Low
- Air quality 8/10 Severe 9 unhealthy d/yr today · 13 by 30 yrs out
Nearby sold comps map
Loading sold comps map…
Walkable amenities ~0.75 mi
Loading nearby amenities…
Taxation est. · year 1
- Rental income
- $17,050
- − Mortgage interest
- −$8,654
- − Property taxes
- −$1,457
- − Insurance
- −$772
- − Repairs & maintenance
- −$1,364
- − Management
- −$1,364
- − Depreciation
- −$4,495
- Taxable loss
- −$1,057
- Est. tax savings @ 24.0%
- +$254
- After-tax cash flow
- $1,771/yr
For passive investors: Depreciation is non-cash, so a rental often shows a tax loss while cash-flowing — sheltering income. Rental losses are passive: they offset passive income freely, and up to $25,000/yr can offset ordinary (W-2) income if you actively participate and your MAGI is under $100k (phasing out to $0 by $150k); unused losses carry forward. On sale, claimed depreciation is recaptured at up to 25%, and gains may owe capital-gains tax (a 1031 exchange can defer both). Figures are a year-1 estimate at your 24.0% rate — not tax advice; consult a CPA.
Condition & rehab AI · 12 photos
This well-maintained, newer manufactured home offers a near-new experience with tasteful upgrades already in place.
Value-add opportunities
- Both landscaping — improves curb appeal and adds value
- Both painting — refreshes the home's appearance and adds value
- Both HVAC maintenance — ensures comfort and energy efficiency
Renovation cost estimate screening
Value-add ROI direction
- Both landscaping — improves curb appeal and adds value ↑
- Both painting — refreshes the home's appearance and adds value ↑
- Both HVAC maintenance — ensures comfort and energy efficiency ↑
ⓘ Cost ranges are severity-bucket heuristics (US national rule-of-thumb). Get contractor quotes + a written scope before underwriting a rehab budget.
Schools (NCES district)
- District
- Walla Walla Public Schools
- NCES district ID
- 5309450
- Math proficiency
- 41% ▲ 3.00%
- Reading proficiency
- 50% ▼ -1.00%
- Median HH income
- $46,207
- Composite
- 40.88/100
- National rank
- #7531
- State rank
- #179 of 291 in WA
Livability — Walla Walla
- Score
- 79/100
- State rank
- #105
- US rank
- #2015
Category grades
Schools grade is shown separately in the Schools card above.
Census & demographics
- Census place
- Walla Walla, WA
- County
- Walla Walla County · 52,990 people
- City population
- 42,853
- Metro
- Walla Walla, WA
- Population (ZIP)
- 42,853
- Household income
- $72,474
- Rent vs Own
- Severe rent burden
- 1238.0
Population outlook (Walla Walla County) Hauer SSP2
- Today (2025)
- 63,088 people
- By 2030
- 64,417 · +2.1%
- By 2040
- 66,563 · +5.5%
- By 2050
- 68,337 · +8.3%
- By 2075
- 73,235 · +16.1%
- By 2100
- 74,878 · +18.7%
Race, ethnicity, and origin ACS 2023
- Neighborhood character
- Predominantly White (69%)
- Race & ethnicity
- White 69% Hispanic / Latino 22% Two or more races 9% Black 2% Asian 2% Native American 2%
- Hispanic origin (detail)
- Mexican 17%
- Common ancestry
- Slovak 3% Portuguese 3% Lithuanian 3%
- Foreign-born
- 9% · Canada, China
- Languages at home
- 83% English-only · Spanish 15% Chinese 1%
Political lean MEDSL · Walla Walla
- 2024 margin
- Lean R (+8.1) · D 44.6% · R 52.7% · Other 2.7%
- 2008→2024 swing
- +8.5pp toward D · 2008: -16.6pp · 2024: -8.1pp
- All cycles
- 2024: R+8.1 2020: R+8.7 2016: R+16.4 2012: R+22.3 2008: R+16.6
Not yet ingested
- Civics
- —
Market trends
- HPI YoY
- ▼ -488.03%
- Current HPI
- 321.6891
- Rent YoY
- ▲ 2.40%
- Metro
- Walla Walla, WA
- State GDP YoY
- ▲ 4.65%
- F500 in state
- 22
Industry mix (Fortune 500 HQ in WA)
| Industry | F500 HQs | Revenue |
|---|---|---|
| Retail | 2 | $269B |
|
||
| Technology / Retail | 1 | $638B |
|
||
| Technology | 1 | $245B |
|
||
| Telecommunications | 1 | $38B |
|
||
| Food / Beverage | 1 | $36B |
|
||
| Automotive / Trucks | 1 | $34B |
|
||
Price history
-2.8% since first listed6 events — show timeline
- 2026-05-17 Pending — NWMLS as Distributed by MLS Grid
- 2026-03-27 Price Changed $154,500 NWMLS as Distributed by MLS Grid
- 2026-03-20 Listed $164,000 NWMLS as Distributed by MLS Grid
- 2025-01-17 Sold (MLS) $149,000 NWMLS as Distributed by MLS Grid
- 2025-01-10 Pending — NWMLS as Distributed by MLS Grid
- 2024-06-01 Listed $159,000 NWMLS as Distributed by MLS Grid
Property tax history
+61.2%/yrLatest (2026): $1,457 · -1.3% YoY. Source: county tax records.
Cash-flow waterfall
monthlySold comps — $/sqft
last 12 mo · ≤1 miLoading sold comps…