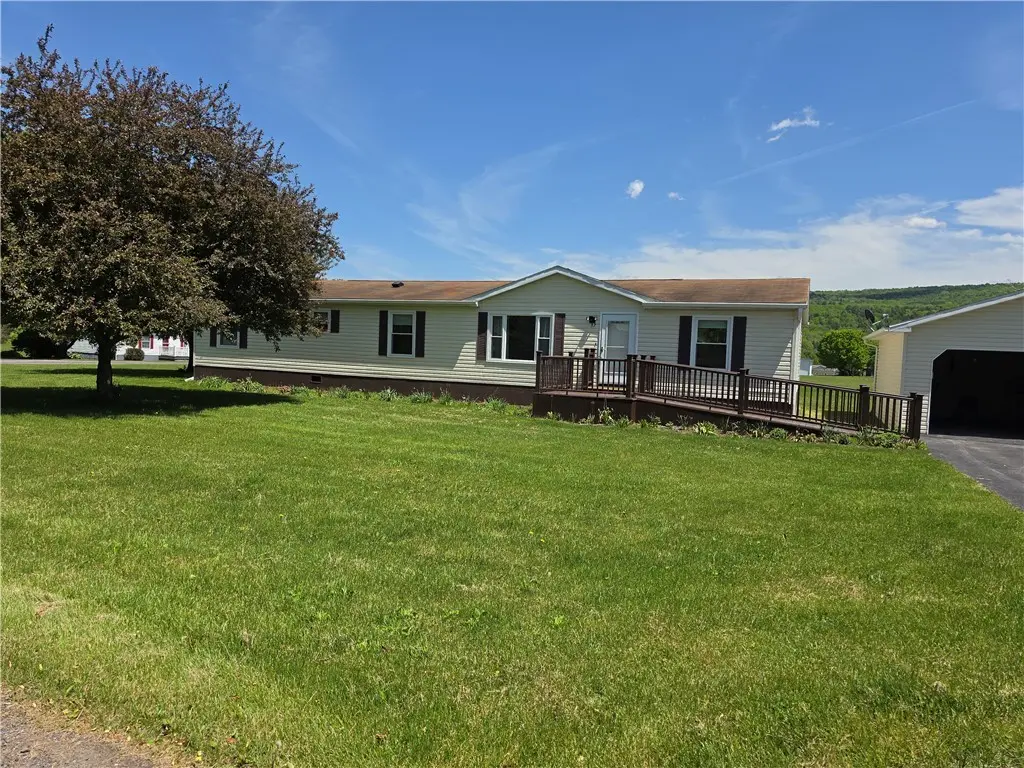
516 County Route 11 · Laurens, NY
Flood risk 1/10 · Minimal
- FEMA flood zone
- X (unshaded)
- Chance of flooding over 30 yrs
- 0.0%
- Est. flood insurance / yr
- $473 – $860
Fire risk 1/10 · Minimal
- Est. fire insurance / yr
- $691 – $1,283
Heat risk 2/10 · Minimal
- Hot days now (above 92°F)
- 7 days/yr
- Hot days in 30 yrs
- 17 days/yr
Wind risk 2/10 · Minimal
- Chance of severe wind over 30 yrs
- 1.0%
Air-quality risk 1/10 · Minimal
- Unhealthy air days now
- 0 days/yr
- Unhealthy air days in 30 yrs
- 0 days/yr
Risk factors via First Street. Map © Google.
Why this score? — see what drove the D- grade
The composite is a weighted blend of 9 inputs, each scored 0–100. Each bar is that input's sub-score; the figure is the points it added to the 100-point composite (weight × sub-score).
- Cash flow +7.8/30.0
- ARV discount +7.5/15.0
- Appreciation +7.3/10.0
- Schools +4.6/10.0
- Livability +3.0/5.0
- Rent growth +2.5/5.0
- Condition / age +2.5/5.0
- 1% rule +2.3/10.0
- DSCR +1.8/10.0
$175,000
🖨 Deal sheet 📄 Offer letter ✓ Due diligence
Listing remarks
Enjoy one-level living in this spacious, well-maintained 3-bedroom, 2-bath home located in the 55+ Little Red Schoolhouse Community. The open layout offers both a comfortable living room for quiet relaxation and a family room off of the breakfast area. A separate dining room provides a more formal setting. The primary suite includes a bathroom with a walk-in shower and soaking tub. A large back deck overlooks the well-kept park. The front deck was rebuilt two years ago with a ramp added and the option to install a roof. All windows have been replaced by Sash Windows within the past three years, and an additional warranty is available for $100. The furnace was replaced in 2018, along with th
Key facts
- Large back deck
- Furnace replaced
- Open layout
Tags
Property features AI
Finance
- Financial info: Has land lease with monthly amount of $439
- HOA & community: Annual association fee of $20; Clubhouse available
Exterior
- Parking: Detached garage; 2 garage spaces
- Utilities: Public water connected; Septic tank sewer
- Home design: Double-wide mobile home; Single-story; Existing/resale property; Slab foundation
- Construction: Vinyl siding
- Exterior features: Blacktop driveway; Leased propane tank; Rectangular lot
Interior
- Kitchen: Gas cooktop; Microwave; Refrigerator; Dishwasher
- Bedrooms: 3 main-level bedrooms
- Flooring: Carpet; Tile; Varied flooring
- Bathrooms: 2 full bathrooms (both on the main level)
- Heating & cooling: Forced air heating (propane); Central air conditioning
- Interior features: Breakfast area; Separate/formal dining room; Main-level primary suite; Primary suite
- Laundry & utility: Main-level laundry; Washer; Dryer; Electric water heater
Neighborhood map
What this means for you Summary
Snapshot
- This is a 3-bed/2.0-bath manufactured listed at $175k.
Deal economics
- At list price, monthly cash flow is $-198 ($-2k/yr) — negative.
- To cash-flow at today's rent, offer at most $146k (16.3% below list).
- To meet the 1% rule (rent ≥ 1% of price), the offer needs to be $128k (26.7% below list).
- Recommended offer: $128k (26.7% below list) — sets the bar for 1% rule.
Location & tenants
- Location reads 60/100 on livability (#1,003 in NY) — a middle-class / working-renter tenant base. Strengths: cost of living A+, housing A+; Watch: health & safety C-, crime F, amenities F.
- Laurens Central School District (rural): math 55% / reading 50% proficiency, ranked #423 of 755 in NY (top 56%) — acceptable for families but not a draw, mixed tenant base, ~2y average lease.
- Market conditions: 9 active listings in the ZIP; 133 units permitted in Otsego County in 2024 (10 in 5+ unit buildings).
Forward outlook
- In year one you build about $9k of equity ($1k loan paydown + $8k appreciation (4.6% local appreciation)).
- Otsego County population projected at -21% by 2050 — secular population decline; favor cash flow + early exit over multi-decade hold.
- By year 4, paydown + projected appreciation supports a ~$31k cash-out refi (75% LTV) — recoverable capital for the next deal without selling this one.
Negotiation context
- It's been on market 23 days — a 2% lower offer ($172k) is reasonable based on typical stale-listing flexibility.
Questions for the listing agent
- What do current leases actually rent for vs. the listed asking? Can we see a recent rent roll and the last 12 months of T-12 income?
- What does the HOA fee cover, when was the last increase, and are there any pending special assessments or reserve-fund shortfalls?
- Is there a deadline driving the sale (1031 exchange, divorce, estate, relocation)? That informs how much negotiation room exists.
- Crime grade is F in this area — have there been break-ins, vandalism, or insurance claims at this property in the last 3 years? What carrier currently insures it and at what premium?
- The area grade is low — what's the realistic commute time and amenity access for the typical tenant pool here? Any planned neighborhood developments (good or bad) we should know about?
- What's the average days-on-market for RENTAL listings here right now (not sales)? A rising rental-DOM trend means longer vacancies and softer asking-rent achievability than the comps imply.
- What's the recent tenant-quality profile in this submarket — average credit score on applications, eviction rate, late-payment / NSF rate, and stable-employment percentage? A property-management company in the area should have these aggregated.
- How much new for-sale + rental construction is in the pipeline within 1–3 miles? Heavy new supply typically softens prices + rents 12–24 months out; constrained supply supports both.
Investment metrics
- 1% rule
- 0.73% ✗
- Cap rate
- 4.94%
- Cash-on-cash
- -4.84%
- DSCR
- 0.78
- GRM
- 11.4
CMA / ARV
No comps found within radius.
Projected returns pro-forma
4.58% appreciation · 3.0% rent growth · sell at horizon
- IRR
- 7.6%
- Equity multiple
- 1.48×
- Total profit
- $23,562
- Equity at exit
- $94,700
- IRR
- 9.7%
- Equity multiple
- 2.72×
- Total profit
- $84,274
- Equity at exit
- $159,858
Cash invested: $49,000 (down + closing). Projections, not guarantees.
Landlord ↔ Tenant lean methodology
- Overall (STATE)
- 15 Strongly Tenant-Friendly
- State New York
- 15 Strongly Tenant-Friendly · D+10
- County
- — inherits STATE
- City
- — inherits STATE
ZIP-level market 13796
- Home prices YoY
- 1.3%
- Active inventory
- 9
- Price-to-rent
- 11.4×
Monthly cashflow live
- Estimated rent
- $1,283 medium interval (Pro) →
- Mortgage (P&I)
- −$918
- Tax est. 1.5%
- −$219 /mo · $2,625/yr
- Insurance
- −$73
- HOA
- −$2
- Vacancy / Maint / Mgmt
- −$269
- Net cashflow
- $-198
Break-even live
UW: 25.0% down · 7.5% · 30yr · 1.5% tax · 5.0% vac · 8.0% maint · 8.0% mgmt
Financing live
Cash to close
- Down payment
- $43,750
- Closing costs
- $5,250
- Reserves months
- —
- Total cash needed
- —
Loan-product check · same deal, 3 products live
Conventional
25% down · 7.5% · 30yr
- Down + closing
- —
- Monthly P&I
- —
- Monthly cashflow
- —
- DSCR
- —
- Eligible?
- —
Personal DTI + credit; lowest rate.
DSCR
20% down · 8.5% · 30yr
- Down + closing
- —
- Monthly P&I
- —
- Monthly cashflow
- —
- DSCR
- —
- Eligible?
- —
No personal income docs; deal must DSCR.
Hard money
10% down · 12.0% · 12mo
- Down + closing
- —
- Monthly P&I
- —
- Monthly cashflow
- —
- DSCR
- —
- Eligible?
- —
Short-term bridge; refi at stabilization.
HOA detail
- Monthly dues
- $2 · $24/yr
Listing history 17 events
-
2026-06-19days on market $175,000 Active 23 DOM
-
2026-06-18days on market $175,000 Active 22 DOM
-
2026-06-17days on market $175,000 Active 21 DOM
-
2026-06-16days on market $175,000 Active 20 DOM
-
2026-06-15days on market $175,000 Active 19 DOM
-
2026-06-14days on market $175,000 Active 17 DOM
-
2026-06-12days on market $175,000 Active 16 DOM
-
2026-06-09days on market $175,000 Active 13 DOM
-
2026-06-08days on market $175,000 Active 12 DOM
-
2026-06-07days on market $175,000 Active 11 DOM
-
2026-06-05days on market $175,000 Active 9 DOM
-
2026-06-03days on market $175,000 Active 7 DOM
-
2026-06-02days on market $175,000 Active 6 DOM
-
2026-06-01days on market $175,000 Active 5 DOM
-
2026-05-31days on market $175,000 Active 4 DOM
-
2026-05-31days on market $175,000 Active 3 DOM
-
2026-05-27$175,000 Active
ⓘ Source: listings_history table (triggers on properties + properties_extension) + one-shot
backfill from property_details.listing_events for pre-trigger history.
Climate risk First Street
- Flood 1/10 Low FEMA zone X (unshaded) · 0% chance over 30 yrs
- Wildfire 1/10 Low
- Heat 2/10 Low 7 d/yr ≥92°F today · 17 d/yr by 30 yrs out
- Wind 2/10 Low 100% chance of damaging wind over 30 yrs
- Air quality 1/10 Low 0 unhealthy d/yr today · 0 by 30 yrs out
Nearby sold comps map
Loading sold comps map…
Walkable amenities ~0.75 mi
Loading nearby amenities…
Taxation est. · year 1
- Rental income
- $15,398
- − Mortgage interest
- −$9,803
- − Property taxes
- −$2,625
- − Insurance
- −$875
- − Repairs & maintenance
- −$1,232
- − Management
- −$1,232
- − HOA
- −$24
- − Depreciation
- −$5,091
- Taxable loss
- −$5,483
- Est. tax savings @ 24.0%
- +$1,316
- After-tax cash flow
- $-1,056/yr
For passive investors: Depreciation is non-cash, so a rental often shows a tax loss while cash-flowing — sheltering income. Rental losses are passive: they offset passive income freely, and up to $25,000/yr can offset ordinary (W-2) income if you actively participate and your MAGI is under $100k (phasing out to $0 by $150k); unused losses carry forward. On sale, claimed depreciation is recaptured at up to 25%, and gains may owe capital-gains tax (a 1031 exchange can defer both). Figures are a year-1 estimate at your 24.0% rate — not tax advice; consult a CPA.
Schools (NCES district)
- District
- Laurens Central School District
- NCES district ID
- 3616800
- Math proficiency
- 55% ▲ 5.00%
- Reading proficiency
- 50% ▬ 0.00%
- Median HH income
- $46,144
- Composite
- 46.42/100
- National rank
- #5346
- State rank
- #423 of 755 in NY
Livability — Laurens
- Score
- 60/100
- State rank
- #1003
- US rank
- #19540
Category grades
Schools grade is shown separately in the Schools card above.
Census & demographics
- Population (ZIP)
- 915
Population outlook (Otsego County) Hauer SSP2
- Today (2025)
- 57,987 people
- By 2030
- 55,403 · -4.5%
- By 2040
- 50,336 · -13.2%
- By 2050
- 45,715 · -21.2%
- By 2075
- 38,769 · -33.1%
- By 2100
- 33,468 · -42.3%
Race, ethnicity, and origin ACS 2023
- Neighborhood character
- Predominantly White (92%)
- Race & ethnicity
- White 92% Hispanic / Latino 4% Two or more races 3% Pacific Islander 1%
- Common ancestry
- Romanian 8% Lithuanian 3% Portuguese 2%
- Languages at home
- 98% English-only · German/W. Germanic 1% Spanish 1%
Political lean MEDSL · Otsego
- 2024 margin
- Lean R (+7.9) · D 46.1% · R 53.9%
- 2008→2024 swing
- -13.8pp toward R · 2008: 5.9pp · 2024: -7.9pp
- All cycles
- 2024: R+7.9 2020: R+5.0 2016: R+13.0 2012: D+2.0 2008: D+5.9
Not yet ingested
- Civics
- —
Market trends
- HPI YoY
- ▲ 4.58%
- Current HPI
- 367.0953
- Rent YoY
- —
- Metro
- —
- State GDP YoY
- ▲ 2.60%
- F500 in state
- 92
Industry mix (Fortune 500 HQ in NY)
| Industry | F500 HQs | Revenue |
|---|---|---|
| Financial Services | 10 | $950B |
|
||
| Consumer Goods | 9 | $162B |
|
||
| Insurance | 4 | $225B |
|
||
| Telecommunications | 2 | $144B |
|
||
| Pharmaceuticals | 2 | $112B |
|
||
| Media / Entertainment | 2 | $69B |
|
||
Price history
1 event — show timeline
- 2026-05-27 Listed $175,000 UNYREIS
Cash-flow waterfall
monthlySold comps — $/sqft
last 12 mo · ≤1 miLoading sold comps…