17260 Southern Haven Dr · Wimauma, FL
Flood risk No data
- FEMA flood zone
- —
- Chance of flooding over 30 yrs
- —
- Est. flood insurance / yr
- —
Fire risk No data
- Est. fire insurance / yr
- —
Heat risk No data
- Hot days now (above threshold)
- —
- Hot days in 30 yrs
- —
Wind risk No data
- Chance of severe wind over 30 yrs
- —
Air-quality risk No data
- Unhealthy air days now
- —
- Unhealthy air days in 30 yrs
- —
Risk factors via First Street. Map © Google.
Why this score? — see what drove the C- grade
The composite is a weighted blend of 9 inputs, each scored 0–100. Each bar is that input's sub-score; the figure is the points it added to the 100-point composite (weight × sub-score).
- Cash flow +17.5/30.0
- ARV discount +7.5/15.0
- DSCR +5.5/10.0
- 1% rule +4.7/10.0
- Schools +4.2/10.0
- Condition / age +4.0/5.0
- Appreciation +3.8/10.0
- Livability +3.2/5.0
- Rent growth +1.9/5.0
$249,490
🖨 Deal sheet 📄 Offer letter ✓ Due diligence
Listing remarks
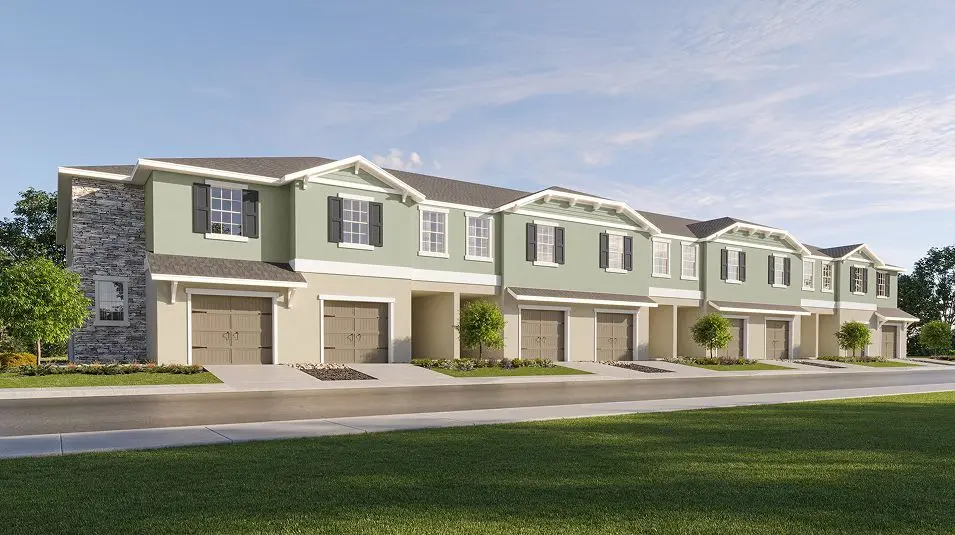
Luxury is in the details of this charming two-story townhome. The first floor enjoys an airy design among the spacious living room, kitchen and dining room, opening to the covered patio for serene outdoor moments. Upstairs, an adaptable central loft leads to two secondary bedrooms and the tranquil owner's suite. The owner's suite is in a privately situated corner, showcasing a full-sized bathroom and large walk-in closet.
Key facts
- Central loft
- Covered patio
- Full sized bathroom
Tags
Property features AI
Finance
- Financial info: List price $249,490
Exterior
- Home design: St. Thomas II plan
- Exterior features: Living area approximately 1,666
Interior
- Bedrooms: 3 bedrooms
- Bathrooms: 2 full bathrooms and 1 half bathroom (2.5 total)
- Interior features: Spec new construction
Neighborhood map
What this means for you Summary
Snapshot
- This is a 3-bed/2.5-bath townhouse listed at $249k. Condition is rated good.
Deal economics
- At list price, monthly cash flow is $190 ($2k/yr) — positive.
- The deal already cash-flows at list — no discount required.
- To meet the 1% rule (rent ≥ 1% of price), the offer needs to be $242k (2.9% below list).
- Recommended offer: $242k (2.9% below list) — sets the bar for 1% rule.
- Cap rate 7.2% vs local median 4.5% in Wimauma — top-decile yield for the area; either an underpriced asset or a hidden risk that comps aren't pricing in. Stress-test before assuming the spread holds.
Location & tenants
- Location reads 64/100 on livability (#699 in FL) — a middle-class / working-renter tenant base. Strengths: commute A, cost of living A-, crime B; Watch: schools F, amenities F, employment D-.
- Hillsborough (suburban): math 47% / reading 50% proficiency, ranked #41 of 73 in FL (top 56%) — families likely to look elsewhere, expect single-tenant / working-renter base with shorter leases.
- Market conditions: Rents soft (-2.5%/yr); 674 active listings in the ZIP; 28 comparable units currently listed for rent nearby; rentals at typical pace (median 25d on market — plan ~3-4 weeks tenant-placement turnaround); solid renter incomes; 9,053 units permitted in Hillsborough County in 2024 (4,555 in 5+ unit buildings).
Forward outlook
- Local home prices are declining (-2.4%/yr); year-one equity from $2k of loan paydown is wiped out by about $6k of value loss. Plan a longer hold.
- Hillsborough County population projected at +37% by 2050 — long-run rental-demand tailwind backs the buy-and-hold thesis.
Negotiation context
- Only 12 days on market — expect competitive offers; lowballing is unlikely to land.
Questions for the listing agent
- Is there a deadline driving the sale (1031 exchange, divorce, estate, relocation)? That informs how much negotiation room exists.
- Schools are F-rated, which usually means shorter tenancies and higher turnover. Who's the typical renter profile here, and what's been the actual vacancy rate?
- What's the average days-on-market for RENTAL listings here right now (not sales)? A rising rental-DOM trend means longer vacancies and softer asking-rent achievability than the comps imply.
- What's the recent tenant-quality profile in this submarket — average credit score on applications, eviction rate, late-payment / NSF rate, and stable-employment percentage? A property-management company in the area should have these aggregated.
- How much new for-sale + rental construction is in the pipeline within 1–3 miles? Heavy new supply typically softens prices + rents 12–24 months out; constrained supply supports both.
Investment metrics
- 1% rule
- 0.97% ✗
- Cap rate
- 7.21%
- Cash-on-cash
- 3.26%
- DSCR
- 1.15
- GRM
- 8.6
CMA / ARV
No comps found within radius.
Projected returns pro-forma
-2.35% appreciation · 0.0% rent growth · sell at horizon
- IRR
- -10.9%
- Equity multiple
- 0.59×
- Total profit
- $-28,512
- Equity at exit
- $44,527
- IRR
- -6.8%
- Equity multiple
- 0.56×
- Total profit
- $-30,516
- Equity at exit
- $34,371
Cash invested: $69,857 (down + closing). Projections, not guarantees.
Landlord ↔ Tenant lean methodology
- Overall (STATE)
- 87 Strongly Landlord-Friendly
- State Florida
- 87 Strongly Landlord-Friendly · R+3
- County
- — inherits STATE
- City
- — inherits STATE
ZIP-level market 33598
- Home prices YoY
- -0.9%
- Rents YoY
- -2.5%
- Active inventory
- 674
- Price-to-rent
- 8.6×
Monthly cashflow live
- Estimated rent
- $2,423 high interval (Pro) →
- Mortgage (P&I)
- −$1,308
- Tax est. 1.5%
- −$312 /mo · $3,742/yr
- Insurance
- −$104
- HOA
- −$0
- Vacancy / Maint / Mgmt
- −$509
- Net cashflow
- $190
Break-even live
UW: 25.0% down · 7.5% · 30yr · 1.5% tax · 5.0% vac · 8.0% maint · 8.0% mgmt
Financing live
Cash to close
- Down payment
- $62,372
- Closing costs
- $7,485
- Reserves months
- —
- Total cash needed
- —
Loan-product check · same deal, 3 products live
Conventional
25% down · 7.5% · 30yr
- Down + closing
- —
- Monthly P&I
- —
- Monthly cashflow
- —
- DSCR
- —
- Eligible?
- —
Personal DTI + credit; lowest rate.
DSCR
20% down · 8.5% · 30yr
- Down + closing
- —
- Monthly P&I
- —
- Monthly cashflow
- —
- DSCR
- —
- Eligible?
- —
No personal income docs; deal must DSCR.
Hard money
10% down · 12.0% · 12mo
- Down + closing
- —
- Monthly P&I
- —
- Monthly cashflow
- —
- DSCR
- —
- Eligible?
- —
Short-term bridge; refi at stabilization.
Rent comps 28 comps
| Address | Beds | Baths | Sqft | Rent | $/sqft | DOM | Units | Dist |
|---|---|---|---|---|---|---|---|---|
| 17247 Southern Haven Dr Wimauma, FL | 3.0 | 2.5 | 1660 | $2,300 | $1.39 | 18d | 1 | 0.02mi |
| 17224 Auburn Arch Loop Wimauma, FL | 2.0–4.0 | 2.5 | 1517 | $2,600 | $1.71 | 18d | 20 | 0.24mi |
| 17134 White Mangrove Dr Wimauma, FL | 4.0 | 2.0 | 1935 | $2,395 | $1.24 | 24d | 1 | 0.51mi |
| 17345 White Mangrove Dr Wimauma, FL | 4.0 | 2.5 | 1870 | $2,650 | $1.42 | 14d | 1 | 0.62mi |
| 17042 Oval Rum Dr Wimauma, FL | 3.0 | 2.0 | 1516 | $2,500 | $1.65 | 18d | 1 | 0.64mi |
| 17334 Holly Well Ave Wimauma, FL | 2.0 | 2.5 | 1737 | $2,500 | $1.44 | 17d | 1 | 0.67mi |
| 16705 Myrtle Sand Dr Wimauma, FL | 3.0 | 2.0 | 1253 | $2,350 | $1.88 | 24d | 1 | 0.99mi |
| 2467 White Ladyfish Rd Wimauma, FL | 3.0 | 2.0 | 1496 | $2,100 | $1.40 | 24d | 1 | 1.16mi |
| 16660 Ancient Mariner Ln Wimauma, FL | 3.0 | 2.5 | 1634 | $2,276 | $1.39 | 24d | 1 | 1.24mi |
| 16676 Ancient Mariner Ln Wimauma, FL | 3.0 | 2.5 | 1634 | $2,201 | $1.35 | 24d | 1 | 1.24mi |
| 16638 Ancient Mariner Ln Wimauma, FL | 3.0 | 2.5 | 1634 | $2,276 | $1.39 | 22d | 1 | 1.24mi |
| 16634 Mooner Plank Cir Wimauma, FL | 4.0 | 2.5 | 2035 | $2,550 | $1.25 | 24d | 1 | 1.26mi |
| 16619 Ancient Mariner Ln Wimauma, FL | 2.0 | 2.5 | 1541 | $2,031 | $1.32 | 24d | 1 | 1.27mi |
| 16665 Ancient Mariner Ln Wimauma, FL | 3.0 | 2.5 | 1634 | $2,101 | $1.29 | 24d | 1 | 1.27mi |
| 16667 Ancient Mariner Ln Wimauma, FL | 3.0 | 2.5 | 1634 | $2,101 | $1.29 | 24d | 1 | 1.27mi |
| 16671 Ancient Mariner Ln Wimauma, FL | 3.0 | 2.5 | 1634 | $2,101 | $1.29 | 24d | 1 | 1.27mi |
| 16616 Ancient Mariner Ln Wimauma, FL | 3.0 | 2.5 | 1634 | $2,276 | $1.39 | 22d | 1 | 1.28mi |
| 16611 Ancient Mariner Ln Wimauma, FL | 3.0 | 2.5 | 1634 | $2,176 | $1.33 | 20d | 1 | 1.28mi |
| 16610 Ancient Mariner Ln Wimauma, FL | 3.0 | 2.5 | 1634 | $2,176 | $1.33 | 24d | 1 | 1.29mi |
| 5017 Capri Harbor Dr Wimauma, FL | 3.0 | 2.5 | 1634 | $2,101 | $1.29 | 20d | 1 | 1.29mi |
| 5085 Capri Harbor Dr Wimauma, FL | 3.0 | 2.5 | 1634 | $2,201 | $1.35 | 24d | 1 | 1.29mi |
| 5089 Capri Harbor Dr Wimauma, FL | 3.0 | 2.5 | 1634 | $2,201 | $1.35 | 24d | 1 | 1.29mi |
| 5091 Capri Harbor Dr Wimauma, FL | 3.0 | 2.5 | 1634 | $2,201 | $1.35 | 24d | 1 | 1.29mi |
| 5095 Capri Harbor Dr Wimauma, FL | 2.0 | 2.5 | 1578 | $1,956 | $1.24 | 22d | 1 | 1.29mi |
| 5018 Capri Harbor Dr Wimauma, FL | 2.0 | 2.5 | 1541 | $1,956 | $1.27 | 24d | 1 | 1.32mi |
| 5044 Capri Harbor Dr Wimauma, FL | 2.0 | 2.5 | 1541 | $1,956 | $1.27 | 24d | 1 | 1.32mi |
| 5010 Capri Harbor Dr Wimauma, FL | 3.0 | 2.5 | 1634 | $2,101 | $1.29 | 24d | 1 | 1.32mi |
| 1013 Ardmore Way Sun City Center, FL | 2.0 | 2.0 | 1857 | $1,795 | $0.97 | 24d | 1 | 1.33mi |
Listing history 2 events
-
2026-06-01days on market $249,490 Active 12 DOM
-
2026-05-31days on market $249,490 Active 11 DOM
ⓘ Source: listings_history table (triggers on properties + properties_extension) + one-shot
backfill from property_details.listing_events for pre-trigger history.
Nearby sold comps map
Loading sold comps map…
Walkable amenities ~0.75 mi
Loading nearby amenities…
Taxation est. · year 1
- Rental income
- $29,074
- − Mortgage interest
- −$13,975
- − Property taxes
- −$3,742
- − Insurance
- −$1,247
- − Repairs & maintenance
- −$2,326
- − Management
- −$2,326
- − Depreciation
- −$7,258
- Taxable loss
- −$1,801
- Est. tax savings @ 24.0%
- +$432
- After-tax cash flow
- $2,710/yr
For passive investors: Depreciation is non-cash, so a rental often shows a tax loss while cash-flowing — sheltering income. Rental losses are passive: they offset passive income freely, and up to $25,000/yr can offset ordinary (W-2) income if you actively participate and your MAGI is under $100k (phasing out to $0 by $150k); unused losses carry forward. On sale, claimed depreciation is recaptured at up to 25%, and gains may owe capital-gains tax (a 1031 exchange can defer both). Figures are a year-1 estimate at your 24.0% rate — not tax advice; consult a CPA.
Condition & rehab AI · 1 photo
This charming two-story townhome is in excellent condition with no visible repairs needed. It offers a good return on investment with updates that can significantly increase its resale and rental value.
Value-add opportunities
- Both Painting exterior and interior — Enhances curb appeal and interior aesthetics
- Both Landscaping improvements — Enhances curb appeal and adds value
- Both New flooring in bathrooms and kitchen — Improves functionality and aesthetics
- Both New window treatments — Enhances curb appeal and interior aesthetics
Renovation cost estimate screening
Value-add ROI direction
- Both Painting exterior and interior — Enhances curb appeal and interior aesthetics ↑
- Both Landscaping improvements — Enhances curb appeal and adds value ↑
- Both New flooring in bathrooms and kitchen — Improves functionality and aesthetics ↑
- Both New window treatments — Enhances curb appeal and interior aesthetics ↑
ⓘ Cost ranges are severity-bucket heuristics (US national rule-of-thumb). Get contractor quotes + a written scope before underwriting a rehab budget.
Schools (NCES district)
- District
- Hillsborough
- NCES district ID
- 1200870
- Math proficiency
- 47% ▼ -8.00%
- Reading proficiency
- 50% ▼ -4.00%
- Median HH income
- $50,622
- Composite
- 41.6/100
- National rank
- #3435
- State rank
- #41 of 73 in FL
Livability — Wimauma
- Score
- 64/100
- State rank
- #699
- US rank
- #14659
Category grades
Schools grade is shown separately in the Schools card above.
Census & demographics
- Census place
- Wimauma, FL
- County
- Hillsborough County · 1,540,968 people
- City population
- 32,820
- Metro
- Tampa-St. Petersburg-Clearwater, FL
- Population (ZIP)
- 32,820
- Household income
- $97,520
- Rent vs Own
- Severe rent burden
- 149.0
Population outlook (Hillsborough County) Hauer SSP2
- Today (2025)
- 1,607,022 people
- By 2030
- 1,733,968 · +7.9%
- By 2040
- 1,979,565 · +23.2%
- By 2050
- 2,203,427 · +37.1%
- By 2075
- 2,667,893 · +66.0%
- By 2100
- 2,891,558 · +79.9%
Race, ethnicity, and origin ACS 2023
- Neighborhood character
- Diverse neighborhood (Simpson 0.67)
- Race & ethnicity
- White 40% Hispanic / Latino 39% Black 14% Two or more races 11% Asian 2%
- Hispanic origin (detail)
- Mexican 26% Puerto Rican 3% Cuban 1%
- Common ancestry
- Romanian 2% Scotch-Irish 2% Lithuanian 1%
- Foreign-born
- 23% · Canada, Jamaica, Guatemala
- Languages at home
- 62% English-only · Spanish 35% Other Indo-European 1% Arabic 1%
Political lean MEDSL · Hillsborough
- 2024 margin
- Toss-up / Even · D 47.8% · R 50.9% · Other 1.3%
- 2008→2024 swing
- -10.2pp toward R · 2008: 7.1pp · 2024: -3.1pp
- All cycles
- 2024: R+3.1 2020: D+6.9 2016: D+6.8 2012: D+6.7 2008: D+7.1
Not yet ingested
- Civics
- —
Market trends
- HPI YoY
- ▼ -2.35%
- Current HPI
- 271.8552
- Rent YoY
- ▼ -2.50%
- Metro
- Tampa-St. Petersburg-Clearwater, FL
- State GDP YoY
- ▲ 3.28%
- F500 in state
- 36
Industry mix (Fortune 500 HQ in FL)
| Industry | F500 HQs | Revenue |
|---|---|---|
| Industrial Technology | 2 | $29B |
|
||
| Insurance | 2 | $17B |
|
||
| Retail | 1 | $60B |
|
||
| Technology Distribution | 1 | $58B |
|
||
| Homebuilding | 1 | $35B |
|
||
| Technology Manufacturing | 1 | $35B |
|
||
Cash-flow waterfall
monthlySold comps — $/sqft
last 12 mo · ≤1 miLoading sold comps…