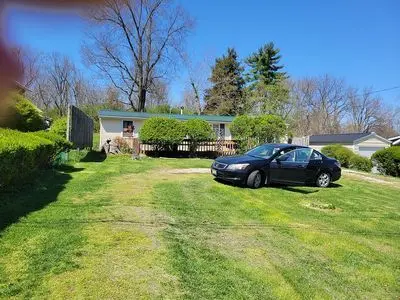
8233 Harrisburg Rd · Harrisburg, OH
Flood risk 1/10 · Minimal
- FEMA flood zone
- X (unshaded)
- Chance of flooding over 30 yrs
- 0.0%
- Est. flood insurance / yr
- $507 – $1,088
Fire risk 1/10 · Minimal
- Est. fire insurance / yr
- $713 – $1,323
Heat risk 3/10 · Minor
- Hot days now (above 100°F)
- 7 days/yr
- Hot days in 30 yrs
- 18 days/yr
Wind risk 2/10 · Minimal
- Chance of severe wind over 30 yrs
- 1.0%
Air-quality risk 2/10 · Minimal
- Unhealthy air days now
- 1 days/yr
- Unhealthy air days in 30 yrs
- 3 days/yr
Risk factors via First Street. Map © Google.
Why this score? — see what drove the B+ grade
The composite is a weighted blend of 9 inputs, each scored 0–100. Each bar is that input's sub-score; the figure is the points it added to the 100-point composite (weight × sub-score).
- Cash flow +30.0/30.0
- ARV discount +15.0/15.0
- DSCR +10.0/10.0
- 1% rule +8.9/10.0
- Schools +3.8/10.0
- Livability +3.1/5.0
- Rent growth +2.5/5.0
- Condition / age +2.5/5.0
- Appreciation +0.0/10.0
$124,000
🖨 Deal sheet 📄 Offer letter ✓ Due diligence
Listing remarks MLS
LOVELY STARTER HOME SHOWS GREAT. MODULAR ONE PERMANENT FOUNDATION/ WITHCRAWL, LOT 62 FRONT 250 SIDES 46 BACK. NEWER SHED. RANGE, REF. , & DISHWASHERSTAY BATHROOM UPDATED. CABLE READY, CHAIN FENCE IN REAR.
Key facts
- Well pump
- Appliances stay
- Furnace
Tags
Neighborhood map
What this means for you Summary
Snapshot
- This is a 2-bed/1.0-bath single-family listed at $124k.
Deal economics
- At list price, monthly cash flow is $594 ($7k/yr) — positive.
- The deal already cash-flows at list — no discount required.
- Meets the 1% rule at list price ($2k rent vs $124k).
Location & tenants
- Location reads 61/100 on livability (#942 in OH) — a middle-class / working-renter tenant base. Strengths: cost of living A+, housing A+, employment A-; Watch: schools F, amenities F, commute F.
- South-Western City (suburban): math 40% / reading 48% proficiency, ranked #500 of 656 in OH (top 76%) — families likely to look elsewhere, expect single-tenant / working-renter base with shorter leases.
- Market conditions: 24 active listings in the ZIP; 312 units permitted in Pickaway County in 2024 (0 in 5+ unit buildings).
Forward outlook
- Local home prices are declining (-3.0%/yr); year-one equity from $857 of loan paydown is wiped out by about $4k of value loss. Plan a longer hold.
- Pickaway County population projected at +3% by 2050 — modest demand growth; plan on rents tracking national, not racing it.
- At projected returns (-3.0% appreciation + 3.0% rent growth), your $35k cash investment doubles in ~6 years — after that, you're playing with house money.
Negotiation context
- Only 14 days on market — expect competitive offers; lowballing is unlikely to land.
- 2 sale attempts since 30y ago; this cycle's ask is 55% above the opening price — seller raised mid-cycle; expect resistance to lowballs.
- Current owner paid $58k; list at $124k implies a 114% gain — meaningful room to come down on a strong offer.
Questions for the listing agent
- Is there a deadline driving the sale (1031 exchange, divorce, estate, relocation)? That informs how much negotiation room exists.
- Schools are F-rated, which usually means shorter tenancies and higher turnover. Who's the typical renter profile here, and what's been the actual vacancy rate?
- What's the average days-on-market for RENTAL listings here right now (not sales)? A rising rental-DOM trend means longer vacancies and softer asking-rent achievability than the comps imply.
- What's the recent tenant-quality profile in this submarket — average credit score on applications, eviction rate, late-payment / NSF rate, and stable-employment percentage? A property-management company in the area should have these aggregated.
- How much new for-sale + rental construction is in the pipeline within 1–3 miles? Heavy new supply typically softens prices + rents 12–24 months out; constrained supply supports both.
Investment metrics
- 1% rule
- 1.39% ✓
- Cap rate
- 12.05%
- Cash-on-cash
- 20.54%
- DSCR
- 1.91
- GRM
- 6.0
CMA / ARV
- ARV (median comp)
- $233,545
- List price
- $124,000
- Delta
- -46.91%
- Verdict
- UNDERPRICED
- Comps
- 8 within 1.0 mi
Show comp detail 3 sales within ~0.75 mi
| Address | Dist | Beds/Ba | Sqft | Sold | Price | $/sf | Match |
|---|---|---|---|---|---|---|---|
| 1096 Hillside Ave | 0.27mi | 3/1.0 (+1) | 988 (+7%) | 15mo | $222,000 | $225 | 58 |
| 1063 Columbus St | 0.24mi | 3/1.0 (+1) | 1,019 (+11%) | 17mo | $177,000 | $174 | 52 |
| 1060 Sycamore St | 0.39mi | 3/2.0 (+1) | 966 (+5%) | 21mo | $232,000 | $240 | 47 |
Match score weights: distance 35% · size 25% · config 20% · recency 20%. Top-matched comps best support the ARV.
Projected returns pro-forma
-3.0% appreciation · 3.0% rent growth · sell at horizon
- IRR
- 12.8%
- Equity multiple
- 1.51×
- Total profit
- $17,737
- Equity at exit
- $18,489
- IRR
- 21.7%
- Equity multiple
- 2.85×
- Total profit
- $64,079
- Equity at exit
- $10,721
Cash invested: $34,720 (down + closing). Projections, not guarantees.
Landlord ↔ Tenant lean methodology
- Overall (STATE)
- 73 Landlord-Friendly
- State Ohio
- 73 Landlord-Friendly · R+6
- County
- — inherits STATE
- City
- — inherits STATE
ZIP-level market 43146
- Home prices YoY
- -26.8%
- Active inventory
- 24
- Price-to-rent
- 6.0×
Monthly cashflow live
- Estimated rent
- $1,726 medium interval (Pro) →
- Mortgage (P&I)
- −$650
- Tax from tax record
- −$67 /mo · $807/yr
- Insurance
- −$52
- HOA
- −$0
- Vacancy / Maint / Mgmt
- −$362
- Net cashflow
- $594
Break-even live
UW: 25.0% down · 7.5% · 30yr · 1.5% tax · 5.0% vac · 8.0% maint · 8.0% mgmt
Financing live
Cash to close
- Down payment
- $31,000
- Closing costs
- $3,720
- Reserves months
- —
- Total cash needed
- —
Loan-product check · same deal, 3 products live
Conventional
25% down · 7.5% · 30yr
- Down + closing
- —
- Monthly P&I
- —
- Monthly cashflow
- —
- DSCR
- —
- Eligible?
- —
Personal DTI + credit; lowest rate.
DSCR
20% down · 8.5% · 30yr
- Down + closing
- —
- Monthly P&I
- —
- Monthly cashflow
- —
- DSCR
- —
- Eligible?
- —
No personal income docs; deal must DSCR.
Hard money
10% down · 12.0% · 12mo
- Down + closing
- —
- Monthly P&I
- —
- Monthly cashflow
- —
- DSCR
- —
- Eligible?
- —
Short-term bridge; refi at stabilization.
Listing history 8 events
-
2026-05-12$124,000 Active 321-char remark
-
2009-10-06historical
-
2009-07-07$80,000
-
1996-10-23soldstatus $58,000
-
1996-10-10soldstatus $58,000
Show marketing remark (209 chars)
LOVELY STARTER HOME SHOWS GREAT. MODULAR ONE PERMANENT FOUNDATION/ WITHCRAWL, LOT 62 FRONT 250 SIDES 46 BACK. NEWER SHED. RANGE, REF. , & DISHWASHERSTAY BATHROOM UPDATED. CABLE READY, CHAIN FENCE IN REAR.
-
1996-09-02historical
Show marketing remark (209 chars)
LOVELY STARTER HOME SHOWS GREAT. MODULAR ONE PERMANENT FOUNDATION/ WITHCRAWL, LOT 62 FRONT 250 SIDES 46 BACK. NEWER SHED. RANGE, REF. , & DISHWASHERSTAY BATHROOM UPDATED. CABLE READY, CHAIN FENCE IN REAR.
-
1996-08-25$58,900
Show marketing remark (209 chars)
LOVELY STARTER HOME SHOWS GREAT. MODULAR ONE PERMANENT FOUNDATION/ WITHCRAWL, LOT 62 FRONT 250 SIDES 46 BACK. NEWER SHED. RANGE, REF. , & DISHWASHERSTAY BATHROOM UPDATED. CABLE READY, CHAIN FENCE IN REAR.
-
1988-09-14soldstatus $38,400
ⓘ Source: listings_history table (triggers on properties + properties_extension) + one-shot
backfill from property_details.listing_events for pre-trigger history.
Tax reassessment forecast OH · Partial reset (capped growth)
- Current annual tax
- $807 · $67/mo
- Projected year-2 tax
- $1,371 · $114/mo
- Expected delta
- +$564/yr (+$47/mo · 69.9%)
ⓘ Screening estimate from a state-policy table — verify with the county assessor before closing.
Climate risk First Street
- Flood 1/10 Low FEMA zone X (unshaded) · 0% chance over 30 yrs
- Wildfire 1/10 Low
- Heat 3/10 Moderate 7 d/yr ≥100°F today · 18 d/yr by 30 yrs out
- Wind 2/10 Low 100% chance of damaging wind over 30 yrs
- Air quality 2/10 Low 1 unhealthy d/yr today · 3 by 30 yrs out
Nearby sold comps map
Loading sold comps map…
Walkable amenities ~0.75 mi
Loading nearby amenities…
Taxation est. · year 1
- Rental income
- $20,713
- − Mortgage interest
- −$6,946
- − Property taxes
- −$807
- − Insurance
- −$620
- − Repairs & maintenance
- −$1,657
- − Management
- −$1,657
- − Depreciation
- −$3,607
- Taxable income
- $5,419
- Est. tax owed @ 24.0%
- −$1,300
- After-tax cash flow
- $5,832/yr
For passive investors: Depreciation is non-cash, so a rental often shows a tax loss while cash-flowing — sheltering income. Rental losses are passive: they offset passive income freely, and up to $25,000/yr can offset ordinary (W-2) income if you actively participate and your MAGI is under $100k (phasing out to $0 by $150k); unused losses carry forward. On sale, claimed depreciation is recaptured at up to 25%, and gains may owe capital-gains tax (a 1031 exchange can defer both). Figures are a year-1 estimate at your 24.0% rate — not tax advice; consult a CPA.
Schools (NCES district)
- District
- South-Western City
- NCES district ID
- 3904480
- Math proficiency
- 40% ▼ -18.00%
- Reading proficiency
- 48% ▼ -10.00%
- Median HH income
- $51,689
- Composite
- 37.95/100
- National rank
- #4305
- State rank
- #500 of 656 in OH
Livability — Harrisburg
- Score
- 61/100
- State rank
- #942
- US rank
- #18192
Category grades
Schools grade is shown separately in the Schools card above.
Census & demographics
- County
- Pickaway · 57,589 people
- City population
- 360
- Metro
- Columbus, OH
- Population (ZIP)
- 13,325
- Household income
- $73,904
- Rent vs Own
Population outlook (Pickaway County) Hauer SSP2
- Today (2025)
- 59,488 people
- By 2030
- 60,400 · +1.5%
- By 2040
- 61,498 · +3.4%
- By 2050
- 61,478 · +3.3%
- By 2075
- 59,696 · +0.3%
- By 2100
- 51,458 · -13.5%
Race, ethnicity, and origin ACS 2023
- Neighborhood character
- Predominantly White (80%)
- Race & ethnicity
- White 80% Black 11% Two or more races 6% Hispanic / Latino 3%
- Common ancestry
- Iranian 2% Slovak 1% Romanian 1%
- Foreign-born
- 2% · Canada
- Languages at home
- 97% English-only · Spanish 1% Other Indo-European 1%
Political lean MEDSL · Pickaway
- 2024 margin
- Solid R (+48.5) · D 25.3% · R 73.8%
- 2008→2024 swing
- -26.8pp toward R · 2008: -21.7pp · 2024: -48.5pp
- All cycles
- 2024: R+48.5 2020: R+47.0 2016: R+42.6 2012: R+18.7 2008: R+21.7
Not yet ingested
- Civics
- —
Market trends
- HPI YoY
- ▼ -99.05%
- Current HPI
- 271.1768
- Rent YoY
- —
- Metro
- —
- State GDP YoY
- ▲ 1.98%
- F500 in state
- 48
Industry mix (Fortune 500 HQ in OH)
| Industry | F500 HQs | Revenue |
|---|---|---|
| Insurance | 3 | $145B |
|
||
| Industrial Machinery | 3 | $49B |
|
||
| Financial Services | 3 | $24B |
|
||
| Consumer Goods | 2 | $93B |
|
||
| Aerospace / Defense | 2 | $47B |
|
||
| Utilities | 2 | $33B |
|
||
Price history
+108.3% since first listed7 events — show timeline
- 2009-10-06 Listing Removed — CBRMLS
- 2009-07-07 Listed $80,000 CBRMLS
- 1996-10-23 Sold (Public Records) $58,000 Public Records
- 1996-10-10 Sold (MLS) $58,000 CBRMLS
- 1996-09-02 Listing Removed — CBRMLS
- 1996-08-25 Listed $58,900 CBRMLS
- 1988-09-14 Sold (Public Records) $38,400 Public Records
Property tax history
-2.0%/yrLatest (2025): $807 · -33.0% YoY. Source: county tax records.
Cash-flow waterfall
monthlySold comps — $/sqft
last 12 mo · ≤1 miLoading sold comps…