1601 Idle Dr · Largo, FL
Flood risk 1/10 · Minimal
- FEMA flood zone
- X (unshaded)
- Chance of flooding over 30 yrs
- 0.0%
- Est. flood insurance / yr
- $507 – $1,088
Fire risk 1/10 · Minimal
- Est. fire insurance / yr
- $947 – $1,759
Heat risk 10/10 · Severe
- Hot days now (above 108°F)
- 7 days/yr
- Hot days in 30 yrs
- 26 days/yr
Wind risk 10/10 · Severe
- Chance of severe wind over 30 yrs
- 99.0%
Air-quality risk 3/10 · Minor
- Unhealthy air days now
- 2 days/yr
- Unhealthy air days in 30 yrs
- 3 days/yr
Risk factors via First Street. Map © Google.
Why this score? — see what drove the D+ grade
The composite is a weighted blend of 9 inputs, each scored 0–100. Each bar is that input's sub-score; the figure is the points it added to the 100-point composite (weight × sub-score).
- ARV discount +15.0/15.0
- Cash flow +13.0/30.0
- Schools +4.3/10.0
- Livability +4.1/5.0
- DSCR +3.9/10.0
- 1% rule +2.6/10.0
- Condition / age +2.5/5.0
- Rent growth +1.9/5.0
- Appreciation +0.0/10.0
$460,000
🖨 Deal sheet 📄 Offer letter ✓ Due diligence
Listing remarks MLS
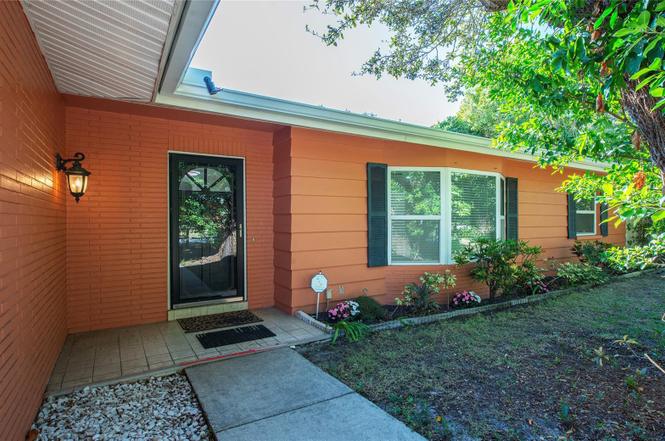
MAGNIFICENT 3 BEDROOM HOME SITUATED ON A LARGE, FENCED LOT! Beautiful updated home boasting large living areas, spacious bedrooms, wood floors, fireplace. .. IMMACULATE! Roof just 8 years new; Air system new in 2009; granite kitchen with updated cabinets; PVC fencing done in 2006; security system. Wonderful split bedroom plan with a large master having 2 small walk in closets. Most windows have been replaced. Huge back yard with stone paved patio and plenty of room for a pool. Make sure to check out the pictures. This is an amazing home in an equally amazing neighborhood.
Key facts
- Walk-in shower
- Large florida room
- En-suite bathroom
Tags
Property features AI
Finance
- Other: Lot size approximately 0.23 acres (dimensions approx. 97 x 104)
- Financial info: No lease restrictions; Unfurnished
- HOA & community: No association
Exterior
- Parking: Attached 2-car garage
- Utilities: Public water; Public sewer; Public utilities
- Home design: Single-family residence; One story; Home faces north; Homestead exempt
- Construction: Block construction; Shingle roof; Slab foundation; Built as single-story (one level)
- Exterior features: Rear porch; Rain gutters; Fruit trees on the lot; Paved road access
Interior
- Kitchen: Dishwasher; Range; Range hood; Refrigerator
- Bedrooms: 3 bedrooms
- Flooring: Laminate; Tile; Wood; Tile
- Bathrooms: 2 full bathrooms
- Heating & cooling: Central heating; Central air conditioning
- Interior features: Ceiling fans; Crown molding; Split bedroom floor plan; Wood-burning fireplace
- Laundry & utility: Washer; Dryer; Laundry located in garage
Neighborhood map
What this means for you Summary
Snapshot
- This is a 3-bed/2.0-bath single-family listed at $460k.
Deal economics
- At list price, monthly cash flow is $-28 ($-333/yr) — negative.
- To cash-flow at today's rent, offer at most $455k (1.1% below list).
- To meet the 1% rule (rent ≥ 1% of price), the offer needs to be $352k (23.5% below list).
- Recommended offer: $352k (23.5% below list) — sets the bar for 1% rule.
- Cap rate 6.2% vs local median 4.2% in Largo — top-decile yield for the area; either an underpriced asset or a hidden risk that comps aren't pricing in. Stress-test before assuming the spread holds.
Location & tenants
- Location reads 82/100 on livability (#82 in FL, #1,240 nationally) — a professional / high-income tenant draw. Strengths: commute A+, cost of living A+, housing A+; Watch: employment D+, amenities F.
- Pinellas (suburban): math 51% / reading 51% proficiency, ranked #31 of 73 in FL (top 42%) — acceptable for families but not a draw, mixed tenant base, ~2y average lease.
- Market conditions: Rents soft (-2.2%/yr); 355 active listings in the ZIP; 23 comparable units currently listed for rent nearby; rentals leasing fast (median 4d on market — plan ~1-2 weeks tenant-placement turnaround); 2,676 units permitted in Pinellas County in 2024 (1,422 in 5+ unit buildings).
- At $3,518/mo this rent would consume 68% of the median local household income ($62k/yr) (locally 1868% of renters already pay >50% of income on rent) — very limited rent-growth headroom before tenants either downsize or default.
Forward outlook
- Local home prices are declining (-3.0%/yr); year-one equity from $3k of loan paydown is wiped out by about $14k of value loss. Plan a longer hold.
- Pinellas County population projected at +14% by 2050 — modest demand growth; plan on rents tracking national, not racing it.
Negotiation context
- It's been on market 137 days — a 12% lower offer ($405k) is reasonable based on typical stale-listing flexibility.
- 2 sale attempts since 15y ago; this cycle's ask has dropped $79k (15%) from the opening price — seller is motivated, your offer sets the floor, not the list.
- Current owner paid $152k; list at $460k implies a 203% gain — meaningful room to come down on a strong offer.
Risks & watch-outs
- Climate carrying-cost: severe wind risk, 99% chance of damaging wind over 30y; extreme-heat days projected 7→26/yr by 2055 (HVAC capex compounding) — expect insurance premiums to compound above CPI over the hold.
Questions for the listing agent
- What do current leases actually rent for vs. the listed asking? Can we see a recent rent roll and the last 12 months of T-12 income?
- It's been on market 137 days. Have you received any prior offers? Is the seller open to a 24% concession, seller financing, or rate buy-down credit?
- Built in 1964 — when were the roof, HVAC, electrical panel, plumbing, and water heater last replaced?
- Why hasn't it sold? Are there any deal-killer items the seller is aware of (foundation, flood, title, zoning, code violations)?
- Is there a deadline driving the sale (1031 exchange, divorce, estate, relocation)? That informs how much negotiation room exists.
- The area grade is low — what's the realistic commute time and amenity access for the typical tenant pool here? Any planned neighborhood developments (good or bad) we should know about?
- What's the average days-on-market for RENTAL listings here right now (not sales)? A rising rental-DOM trend means longer vacancies and softer asking-rent achievability than the comps imply.
- What's the recent tenant-quality profile in this submarket — average credit score on applications, eviction rate, late-payment / NSF rate, and stable-employment percentage? A property-management company in the area should have these aggregated.
- How much new for-sale + rental construction is in the pipeline within 1–3 miles? Heavy new supply typically softens prices + rents 12–24 months out; constrained supply supports both.
Investment metrics
- 1% rule
- 0.76% ✗
- Cap rate
- 6.22%
- Cash-on-cash
- -0.26%
- DSCR
- 0.99
- GRM
- 10.9
CMA / ARV
- ARV (on-the-fly)
- $561,152
- Comps found
- 11
Show comp detail 11 sales within ~0.75 mi
| Address | Dist | Beds/Ba | Sqft | Sold | Price | $/sf | Match |
|---|---|---|---|---|---|---|---|
| 1897 Harmony Dr | 0.22mi | 3/2.0 | 1,963 (-4%) | 17mo | $557,000 | $284 | 68 |
| 800 Embassy Rd | 0.35mi | 3/2.0 | 1,862 (-9%) | 10mo | $567,000 | $305 | 60 |
| 418 Imperial Dr | 0.64mi | 4/3.0 (+1) | 2,028 (-1%) | 6mo | $555,000 | $274 | 54 |
| 1525 Alexander Way | 0.50mi | 3/2.0 | 1,870 (-9%) | 10mo | $595,000 | $318 | 54 |
| 1739 Woodridge Dr | 0.43mi | 3/2.0 | 1,835 (-10%) | 11mo | $399,000 | $217 | 53 |
| 1049 Fay Ave | 0.58mi | 3/2.0 | 1,854 (-10%) | 9mo | $400,000 | $216 | 50 |
| 896 Imperial Dr | 0.39mi | 4/3.0 (+1) | 2,255 (+10%) | 9mo | $492,000 | $218 | 48 |
| 1270 Alexander Way | 0.52mi | 3/2.0 | 1,871 (-9%) | 16mo | $610,000 | $326 | 48 |
| 461 Deville Dr E | 0.67mi | 3/2.0 | 1,804 (-12%) | 4mo | $470,000 | $261 | 45 |
| 1354 Chesterfield Dr | 0.69mi | 4/2.0 (+1) | 1,846 (-10%) | 22mo | $487,000 | $264 | 28 |
| 412 Deville Dr E | 0.68mi | 4/3.0 (+1) | 1,798 (-12%) | 18mo | $625,000 | $348 | 24 |
Match score weights: distance 35% · size 25% · config 20% · recency 20%. Top-matched comps best support the ARV.
Projected returns pro-forma
-3.0% appreciation · 0.0% rent growth · sell at horizon
- IRR
- -19.8%
- Equity multiple
- 0.33×
- Total profit
- $-86,791
- Equity at exit
- $68,587
- IRR
- -19.7%
- Equity multiple
- 0.08×
- Total profit
- $-118,409
- Equity at exit
- $39,772
Cash invested: $128,800 (down + closing). Projections, not guarantees.
Landlord ↔ Tenant lean methodology
- Overall (STATE)
- 87 Strongly Landlord-Friendly
- State Florida
- 87 Strongly Landlord-Friendly · R+3
- County
- — inherits STATE
- City
- — inherits STATE
ZIP-level market 33756
- Rents YoY
- -2.2%
- Active inventory
- 355
- Price-to-rent
- 10.9×
Monthly cashflow live
- Estimated rent
- $3,518 high interval (Pro) →
- Mortgage (P&I)
- −$2,412
- Tax from tax record
- −$203 /mo · $2,438/yr
- Insurance
- −$192
- HOA
- −$0
- Vacancy / Maint / Mgmt
- −$739
- Net cashflow
- $-28
Break-even live
UW: 25.0% down · 7.5% · 30yr · 1.5% tax · 5.0% vac · 8.0% maint · 8.0% mgmt
Financing live
Cash to close
- Down payment
- $115,000
- Closing costs
- $13,800
- Reserves months
- —
- Total cash needed
- —
Loan-product check · same deal, 3 products live
Conventional
25% down · 7.5% · 30yr
- Down + closing
- —
- Monthly P&I
- —
- Monthly cashflow
- —
- DSCR
- —
- Eligible?
- —
Personal DTI + credit; lowest rate.
DSCR
20% down · 8.5% · 30yr
- Down + closing
- —
- Monthly P&I
- —
- Monthly cashflow
- —
- DSCR
- —
- Eligible?
- —
No personal income docs; deal must DSCR.
Hard money
10% down · 12.0% · 12mo
- Down + closing
- —
- Monthly P&I
- —
- Monthly cashflow
- —
- DSCR
- —
- Eligible?
- —
Short-term bridge; refi at stabilization.
Rent comps 23 comps
| Address | Beds | Baths | Sqft | Rent | $/sqft | DOM | Units | Dist |
|---|---|---|---|---|---|---|---|---|
| 1596 Idle Dr NE Unit 1379462P Clearwater, FL | 4.0 | 2.0 | 1776 | $5,225 | $2.94 | 3d | 1 | 0.07mi |
| 802 Embassy Rd Largo, FL | 4.0 | 2.0 | 2225 | $3,499 | $1.57 | 4d | 1 | 0.31mi |
| 1679 Leisure Dr Clearwater, FL | 3.0 | 2.0 | 1497 | $3,200 | $2.14 | 2d | 1 | 0.32mi |
| 897 Imperial Dr Unit 1244950P Largo, FL | 4.0 | 3.0 | 1646 | $6,372 | $3.87 | 3d | 1 | 0.39mi |
| 709 Highland Ave N Largo, FL | 3.0 | 3.0 | 1884 | $2,995 | $1.59 | 4d | 1 | 0.47mi |
| 1441 Alexander Way Clearwater, FL | 4.0 | 3.0 | 2885 | $1,400 | $0.49 | 4d | 1 | 0.53mi |
| 1773 Eaton Dr Unit 1032113P Clearwater, FL | 3.0 | 2.0 | 1991 | $6,090 | $3.06 | 14d | 1 | 0.60mi |
| 221 Lake Ave NE Largo, FL | 1.0–2.0 | 1.0–2.0 | 1095 | $2,160 | $1.97 | 3d | 11 | 0.60mi |
| 601 Rosery Rd NE Largo, FL | 1.0–3.0 | 1.0–2.5 | 1192 | $2,260 | $1.90 | 1d | 38 | 0.66mi |
| 1812 Lady Mary Dr Clearwater, FL | 3.0 | 2.0 | 1531 | $2,800 | $1.83 | 3d | 1 | 0.70mi |
| 1354 Chesterfield Dr Unit 1039504P Clearwater, FL | 4.0 | 2.0 | 1840 | $6,710 | $3.65 | 2d | 1 | 0.72mi |
| 1899 Oak Park Dr S Unit 1524599P Clearwater, FL | 4.0 | 3.0 | 1948 | $11,612 | $5.96 | 21d | 1 | 0.85mi |
| 1526 Caldera Ct Clearwater, FL | 3.0 | 2.5 | 1816 | $2,900 | $1.60 | 14d | 1 | 0.96mi |
| 225 Country Club Dr #1404 Largo, FL | 2.0 | 2.0 | 1440 | $1,700 | $1.18 | 4d | 1 | 0.96mi |
| 1588 Eunice Ln Clearwater, FL | 4.0 | 2.0 | 1780 | $2,731 | $1.53 | 7d | 1 | 0.97mi |
| 1500 Laurel Cir Clearwater, FL | 3.0 | 2.0 | 1530 | $2,650 | $1.73 | 4d | 1 | 0.98mi |
| 1310 Bayview Dr Clearwater, FL | 3.0 | 2.0 | 1500 | $3,300 | $2.20 | 24d | 1 | 1.00mi |
| 1342 Belleair Rd Clearwater, FL | 4.0 | 2.0 | 1695 | $2,845 | $1.68 | 20d | 1 | 1.03mi |
| 9122 Jakes Path Largo, FL | 3.0 | 2.5 | 1461 | $2,600 | $1.78 | 24d | 1 | 1.17mi |
| 1619 Pinewood Dr Clearwater, FL | 2.0 | 2.0 | 1507 | $2,425 | $1.61 | 24d | 1 | 1.33mi |
| 1429 S Evergreen Ave Clearwater, FL | 4.0 | 2.0 | 1782 | $2,781 | $1.56 | 4d | 1 | 1.34mi |
| 1200 Country Club Dr #6204 Largo, FL | 3.0 | 2.0 | 1575 | $2,600 | $1.65 | 4d | 1 | 1.40mi |
| 960 Starkey Rd #8206 Largo, FL | 3.0 | 2.0 | 1836 | $2,700 | $1.47 | 24d | 1 | 1.44mi |
Listing history 12 events
-
2026-05-06status Pending
-
2026-04-29price $460,000
-
2026-04-16price $470,000
-
2026-04-04price $480,000
-
2026-03-25price $490,000
-
2026-01-29price $499,900
-
2026-01-20price $530,000
-
2025-12-19$539,000 Active
-
2011-05-13soldstatus $152,000
-
2011-05-09soldstatus $152,000 579-char remark
Show marketing remark (579 chars)
MAGNIFICENT 3 BEDROOM HOME SITUATED ON A LARGE, FENCED LOT! Beautiful updated home boasting large living areas, spacious bedrooms, wood floors, fireplace. .. IMMACULATE! Roof just 8 years new; Air system new in 2009; granite kitchen with updated cabinets; PVC fencing done in 2006; security system. Wonderful split bedroom plan with a large master having 2 small walk in closets. Most windows have been replaced. Huge back yard with stone paved patio and plenty of room for a pool. Make sure to check out the pictures. This is an amazing home in an equally amazing neighborhood.
-
2011-03-30$159,900 579-char remark
Show marketing remark (579 chars)
MAGNIFICENT 3 BEDROOM HOME SITUATED ON A LARGE, FENCED LOT! Beautiful updated home boasting large living areas, spacious bedrooms, wood floors, fireplace. .. IMMACULATE! Roof just 8 years new; Air system new in 2009; granite kitchen with updated cabinets; PVC fencing done in 2006; security system. Wonderful split bedroom plan with a large master having 2 small walk in closets. Most windows have been replaced. Huge back yard with stone paved patio and plenty of room for a pool. Make sure to check out the pictures. This is an amazing home in an equally amazing neighborhood.
-
1999-09-02soldstatus $129,500
ⓘ Source: listings_history table (triggers on properties + properties_extension) + one-shot
backfill from property_details.listing_events for pre-trigger history.
Tax reassessment forecast FL · Resets to sale price
- Current annual tax
- $2,438 · $203/mo
- Projected year-2 tax
- $3,818 · $318/mo
- Expected delta
- +$1,380/yr (+$115/mo · 56.6%)
ⓘ Screening estimate from a state-policy table — verify with the county assessor before closing.
Climate risk First Street
- Flood 1/10 Low FEMA zone X (unshaded) · 0% chance over 30 yrs
- Wildfire 1/10 Low
- Heat 10/10 Extreme 7 d/yr ≥108°F today · 26 d/yr by 30 yrs out
- Wind 10/10 Extreme 99% chance of damaging wind over 30 yrs
- Air quality 3/10 Moderate 2 unhealthy d/yr today · 3 by 30 yrs out
Nearby sold comps map
Loading sold comps map…
Walkable amenities ~0.75 mi
Loading nearby amenities…
Taxation est. · year 1
- Rental income
- $42,219
- − Mortgage interest
- −$25,767
- − Property taxes
- −$2,438
- − Insurance
- −$2,300
- − Repairs & maintenance
- −$3,378
- − Management
- −$3,378
- − Depreciation
- −$13,382
- Taxable loss
- −$8,423
- Est. tax savings @ 24.0%
- +$2,022
- After-tax cash flow
- $1,689/yr
For passive investors: Depreciation is non-cash, so a rental often shows a tax loss while cash-flowing — sheltering income. Rental losses are passive: they offset passive income freely, and up to $25,000/yr can offset ordinary (W-2) income if you actively participate and your MAGI is under $100k (phasing out to $0 by $150k); unused losses carry forward. On sale, claimed depreciation is recaptured at up to 25%, and gains may owe capital-gains tax (a 1031 exchange can defer both). Figures are a year-1 estimate at your 24.0% rate — not tax advice; consult a CPA.
Schools (NCES district)
- District
- Pinellas
- NCES district ID
- 1201560
- Math proficiency
- 51% ▼ -5.00%
- Reading proficiency
- 51% ▼ -3.00%
- Median HH income
- $46,270
- Composite
- 43.27/100
- National rank
- #3046
- State rank
- #31 of 73 in FL
Livability — Largo
- Score
- 82/100
- State rank
- #82
- US rank
- #1240
Category grades
Schools grade is shown separately in the Schools card above.
Census & demographics
- Census place
- Largo, FL
- County
- Pinellas County · 939,478 people
- City population
- 106,311
- Metro
- Tampa-St. Petersburg-Clearwater, FL
- Population (ZIP)
- 32,201
- Household income
- $61,872
- Rent vs Own
- Severe rent burden
- 1868.0
Population outlook (Pinellas County) Hauer SSP2
- Today (2025)
- 1,027,532 people
- By 2030
- 1,063,586 · +3.5%
- By 2040
- 1,125,020 · +9.5%
- By 2050
- 1,168,637 · +13.7%
- By 2075
- 1,265,188 · +23.1%
- By 2100
- 1,260,357 · +22.7%
Race, ethnicity, and origin ACS 2023
- Neighborhood character
- Majority White (64%)
- Race & ethnicity
- White 64% Hispanic / Latino 18% Black 11% Two or more races 9% Asian 3%
- Hispanic origin (detail)
- Mexican 8% Puerto Rican 5%
- Common ancestry
- Romanian 3% Lithuanian 2% Slovak 2%
- Foreign-born
- 16% · Canada
- Languages at home
- 79% English-only · Spanish 14% Other Indo-European 2% Russian/Polish/Slavic 2%
Political lean MEDSL · Pinellas
- 2024 margin
- Lean R (+5.2) · D 46.9% · R 52.1%
- 2008→2024 swing
- -13.5pp toward R · 2008: 8.3pp · 2024: -5.2pp
- All cycles
- 2024: R+5.2 2020: D+0.2 2016: R+1.1 2012: D+5.6 2008: D+8.3
Not yet ingested
- Civics
- —
Market trends
- HPI YoY
- ▼ -438.74%
- Current HPI
- 354.6792
- Rent YoY
- ▼ -2.22%
- Metro
- Tampa-St. Petersburg-Clearwater, FL
- State GDP YoY
- ▲ 3.28%
- F500 in state
- 36
Industry mix (Fortune 500 HQ in FL)
| Industry | F500 HQs | Revenue |
|---|---|---|
| Industrial Technology | 2 | $29B |
|
||
| Insurance | 2 | $17B |
|
||
| Retail | 1 | $60B |
|
||
| Technology Distribution | 1 | $58B |
|
||
| Homebuilding | 1 | $35B |
|
||
| Technology Manufacturing | 1 | $35B |
|
||
Price history
+255.2% since first listed12 events — show timeline
- 2026-05-06 Pending — Stellar MLS as Distributed by MLS Grid
- 2026-04-29 Price Changed $460,000 Stellar MLS as Distributed by MLS Grid
- 2026-04-16 Price Changed $470,000 Stellar MLS as Distributed by MLS Grid
- 2026-04-04 Price Changed $480,000 Stellar MLS as Distributed by MLS Grid
- 2026-03-25 Price Changed $490,000 Stellar MLS as Distributed by MLS Grid
- 2026-01-29 Price Changed $499,900 Stellar MLS as Distributed by MLS Grid
- 2026-01-20 Price Changed $530,000 Stellar MLS as Distributed by MLS Grid
- 2025-12-19 Listed $539,000 Stellar MLS as Distributed by MLS Grid
- 2011-05-13 Sold (Public Records) $152,000 Public Records
- 2011-05-09 Sold (MLS) $152,000 Stellar MLS as Distributed by MLS Grid
- 2011-03-30 Listed $159,900 Stellar MLS as Distributed by MLS Grid
- 1999-09-02 Sold (Public Records) $129,500 Public Records
Property tax history
-1.1%/yrLatest (2025): $2,438 · +6.1% YoY. Source: county tax records.
Cash-flow waterfall
monthlySold comps — $/sqft
last 12 mo · ≤1 miLoading sold comps…