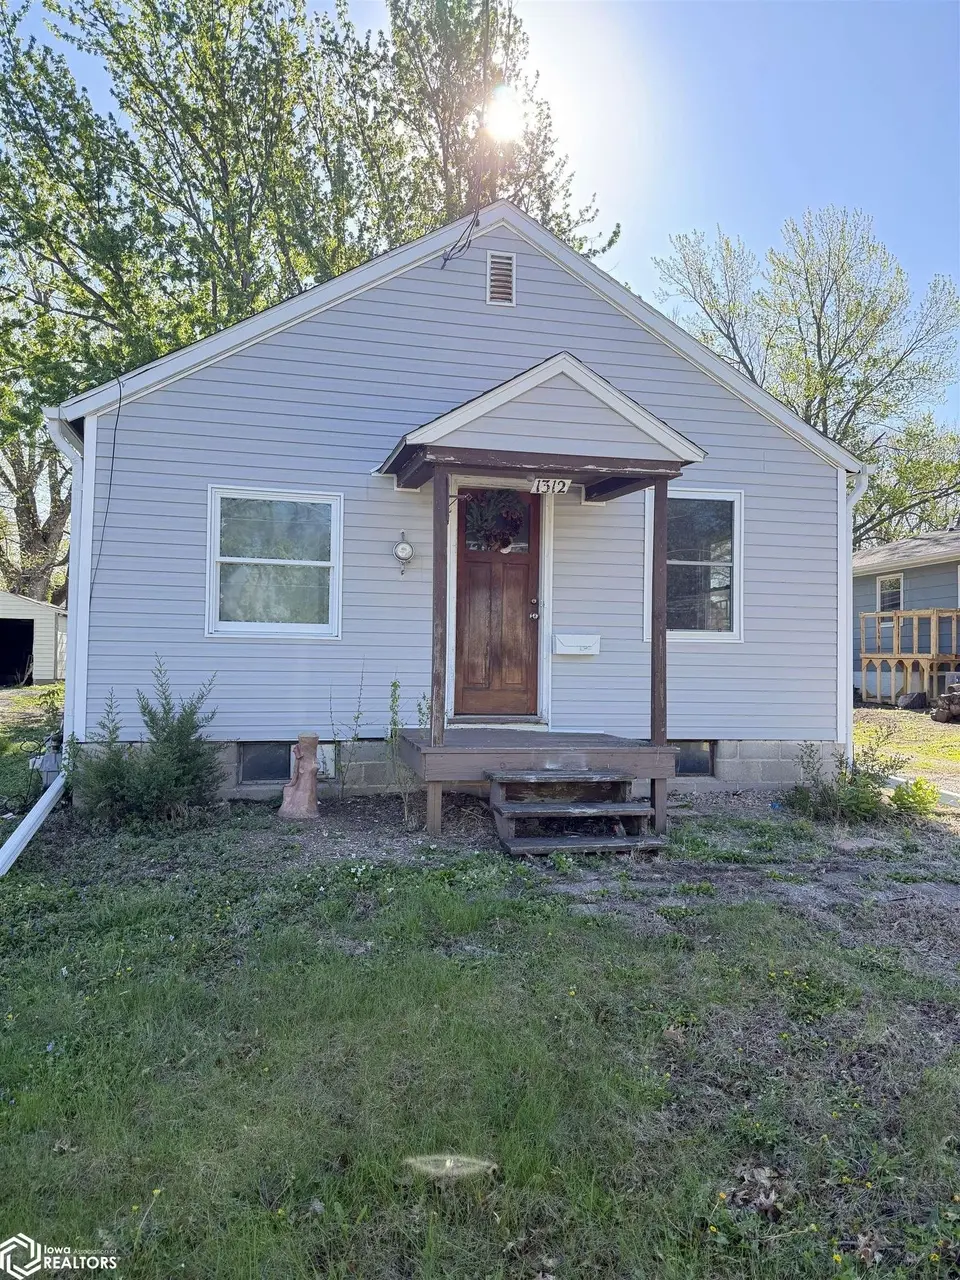
1312 South 1st St · Oskaloosa, IA
Flood risk 1/10 · Minimal
- FEMA flood zone
- X (unshaded)
- Chance of flooding over 30 yrs
- 0.0%
- Est. flood insurance / yr
- $473 – $860
Fire risk 2/10 · Minimal
- Est. fire insurance / yr
- $902 – $1,676
Heat risk 3/10 · Minor
- Hot days now (above 103°F)
- 7 days/yr
- Hot days in 30 yrs
- 16 days/yr
Wind risk 2/10 · Minimal
- Chance of severe wind over 30 yrs
- —
Air-quality risk 2/10 · Minimal
- Unhealthy air days now
- 1 days/yr
- Unhealthy air days in 30 yrs
- 1 days/yr
Risk factors via First Street. Map © Google.
Why this score? — see what drove the B+ grade
The composite is a weighted blend of 9 inputs, each scored 0–100. Each bar is that input's sub-score; the figure is the points it added to the 100-point composite (weight × sub-score).
- Cash flow +30.0/30.0
- ARV discount +14.1/15.0
- 1% rule +10.0/10.0
- DSCR +10.0/10.0
- Schools +5.4/10.0
- Livability +4.0/5.0
- Rent growth +2.5/5.0
- Condition / age +2.5/5.0
- Appreciation +0.0/10.0
$63,000
🖨 Deal sheet 📄 Offer letter ✓ Due diligence
Listing remarks MLS
No showings - SOLD to close
Key facts
- 6,534 sq ft lot
- 2 garage spots
- Built 1947
Property features AI
Exterior
- Parking: Detached 2-car garage
- Utilities: Public water; Public sewer; Circuit breaker electrical service
- Home design: Residential single-family home
- Construction: Vinyl siding construction
- Exterior features: Shingle roof; Public-maintained road access; City street frontage; Lot roughly 56' x 120' (0.15 acres)
Interior
- Bathrooms: 1 full bathroom
- Heating & cooling: Forced air heating; Window unit cooling
- Interior features: Basement present
Neighborhood map
What this means for you Summary
Snapshot
- This is a 2-bed/1.0-bath single-family listed at $63k.
Deal economics
- At list price, monthly cash flow is $385 ($5k/yr) — positive.
- The deal already cash-flows at list — no discount required.
- Meets the 1% rule at list price ($1k rent vs $63k).
- Cap rate 13.6% vs local median 4.8% in Oskaloosa — top-decile yield for the area; either an underpriced asset or a hidden risk that comps aren't pricing in. Stress-test before assuming the spread holds.
Location & tenants
- Location reads 81/100 on livability (#57 in IA, #1,325 nationally) — a professional / high-income tenant draw. Strengths: cost of living A+, housing A+, health & safety A+; Watch: employment C-, amenities D-, commute F.
- Oskaloosa Community School District (rural): math 62% / reading 67% proficiency, ranked #208 of 289 in IA (top 72%) — acceptable for families but not a draw, mixed tenant base, ~2y average lease.
- Market conditions: 71 active listings in the ZIP; 13 units permitted in Mahaska County in 2024 (0 in 5+ unit buildings).
Forward outlook
- Local home prices are declining (-3.0%/yr); year-one equity from $436 of loan paydown is wiped out by about $2k of value loss. Plan a longer hold.
- Mahaska County population projected at -10% by 2050 — secular population decline; favor cash flow + early exit over multi-decade hold.
- At projected returns (-3.0% appreciation + 3.0% rent growth), your $18k cash investment doubles in ~5 years — after that, you're playing with house money.
Negotiation context
- Only 1 days on market — expect competitive offers; lowballing is unlikely to land.
- 2 sale attempts with the ask held roughly flat each time — persistent listings suggest the price (not the market) is what's stuck; bring a comps-based counter.
- Current owner paid $40k; list at $63k implies a 57% gain — meaningful room to come down on a strong offer.
Risks & watch-outs
- Watch-outs: built in 1947 — expect roof / HVAC / electrical / plumbing capex.
Questions for the listing agent
- Built in 1947 — when were the roof, HVAC, electrical panel, plumbing, and water heater last replaced?
- Is there a deadline driving the sale (1031 exchange, divorce, estate, relocation)? That informs how much negotiation room exists.
- Schools are B-rated — typically a magnet for longer-tenancy family renters. What's the average tenant stay here, and is there a school-zone premium baked into asking?
- What's the average days-on-market for RENTAL listings here right now (not sales)? A rising rental-DOM trend means longer vacancies and softer asking-rent achievability than the comps imply.
- What's the recent tenant-quality profile in this submarket — average credit score on applications, eviction rate, late-payment / NSF rate, and stable-employment percentage? A property-management company in the area should have these aggregated.
- How much new for-sale + rental construction is in the pipeline within 1–3 miles? Heavy new supply typically softens prices + rents 12–24 months out; constrained supply supports both.
Investment metrics
- 1% rule
- 1.67% ✓
- Cap rate
- 13.63%
- Cash-on-cash
- 26.20%
- DSCR
- 2.17
- GRM
- 5.0
CMA / ARV
- ARV (on-the-fly)
- $73,920
- Comps found
- 4
Show comp detail 4 sales within ~0.75 mi
| Address | Dist | Beds/Ba | Sqft | Sold | Price | $/sf | Match |
|---|---|---|---|---|---|---|---|
| 1312 South 1st St | 0.00mi | 2/1.0 | 616 (0%) | 0mo | $63,000 | $102 | 100 |
| 1310 S 1st St | 0.01mi | 2/1.0 | 584 (-5%) | 8mo | $70,000 | $120 | 85 |
| 917 S B St | 0.32mi | 2/1.0 | 624 (+1%) | 4mo | $73,500 | $118 | 80 |
| 901 S B St | 0.36mi | 2/2.0 | 704 (+14%) | 1mo | $183,000 | $260 | 55 |
Match score weights: distance 35% · size 25% · config 20% · recency 20%. Top-matched comps best support the ARV.
Projected returns pro-forma
-3.0% appreciation · 3.0% rent growth · sell at horizon
- IRR
- 20.0%
- Equity multiple
- 1.81×
- Total profit
- $14,345
- Equity at exit
- $9,394
- IRR
- 28.2%
- Equity multiple
- 3.50×
- Total profit
- $44,174
- Equity at exit
- $5,447
Cash invested: $17,640 (down + closing). Projections, not guarantees.
Landlord ↔ Tenant lean methodology
- Overall (STATE)
- 83 Strongly Landlord-Friendly
- State Iowa
- 83 Strongly Landlord-Friendly · R+6
- County
- — inherits STATE
- City
- — inherits STATE
ZIP-level market 52577
- Home prices YoY
- -25.4%
- Active inventory
- 71
- Price-to-rent
- 5.0×
Monthly cashflow live
- Estimated rent
- $1,055 medium interval (Pro) →
- Mortgage (P&I)
- −$330
- Tax from tax record
- −$92 /mo · $1,100/yr
- Insurance
- −$26
- HOA
- −$0
- Vacancy / Maint / Mgmt
- −$222
- Net cashflow
- $385
Break-even live
UW: 25.0% down · 7.5% · 30yr · 1.5% tax · 5.0% vac · 8.0% maint · 8.0% mgmt
Financing live
Cash to close
- Down payment
- $15,750
- Closing costs
- $1,890
- Reserves months
- —
- Total cash needed
- —
Loan-product check · same deal, 3 products live
Conventional
25% down · 7.5% · 30yr
- Down + closing
- —
- Monthly P&I
- —
- Monthly cashflow
- —
- DSCR
- —
- Eligible?
- —
Personal DTI + credit; lowest rate.
DSCR
20% down · 8.5% · 30yr
- Down + closing
- —
- Monthly P&I
- —
- Monthly cashflow
- —
- DSCR
- —
- Eligible?
- —
No personal income docs; deal must DSCR.
Hard money
10% down · 12.0% · 12mo
- Down + closing
- —
- Monthly P&I
- —
- Monthly cashflow
- —
- DSCR
- —
- Eligible?
- —
Short-term bridge; refi at stabilization.
Listing history 5 events
-
2026-04-27status Pending
-
2026-04-22$63,000 Active
-
2025-06-27soldstatus $40,000 Closed 27-char remark
Show marketing remark (27 chars)
No showings - SOLD to close
-
2025-05-14status Pending 27-char remark
Show marketing remark (27 chars)
No showings - SOLD to close
-
2025-05-13$40,000 Active 27-char remark
Show marketing remark (27 chars)
No showings - SOLD to close
ⓘ Source: listings_history table (triggers on properties + properties_extension) + one-shot
backfill from property_details.listing_events for pre-trigger history.
Tax reassessment forecast IA · Partial reset (capped growth)
- Current annual tax
- $1,100 · $92/mo
- Projected year-2 tax
- $1,100 · $92/mo
- Expected delta
- $0/yr ($0/mo · 0.0%)
ⓘ Screening estimate from a state-policy table — verify with the county assessor before closing.
Climate risk First Street
- Flood 1/10 Low FEMA zone X (unshaded) · 0% chance over 30 yrs
- Wildfire 2/10 Low
- Heat 3/10 Moderate 7 d/yr ≥103°F today · 16 d/yr by 30 yrs out
- Wind 2/10 Low
- Air quality 2/10 Low 1 unhealthy d/yr today · 1 by 30 yrs out
Nearby sold comps map
Loading sold comps map…
Walkable amenities ~0.75 mi
Loading nearby amenities…
Taxation est. · year 1
- Rental income
- $12,660
- − Mortgage interest
- −$3,529
- − Property taxes
- −$1,100
- − Insurance
- −$315
- − Repairs & maintenance
- −$1,013
- − Management
- −$1,013
- − Depreciation
- −$1,833
- Taxable income
- $3,857
- Est. tax owed @ 24.0%
- −$926
- After-tax cash flow
- $3,696/yr
For passive investors: Depreciation is non-cash, so a rental often shows a tax loss while cash-flowing — sheltering income. Rental losses are passive: they offset passive income freely, and up to $25,000/yr can offset ordinary (W-2) income if you actively participate and your MAGI is under $100k (phasing out to $0 by $150k); unused losses carry forward. On sale, claimed depreciation is recaptured at up to 25%, and gains may owe capital-gains tax (a 1031 exchange can defer both). Figures are a year-1 estimate at your 24.0% rate — not tax advice; consult a CPA.
Schools (NCES district)
- District
- Oskaloosa Community School District
- NCES district ID
- 1921870
- Math proficiency
- 62% ▼ -4.00%
- Reading proficiency
- 67% ▬ 0.00%
- Median HH income
- $44,362
- Composite
- 54.26/100
- National rank
- #1373
- State rank
- #208 of 289 in IA
Livability — Oskaloosa
- Score
- 81/100
- State rank
- #57
- US rank
- #1325
Category grades
Schools grade is shown separately in the Schools card above.
Census & demographics
- Census place
- Oskaloosa, IA
- Population (ZIP)
- 14,336
Population outlook (Mahaska County) Hauer SSP2
- Today (2025)
- 22,032 people
- By 2030
- 21,682 · -1.6%
- By 2040
- 20,750 · -5.8%
- By 2050
- 19,800 · -10.1%
- By 2075
- 17,839 · -19.0%
- By 2100
- 15,829 · -28.2%
Race, ethnicity, and origin ACS 2023
- Neighborhood character
- Predominantly White (92%)
- Race & ethnicity
- White 92% Two or more races 3% Hispanic / Latino 2% Black 2% Asian 1%
- Common ancestry
- Iranian 8% Italian 3% Portuguese 2%
- Foreign-born
- 2%
- Languages at home
- 97% English-only · Other Asian/Pacific 1% Spanish 1%
Political lean MEDSL · Mahaska
- 2024 margin
- Solid R (+51.6) · D 23.6% · R 75.2% · Other 1.1%
- 2008→2024 swing
- -35.1pp toward R · 2008: -16.5pp · 2024: -51.6pp
- All cycles
- 2024: R+51.6 2020: R+47.4 2016: R+45.7 2012: R+20.5 2008: R+16.5
Not yet ingested
- Civics
- —
Market trends
- HPI YoY
- ▼ -81.78%
- Current HPI
- 239.9131
- Rent YoY
- —
- Metro
- —
- State GDP YoY
- ▲ 2.48%
- F500 in state
- 4
Industry mix (Fortune 500 HQ in IA)
| Industry | F500 HQs | Revenue |
|---|---|---|
| Financial Services | 1 | $16B |
|
||
| Retail / Convenience | 1 | $15B |
|
||
Price history
+57.5% since first listed5 events — show timeline
- 2026-04-27 Pending — IAR
- 2026-04-22 Listed $63,000 IAR
- 2025-06-27 Sold (MLS) $40,000 IAR
- 2025-05-14 Pending — IAR
- 2025-05-13 Listed $40,000 IAR
Property tax history
+1.7%/yrLatest (2025): $1,100 · +0.7% YoY. Source: county tax records.
Cash-flow waterfall
monthlySold comps — $/sqft
last 12 mo · ≤1 miLoading sold comps…