275 W 22nd St · Fayetteville, AR
Flood risk 1/10 · Minimal
- FEMA flood zone
- X (unshaded)
- Chance of flooding over 30 yrs
- 0.0%
- Est. flood insurance / yr
- $507 – $1,088
Fire risk 4/10 · Minor
- Est. fire insurance / yr
- $1,499 – $2,785
Heat risk 4/10 · Minor
- Hot days now (above 105°F)
- 6 days/yr
- Hot days in 30 yrs
- 17 days/yr
Wind risk 2/10 · Minimal
- Chance of severe wind over 30 yrs
- 2.0%
Air-quality risk 2/10 · Minimal
- Unhealthy air days now
- 1 days/yr
- Unhealthy air days in 30 yrs
- 1 days/yr
Risk factors via First Street. Map © Google.
Why this score? — see what drove the B grade
The composite is a weighted blend of 9 inputs, each scored 0–100. Each bar is that input's sub-score; the figure is the points it added to the 100-point composite (weight × sub-score).
- Cash flow +30.0/30.0
- 1% rule +10.0/10.0
- DSCR +10.0/10.0
- ARV discount +7.5/15.0
- Livability +4.2/5.0
- Schools +4.1/10.0
- Rent growth +3.2/5.0
- Condition / age +2.5/5.0
- Appreciation +0.0/10.0
$100,000
🖨 Deal sheet 📄 Offer letter ✓ Due diligence
Listing remarks MLS
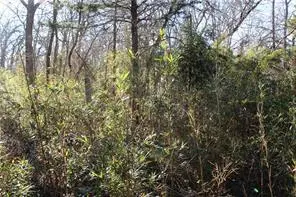
Are you looking for a project? Pretty sure this one might be a tear-down. Have a look around, but do not enter house. If you do, you do so at your own risk. Property has not been occupied in years.
Key facts
- 0.37 acre lot
- Built 1951
- Listed 14 days
Property features AI
Finance
- Other: No additional financial or community details provided
- Financial info: Annual tax amount listed elsewhere (financial details excluded)
- HOA & community: HOA information: monthly fee (amount not specified)
Exterior
- Parking: No driveway
- Security: No security features listed
- Utilities: Electricity available; Public water available
- Home design: Single-story home
- Construction: Frame construction; Block foundation; Asphalt shingle roof
- Exterior features: Wooded lot; Located on a public road
Interior
- Kitchen: No kitchen appliance details provided
- Bedrooms: Bedroom count not provided
- Flooring: Flooring details not provided
- Bathrooms: 1 full bathroom
- Heating & cooling: Heating and cooling details not provided
- Interior features: No interior features listed
- Laundry & utility: No laundry details provided
Neighborhood map
What this means for you Summary
Snapshot
- This is a 2-bed/1.0-bath single-family listed at $100k.
Deal economics
- At list price, monthly cash flow is $827 ($10k/yr) — positive.
- The deal already cash-flows at list — no discount required.
- Meets the 1% rule at list price ($2k rent vs $100k).
- Cap rate 16.2% vs local median 3.5% in Fayetteville — top-decile yield for the area; either an underpriced asset or a hidden risk that comps aren't pricing in. Stress-test before assuming the spread holds.
Location & tenants
- Location reads 83/100 on livability (#3 in AR, #871 nationally) — a professional / high-income tenant draw. Strengths: amenities A+, commute A+, health & safety A+; Watch: employment D+, crime D-.
- Fayetteville School District (urban): math 50% / reading 49% proficiency, ranked #19 of 238 in AR (top 8%) — families likely to look elsewhere, expect single-tenant / working-renter base with shorter leases.
- Market conditions: Rents rising (+2.6%/yr); 525 active listings in the ZIP; 40 comparable units currently listed for rent nearby; rentals lingering (median 44d on market — plan ~5-8 weeks vacancy on turnover, expect pricing pressure); 50% of comp listings sitting > 30 days — soft ceiling on asking rent; 3,494 units permitted in Washington County in 2024 (1,497 in 5+ unit buildings).
- This rent runs 40% of the median local income ($56k/yr) — at the standard rent-burdened threshold; future hikes will face affordability resistance.
Forward outlook
- Local home prices are declining (-3.0%/yr); year-one equity from $691 of loan paydown is wiped out by about $3k of value loss. Plan a longer hold.
- Washington County population projected at +47% by 2050 — long-run rental-demand tailwind backs the buy-and-hold thesis.
- At projected returns (-3.0% appreciation + 2.6% rent growth), your $28k cash investment doubles in ~4 years — after that, you're playing with house money.
Negotiation context
- Only 14 days on market — expect competitive offers; lowballing is unlikely to land.
- 2 sale attempts with the ask held roughly flat each time — persistent listings suggest the price (not the market) is what's stuck; bring a comps-based counter.
- Current owner paid $65k; list at $100k implies a 54% gain — meaningful room to come down on a strong offer.
Risks & watch-outs
- Watch-outs: built in 1951 — expect roof / HVAC / electrical / plumbing capex.
Questions for the listing agent
- Built in 1951 — when were the roof, HVAC, electrical panel, plumbing, and water heater last replaced?
- Is there a deadline driving the sale (1031 exchange, divorce, estate, relocation)? That informs how much negotiation room exists.
- Schools are B-rated — typically a magnet for longer-tenancy family renters. What's the average tenant stay here, and is there a school-zone premium baked into asking?
- Crime grade is D in this area — have there been break-ins, vandalism, or insurance claims at this property in the last 3 years? What carrier currently insures it and at what premium?
- What's the average days-on-market for RENTAL listings here right now (not sales)? A rising rental-DOM trend means longer vacancies and softer asking-rent achievability than the comps imply.
- What's the recent tenant-quality profile in this submarket — average credit score on applications, eviction rate, late-payment / NSF rate, and stable-employment percentage? A property-management company in the area should have these aggregated.
- How much new for-sale + rental construction is in the pipeline within 1–3 miles? Heavy new supply typically softens prices + rents 12–24 months out; constrained supply supports both.
Investment metrics
- 1% rule
- 1.86% ✓
- Cap rate
- 16.22%
- Cash-on-cash
- 35.44%
- DSCR
- 2.58
- GRM
- 4.5
CMA / ARV
- ARV (on-the-fly)
- $236,640
- Comps found
- 9
Show comp detail 9 sales within ~0.75 mi
| Address | Dist | Beds/Ba | Sqft | Sold | Price | $/sf | Match |
|---|---|---|---|---|---|---|---|
| 275 W 22nd St | 0.00mi | 2/1.0 | 1,160 (0%) | 2mo | $65,000 | $56 | 98 |
| 2215 S Coleman Ave | 0.39mi | 3/2.0 (+1) | 1,216 (+5%) | 0mo | $300,000 | $247 | 64 |
| 2240 S Clover Dr | 0.53mi | 2/1.5 | 1,130 (-3%) | 15mo | $247,500 | $219 | 57 |
| 1436 Duncan Ave | 0.73mi | 2/1.0 | 1,066 (-8%) | 18mo | $185,000 | $174 | 37 |
| 987 W Kyle Dr | 0.66mi | 3/2.0 (+1) | 1,330 (+15%) | 3mo | $275,000 | $207 | 34 |
| 602 W 15th St | 0.62mi | 2/2.0 | 1,056 (-9%) | 23mo | $208,000 | $197 | 32 |
| 2714 Haddon Ave | 0.50mi | 3/2.0 (+1) | 1,300 (+12%) | 23mo | $265,000 | $204 | 29 |
| 879 W Eden Cir | 0.60mi | 3/2.0 (+1) | 1,313 (+13%) | 17mo | $260,000 | $198 | 27 |
| 916 W Walker St | 0.75mi | 2/2.0 | 1,014 (-13%) | 21mo | $227,300 | $224 | 22 |
Match score weights: distance 35% · size 25% · config 20% · recency 20%. Top-matched comps best support the ARV.
Projected returns pro-forma
-3.0% appreciation · 2.64% rent growth · sell at horizon
- IRR
- 30.7%
- Equity multiple
- 2.28×
- Total profit
- $35,793
- Equity at exit
- $14,910
- IRR
- 37.7%
- Equity multiple
- 4.44×
- Total profit
- $96,246
- Equity at exit
- $8,646
Cash invested: $28,000 (down + closing). Projections, not guarantees.
Landlord ↔ Tenant lean methodology
- Overall (STATE)
- 92 Strongly Landlord-Friendly
- State Arkansas
- 92 Strongly Landlord-Friendly · R+14
- County
- — inherits STATE
- City
- — inherits STATE
ZIP-level market 72701
- Rents YoY
- 2.6%
- Active inventory
- 525
- Price-to-rent
- 4.5×
Monthly cashflow live
- Estimated rent
- $1,859 high interval (Pro) →
- Mortgage (P&I)
- −$524
- Tax from tax record
- −$76 /mo · $906/yr
- Insurance
- −$42
- HOA
- −$0
- Vacancy / Maint / Mgmt
- −$390
- Net cashflow
- $827
Break-even live
UW: 25.0% down · 7.5% · 30yr · 1.5% tax · 5.0% vac · 8.0% maint · 8.0% mgmt
Financing live
Cash to close
- Down payment
- $25,000
- Closing costs
- $3,000
- Reserves months
- —
- Total cash needed
- —
Loan-product check · same deal, 3 products live
Conventional
25% down · 7.5% · 30yr
- Down + closing
- —
- Monthly P&I
- —
- Monthly cashflow
- —
- DSCR
- —
- Eligible?
- —
Personal DTI + credit; lowest rate.
DSCR
20% down · 8.5% · 30yr
- Down + closing
- —
- Monthly P&I
- —
- Monthly cashflow
- —
- DSCR
- —
- Eligible?
- —
No personal income docs; deal must DSCR.
Hard money
10% down · 12.0% · 12mo
- Down + closing
- —
- Monthly P&I
- —
- Monthly cashflow
- —
- DSCR
- —
- Eligible?
- —
Short-term bridge; refi at stabilization.
Rent comps 40 comps
| Address | Beds | Baths | Sqft | Rent | $/sqft | DOM | Units | Dist |
|---|---|---|---|---|---|---|---|---|
| 1555 S Crews Ln Fayetteville, AR | 1.0–3.0 | 1.0–3.0 | 1099 | $1,450 | $1.32 | 21d | 6 | 0.70mi |
| 1935 S Garland Ave Unit 1338736P Fayetteville, AR | 3.0 | 2.5 | 1431 | $3,600 | $2.52 | 21d | 1 | 0.80mi |
| 1326 Van Buren Ave Fayetteville, AR | 2.0 | 2.5 | 1260 | $2,250 | $1.79 | 43d | 1 | 0.80mi |
| 1315 Van Buren Ave Fayetteville, AR | 2.0 | 2.0 | 1287 | $1,850 | $1.44 | 21d | 1 | 0.82mi |
| 1461 S Yampa Bnd Fayetteville, AR | 2.0 | 1.5 | 1105 | $1,995 | $1.81 | 43d | 1 | 0.83mi |
| 1234 S Ellis Ave Fayetteville, AR | 2.0 | 1.0 | 1000 | $1,500 | $1.50 | 43d | 1 | 0.83mi |
| 1467 S Yampa Bnd Fayetteville, AR | 2.0 | 1.5 | 1105 | $1,995 | $1.81 | 43d | 1 | 0.83mi |
| 1447 S Yampa Bnd Fayetteville, AR | 2.0 | 1.5 | 1105 | $1,995 | $1.81 | 43d | 1 | 0.84mi |
| 1453 S Yampa Bnd Fayetteville, AR | 2.0 | 1.5 | 1105 | $1,995 | $1.81 | 43d | 1 | 0.84mi |
| 1441 S Yampa Bnd Fayetteville, AR | 2.0 | 1.5 | 1105 | $1,995 | $1.81 | 43d | 1 | 0.85mi |
| 1435 S Yampa Bnd Fayetteville, AR | 2.0 | 1.5 | 1105 | $1,995 | $1.81 | 43d | 1 | 0.85mi |
| 1422 S Yampa Bnd Fayetteville, AR | 2.0 | 1.5 | 1105 | $1,995 | $1.81 | 43d | 1 | 0.86mi |
| 1416 S Yampa Bnd Fayetteville, AR | 2.0 | 1.5 | 1105 | $1,995 | $1.81 | 43d | 1 | 0.86mi |
| 1101 S Washington Ave Fayetteville, AR | 2.0 | 1.0 | 1000 | $1,100 | $1.10 | 43d | 1 | 0.86mi |
| 267 E 11th St Fayetteville, AR | 2.0 | 2.0 | 1465 | $2,500 | $1.71 | 43d | 1 | 0.87mi |
| 1410 S Yampa Bnd Fayetteville, AR | 2.0 | 1.5 | 1105 | $1,995 | $1.81 | 43d | 1 | 0.87mi |
| 1404 S Yampa Bnd Fayetteville, AR | 2.0 | 1.5 | 1105 | $1,995 | $1.81 | 43d | 1 | 0.87mi |
| 1348 S Yampa Bnd Fayetteville, AR | 2.0 | 1.5 | 1105 | $1,995 | $1.81 | 43d | 1 | 0.88mi |
| 936 E Bunting St Fayetteville, AR | 3.0 | 2.0 | 1266 | $1,730 | $1.37 | 43d | 1 | 1.04mi |
| 874 Hill Ave Unit 101 Fayetteville, AR | 2.0 | 1.5 | 1188 | $1,695 | $1.43 | 23d | 1 | 1.05mi |
| 404 W Streamside Bnd Fayetteville, AR | 2.0 | 1.0–2.0 | 947 | $2,759 | $2.91 | 13d | 14 | 1.05mi |
| 909 E Egret Rd Fayetteville, AR | 3.0 | 2.0 | 1268 | $1,900 | $1.50 | 14d | 1 | 1.06mi |
| 1764 S Razorback Rd Unit 1764 Fayetteville, AR | 2.0 | 2.5 | 1431 | $1,695 | $1.18 | 14d | 1 | 1.10mi |
| 1078 E Sparrow Cir Fayetteville, AR | 3.0 | 2.0 | 1230 | $1,600 | $1.30 | 44d | 1 | 1.11mi |
| 1660 S Razorback Rd Fayetteville, AR | 2.0–4.0 | 2.5–4.5 | 1723 | $1,850 | $1.07 | 13d | 1 | 1.11mi |
| 1061 E Bunting St Fayetteville, AR | 3.0 | 2.0 | 1360 | $2,000 | $1.47 | 23d | 1 | 1.12mi |
| 103 Martin Luther King Junior Blvd Unit 1 Fayetteville, AR | 2.0 | 1.0 | 700 | $900 | $1.29 | 43d | 1 | 1.12mi |
| 15 Martin Luther King Junior Blvd Unit 3 Fayetteville, AR | 2.0 | 1.0 | 700 | $875 | $1.25 | 43d | 1 | 1.12mi |
| 1636 S Razorback Rd Fayetteville, AR | 2.0 | 2.5 | 1431 | $1,850 | $1.29 | 14d | 1 | 1.12mi |
| 1572 W Cato Springs Rd Unit 1241338P Fayetteville, AR | 2.0 | 1.0 | 871 | $4,418 | $5.07 | 23d | 1 | 1.13mi |
| 1629 S Razorback Rd Fayetteville, AR | 2.0–4.0 | 2.0–4.0 | 1312 | $1,890 | $1.44 | 21d | 1 | 1.15mi |
| 1959 S Razorback Rd Unit 4 Fayetteville, AR | 2.0 | 1.0 | 700 | $895 | $1.28 | 21d | 1 | 1.15mi |
| 1983 S Razorback Rd Unit 3 Fayetteville, AR | 2.0 | 1.0 | 700 | $895 | $1.28 | 43d | 1 | 1.15mi |
| 1516 Sligo St Unit 1 Fayetteville, AR | 3.0 | 2.5 | 1393 | $2,500 | $1.79 | 14d | 1 | 1.17mi |
| 21 W 5th St Unit 1 & 2 Fayetteville, AR | 2.0 | 1.5 | 1224 | $1,480 | $1.21 | 21d | 1 | 1.18mi |
| 330 W 5th St Unit 1241344P Fayetteville, AR | 2.0 | 2.0 | 1280 | $6,602 | $5.16 | 21d | 1 | 1.20mi |
| 310 Martin Luther King Junior Blvd Unit 1221920P Fayetteville, AR | 2.0 | 1.5 | 1151 | $4,931 | $4.28 | 14d | 1 | 1.21mi |
| 352 W 5th St Unit 1241297P Fayetteville, AR | 2.0 | 2.0 | 1173 | $3,223 | $2.75 | 13d | 1 | 1.21mi |
| 576 S Willow Ave #1 Fayetteville, AR | 2.0 | 2.5 | 1188 | $2,200 | $1.85 | 23d | 1 | 1.22mi |
| 529 E Miracle Dr Fayetteville, AR | 3.0 | 2.0–2.5 | 1381 | $2,050 | $1.48 | 13d | 2 | 1.23mi |
Listing history 12 events
-
2026-06-18days on market $100,000 Active 14 DOM
-
2026-06-17days on market $100,000 Active 13 DOM
-
2026-06-16days on market $100,000 Active 12 DOM
-
2026-06-15days on market $100,000 Active 11 DOM
-
2026-06-14days on market $100,000 Active 9 DOM
-
2026-06-13days on market $100,000 Active 8 DOM
-
2026-06-10days on market $100,000 Active 6 DOM
-
2026-06-09days on market $100,000 Active 5 DOM
-
2026-06-08days on market $100,000 Active 4 DOM
-
2026-06-07days on market $100,000 Active 3 DOM
-
2026-06-05remarks 215-char remark
-
2026-06-05$100,000 Active 1 DOM
ⓘ Source: listings_history table (triggers on properties + properties_extension) + one-shot
backfill from property_details.listing_events for pre-trigger history.
Tax reassessment forecast AR · Resets to sale price
- Current annual tax
- $906 · $76/mo
- Projected year-2 tax
- $906 · $76/mo
- Expected delta
- $0/yr ($0/mo · 0.0%)
ⓘ Screening estimate from a state-policy table — verify with the county assessor before closing.
Climate risk First Street
- Flood 1/10 Low FEMA zone X (unshaded) · 0% chance over 30 yrs
- Wildfire 4/10 Moderate
- Heat 4/10 Moderate 6 d/yr ≥105°F today · 17 d/yr by 30 yrs out
- Wind 2/10 Low 2% chance of damaging wind over 30 yrs
- Air quality 2/10 Low 1 unhealthy d/yr today · 1 by 30 yrs out
Nearby sold comps map
Loading sold comps map…
Walkable amenities ~0.75 mi
Loading nearby amenities…
Taxation est. · year 1
- Rental income
- $22,307
- − Mortgage interest
- −$5,602
- − Property taxes
- −$906
- − Insurance
- −$500
- − Repairs & maintenance
- −$1,785
- − Management
- −$1,785
- − Depreciation
- −$2,909
- Taxable income
- $8,821
- Est. tax owed @ 24.0%
- −$2,117
- After-tax cash flow
- $7,807/yr
For passive investors: Depreciation is non-cash, so a rental often shows a tax loss while cash-flowing — sheltering income. Rental losses are passive: they offset passive income freely, and up to $25,000/yr can offset ordinary (W-2) income if you actively participate and your MAGI is under $100k (phasing out to $0 by $150k); unused losses carry forward. On sale, claimed depreciation is recaptured at up to 25%, and gains may owe capital-gains tax (a 1031 exchange can defer both). Figures are a year-1 estimate at your 24.0% rate — not tax advice; consult a CPA.
Schools (NCES district)
- District
- Fayetteville School District
- NCES district ID
- 0506120
- Math proficiency
- 50% ▼ -11.00%
- Reading proficiency
- 49% ▼ -8.00%
- Median HH income
- $39,595
- Composite
- 41.39/100
- National rank
- #3477
- State rank
- #19 of 238 in AR
Livability — Fayetteville
- Score
- 83/100
- State rank
- #3
- US rank
- #871
Category grades
Schools grade is shown separately in the Schools card above.
Census & demographics
- Census place
- Fayetteville, AR
- County
- Washington County · 252,056 people
- City population
- 118,228
- Metro
- Fayetteville-Springdale-Rogers, AR
- Population (ZIP)
- 49,835
- Household income
- $55,506
- Rent vs Own
- Severe rent burden
- 2582.0
Population outlook (Washington County) Hauer SSP2
- Today (2025)
- 271,748 people
- By 2030
- 296,414 · +9.1%
- By 2040
- 346,874 · +27.6%
- By 2050
- 398,552 · +46.7%
- By 2075
- 523,309 · +92.6%
- By 2100
- 615,280 · +126.4%
Race, ethnicity, and origin ACS 2023
- Neighborhood character
- Predominantly White (73%)
- Race & ethnicity
- White 73% Two or more races 12% Hispanic / Latino 8% Black 5% Asian 3% Native American 1%
- Hispanic origin (detail)
- Mexican 5%
- Common ancestry
- Italian 3% Lithuanian 2% Slovak 2%
- Foreign-born
- 5% · Canada, China, Vietnam
- Languages at home
- 93% English-only · Spanish 4% Other Indo-European 1%
Political lean MEDSL · Washington
- 2024 margin
- Lean R (+6.7) · D 45.1% · R 51.7% · Other 3.2%
- 2008→2024 swing
- +6.4pp toward D · 2008: -13.1pp · 2024: -6.7pp
- All cycles
- 2024: R+6.7 2020: R+3.9 2016: R+10.4 2012: R+16.3 2008: R+13.1
Not yet ingested
- Civics
- —
Market trends
- HPI YoY
- ▼ -326.86%
- Current HPI
- 329.5644
- Rent YoY
- ▲ 2.64%
- Metro
- Fayetteville-Springdale-Rogers, AR
- State GDP YoY
- ▲ 3.80%
- F500 in state
- 10
Industry mix (Fortune 500 HQ in AR)
| Industry | F500 HQs | Revenue |
|---|---|---|
| Retail | 1 | $681B |
|
||
| Food / Agriculture | 1 | $53B |
|
||
| Retail / Energy | 1 | $22B |
|
||
| Transportation / Logistics | 1 | $12B |
|
||
| Energy | 1 | $4B |
|
||
Price history
-13.0% since first listed7 events — show timeline
- 2026-06-04 Listed $100,000 NWARMLS
- 2026-04-15 Sold (MLS) $65,000 NWARMLS
- 2026-03-23 Pending — NWARMLS
- 2026-02-20 Price Changed $100,000 NWARMLS
- 2026-01-29 Price Changed $105,000 NWARMLS
- 2026-01-22 Price Changed $110,000 NWARMLS
- 2026-01-12 Listed $115,000 NWARMLS
Property tax history
+5.0%/yrLatest (2025): $906 · +8.3% YoY. Source: county tax records.
Cash-flow waterfall
monthlySold comps — $/sqft
last 12 mo · ≤1 miLoading sold comps…