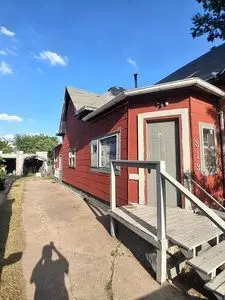
313 S Bellevue Ave · Hastings, NE
Flood risk 1/10 · Minimal
- FEMA flood zone
- X (unshaded)
- Chance of flooding over 30 yrs
- 0.0%
- Est. flood insurance / yr
- $473 – $860
Fire risk 1/10 · Minimal
- Est. fire insurance / yr
- $1,161 – $2,155
Heat risk 3/10 · Minor
- Hot days now (above 101°F)
- 7 days/yr
- Hot days in 30 yrs
- 17 days/yr
Wind risk 2/10 · Minimal
- Chance of severe wind over 30 yrs
- —
Air-quality risk 1/10 · Minimal
- Unhealthy air days now
- 0 days/yr
- Unhealthy air days in 30 yrs
- 0 days/yr
Risk factors via First Street. Map © Google.
Why this score? — see what drove the B- grade
The composite is a weighted blend of 9 inputs, each scored 0–100. Each bar is that input's sub-score; the figure is the points it added to the 100-point composite (weight × sub-score).
- Cash flow +30.0/30.0
- 1% rule +10.0/10.0
- DSCR +10.0/10.0
- ARV discount +7.5/15.0
- Livability +4.0/5.0
- Schools +3.4/10.0
- Rent growth +2.5/5.0
- Condition / age +2.5/5.0
- Appreciation +0.0/10.0
$50,000
🖨 Deal sheet 📄 Offer letter ✓ Due diligence
Listing remarks
Sweat equity deal, Priced to sell, looking for a cash/quick close. .. needs about 30k in materials and the know how and you could have a nice rental or a home. .. value add potential in the basement with good Celling heights. .. if you need access to capital, simplestate lending, out of lincoln lends at 18% of the purchase price. . Then you could refi into long term permanent debt once the property fixed/livable. .. roof does currently have a small active leak that needs patched. .. any questions shoot me a text. . hablo espanol
Key facts
- Built 1910
- Listed 7 days
Neighborhood map
What this means for you Summary
Snapshot
- This is a 2-bed/1.0-bath single-family listed at $50k.
Deal economics
- At list price, monthly cash flow is $647 ($8k/yr) — positive.
- The deal already cash-flows at list — no discount required.
- Meets the 1% rule at list price ($1k rent vs $50k).
- Cap rate 21.8% vs local median 4.4% in Hastings — top-decile yield for the area; either an underpriced asset or a hidden risk that comps aren't pricing in. Stress-test before assuming the spread holds.
Location & tenants
- Location reads 79/100 on livability (#41 in NE, #2,188 nationally) — a middle-class / working-renter tenant base. Strengths: cost of living A+, housing A+, health & safety A+; Watch: crime C-, amenities D-, commute F.
- Hastings Public Schools (town): math 38% / reading 42% proficiency, ranked #96 of 111 in NE (top 86%) — families likely to look elsewhere, expect single-tenant / working-renter base with shorter leases.
- Market conditions: 191 active listings in the ZIP; 217 units permitted in Adams County in 2024 (132 in 5+ unit buildings).
Forward outlook
- Local home prices are declining (-3.0%/yr); year-one equity from $346 of loan paydown is wiped out by about $2k of value loss. Plan a longer hold.
- At projected returns (-3.0% appreciation + 3.0% rent growth), your $14k cash investment doubles in ~3 years — after that, you're playing with house money.
Negotiation context
- Only 8 days on market — expect competitive offers; lowballing is unlikely to land.
- Current owner paid $19k; list at $50k implies a 163% gain — meaningful room to come down on a strong offer.
Risks & watch-outs
- Watch-outs: built in 1910 — expect roof / HVAC / electrical / plumbing capex.
Questions for the listing agent
- Built in 1910 — when were the roof, HVAC, electrical panel, plumbing, and water heater last replaced?
- Is there a deadline driving the sale (1031 exchange, divorce, estate, relocation)? That informs how much negotiation room exists.
- What's the average days-on-market for RENTAL listings here right now (not sales)? A rising rental-DOM trend means longer vacancies and softer asking-rent achievability than the comps imply.
- What's the recent tenant-quality profile in this submarket — average credit score on applications, eviction rate, late-payment / NSF rate, and stable-employment percentage? A property-management company in the area should have these aggregated.
- How much new for-sale + rental construction is in the pipeline within 1–3 miles? Heavy new supply typically softens prices + rents 12–24 months out; constrained supply supports both.
Investment metrics
- 1% rule
- 2.59% ✓
- Cap rate
- 21.81%
- Cash-on-cash
- 55.42%
- DSCR
- 3.47
- GRM
- 3.2
CMA / ARV
- ARV (on-the-fly)
- $116,824
- Comps found
- 9
Show comp detail 9 sales within ~0.75 mi
| Address | Dist | Beds/Ba | Sqft | Sold | Price | $/sf | Match |
|---|---|---|---|---|---|---|---|
| 308 S Garfield Ave | 0.18mi | 2/1.0 | 910 (+6%) | 3mo | $95,000 | $104 | 79 |
| 1115 W E St | 0.29mi | 2/1.0 | 840 (-2%) | 11mo | $91,700 | $109 | 74 |
| 515 S Kansas Ave | 0.49mi | 2/1.0 | 898 (+4%) | 8mo | $110,000 | $122 | 63 |
| 619 S Boston Ave | 0.40mi | 2/1.0 | 767 (-11%) | 4mo | $123,500 | $161 | 60 |
| 410 S Lexington Ave | 0.07mi | 1/1.0 (-1) | 947 (+10%) | 19mo | $142,000 | $150 | 59 |
| 719 S Kansas Ave | 0.56mi | 2/2.0 | 936 (+9%) | 6mo | $165,000 | $176 | 49 |
| 738 N Bellevue Ave | 0.70mi | 2/1.0 | 900 (+5%) | 13mo | $90,000 | $100 | 49 |
| 217 W 4th St | 0.67mi | 3/2.0 (+1) | 919 (+7%) | 3mo | $150,000 | $163 | 46 |
| 1129 Renae Ln | 0.61mi | 3/2.0 (+1) | 920 (+7%) | 12mo | $125,500 | $136 | 40 |
Match score weights: distance 35% · size 25% · config 20% · recency 20%. Top-matched comps best support the ARV.
Projected returns pro-forma
-3.0% appreciation · 3.0% rent growth · sell at horizon
- IRR
- 53.7%
- Equity multiple
- 3.37×
- Total profit
- $33,119
- Equity at exit
- $7,455
- IRR
- 58.9%
- Equity multiple
- 6.86×
- Total profit
- $82,028
- Equity at exit
- $4,323
Cash invested: $14,000 (down + closing). Projections, not guarantees.
Landlord ↔ Tenant lean methodology
- Overall (STATE)
- 83 Strongly Landlord-Friendly
- State Nebraska
- 83 Strongly Landlord-Friendly · R+13
- County
- — inherits STATE
- City
- — inherits STATE
ZIP-level market 68901
- Active inventory
- 191
- Price-to-rent
- 3.2×
Monthly cashflow live
- Estimated rent
- $1,297 medium interval (Pro) →
- Mortgage (P&I)
- −$262
- Tax from tax record
- −$95 /mo · $1,137/yr
- Insurance
- −$21
- HOA
- −$0
- Vacancy / Maint / Mgmt
- −$272
- Net cashflow
- $647
Break-even live
UW: 25.0% down · 7.5% · 30yr · 1.5% tax · 5.0% vac · 8.0% maint · 8.0% mgmt
Financing live
Cash to close
- Down payment
- $12,500
- Closing costs
- $1,500
- Reserves months
- —
- Total cash needed
- —
Loan-product check · same deal, 3 products live
Conventional
25% down · 7.5% · 30yr
- Down + closing
- —
- Monthly P&I
- —
- Monthly cashflow
- —
- DSCR
- —
- Eligible?
- —
Personal DTI + credit; lowest rate.
DSCR
20% down · 8.5% · 30yr
- Down + closing
- —
- Monthly P&I
- —
- Monthly cashflow
- —
- DSCR
- —
- Eligible?
- —
No personal income docs; deal must DSCR.
Hard money
10% down · 12.0% · 12mo
- Down + closing
- —
- Monthly P&I
- —
- Monthly cashflow
- —
- DSCR
- —
- Eligible?
- —
Short-term bridge; refi at stabilization.
Listing history 6 events
-
2026-06-16days on market $50,000 Active 8 DOM
-
2026-06-15days on market $50,000 Active 7 DOM
-
2026-06-13days on market $50,000 Active 5 DOM
-
2026-06-12days on market $50,000 Active 4 DOM
-
2026-06-09remarks 535-char remark
-
2026-06-09$50,000 Active 1 DOM
ⓘ Source: listings_history table (triggers on properties + properties_extension) + one-shot
backfill from property_details.listing_events for pre-trigger history.
Tax reassessment forecast NE · Resets to sale price
- Current annual tax
- $1,137 · $95/mo
- Projected year-2 tax
- $1,137 · $95/mo
- Expected delta
- $0/yr ($0/mo · 0.0%)
ⓘ Screening estimate from a state-policy table — verify with the county assessor before closing.
Climate risk First Street
- Flood 1/10 Low FEMA zone X (unshaded) · 0% chance over 30 yrs
- Wildfire 1/10 Low
- Heat 3/10 Moderate 7 d/yr ≥101°F today · 17 d/yr by 30 yrs out
- Wind 2/10 Low
- Air quality 1/10 Low 0 unhealthy d/yr today · 0 by 30 yrs out
Nearby sold comps map
Loading sold comps map…
Walkable amenities ~0.75 mi
Loading nearby amenities…
Taxation est. · year 1
- Rental income
- $15,560
- − Mortgage interest
- −$2,801
- − Property taxes
- −$1,137
- − Insurance
- −$250
- − Repairs & maintenance
- −$1,245
- − Management
- −$1,245
- − Depreciation
- −$1,455
- Taxable income
- $7,428
- Est. tax owed @ 24.0%
- −$1,783
- After-tax cash flow
- $5,976/yr
For passive investors: Depreciation is non-cash, so a rental often shows a tax loss while cash-flowing — sheltering income. Rental losses are passive: they offset passive income freely, and up to $25,000/yr can offset ordinary (W-2) income if you actively participate and your MAGI is under $100k (phasing out to $0 by $150k); unused losses carry forward. On sale, claimed depreciation is recaptured at up to 25%, and gains may owe capital-gains tax (a 1031 exchange can defer both). Figures are a year-1 estimate at your 24.0% rate — not tax advice; consult a CPA.
Schools (NCES district)
- District
- Hastings Public Schools
- NCES district ID
- 3171580
- Math proficiency
- 38% ▼ -8.00%
- Reading proficiency
- 42% ▼ -4.00%
- Median HH income
- $42,942
- Composite
- 33.81/100
- National rank
- #5363
- State rank
- #96 of 111 in NE
Livability — Hastings
- Score
- 79/100
- State rank
- #41
- US rank
- #2188
Category grades
Schools grade is shown separately in the Schools card above.
Census & demographics
- Census place
- Hastings, NE
- City population
- 26,208
- Population (ZIP)
- 26,208
Population outlook (Adams County) Hauer SSP2
- Today (2025)
- 31,965 people
- By 2030
- 32,079 · +0.4%
- By 2040
- 31,999 · +0.1%
- By 2050
- 31,586 · -1.2%
- By 2075
- 30,856 · -3.5%
- By 2100
- 29,948 · -6.3%
Race, ethnicity, and origin ACS 2023
- Neighborhood character
- Predominantly White (81%)
- Race & ethnicity
- White 81% Hispanic / Latino 14% Two or more races 8% Black 1% Asian 1%
- Hispanic origin (detail)
- Mexican 9% Cuban 1%
- Common ancestry
- Lithuanian 2% Romanian 2% Italian 2%
- Foreign-born
- 7% · Canada, Vietnam
- Languages at home
- 89% English-only · Spanish 9% Vietnamese 1%
Political lean MEDSL · Adams
- 2024 margin
- Solid R (+41.6) · D 28.5% · R 70.2% · Other 1.3%
- 2008→2024 swing
- -14.6pp toward R · 2008: -27.0pp · 2024: -41.6pp
- All cycles
- 2024: R+41.6 2020: R+40.1 2016: R+45.0 2012: R+34.1 2008: R+27.0
Not yet ingested
- Civics
- —
Market trends
- HPI YoY
- ▼ -255.77%
- Current HPI
- 232.0444
- Rent YoY
- —
- Metro
- —
- State GDP YoY
- ▲ 0.68%
- F500 in state
- 2
Industry mix (Fortune 500 HQ in NE)
| Industry | F500 HQs | Revenue |
|---|---|---|
| Conglomerate | 1 | $371B |
|
||
Price history
+163.2% since first listed2 events — show timeline
- 2026-06-09 Listed $50,000 FSBO.com
- 2009-10-08 Sold (Public Records) $19,000 Public Records
Property tax history
+7.6%/yrLatest (2025): $1,137 · +6.8% YoY. Source: county tax records.
Cash-flow waterfall
monthlySold comps — $/sqft
last 12 mo · ≤1 miLoading sold comps…