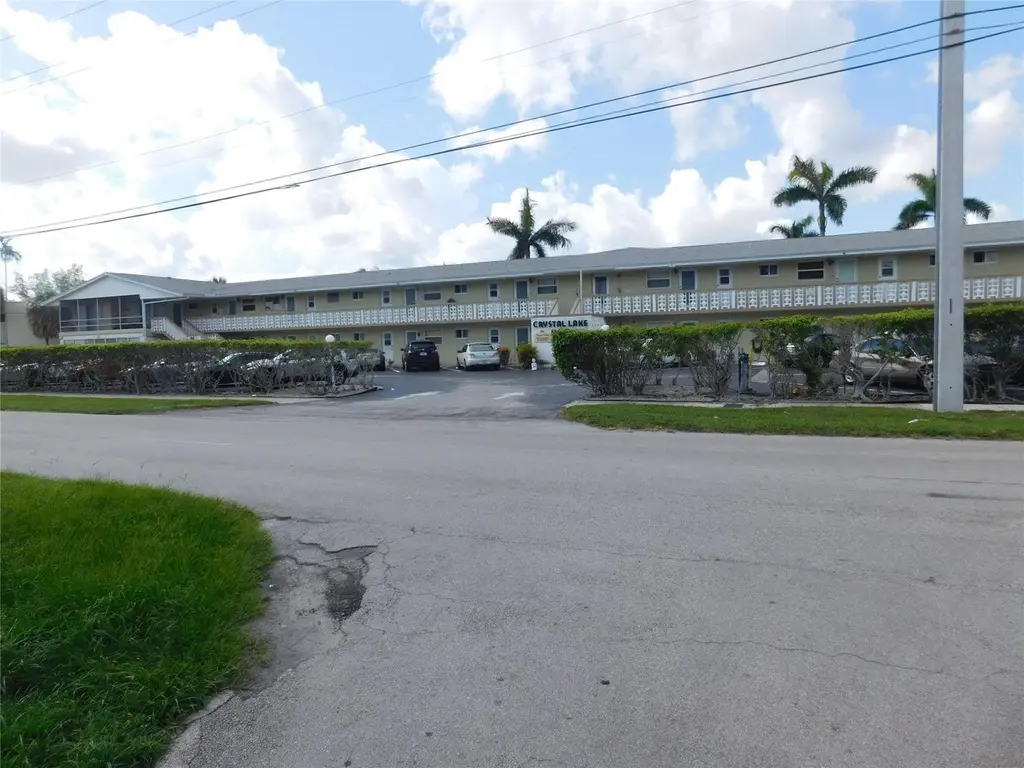
960 Crystal Lake Dr #201 · Deerfield Beach, FL
Flood risk 1/10 · Minimal
- FEMA flood zone
- X (unshaded)
- Chance of flooding over 30 yrs
- 0.0%
- Est. flood insurance / yr
- $507 – $1,088
Fire risk 1/10 · Minimal
- Est. fire insurance / yr
- $947 – $1,759
Heat risk 9/10 · Severe
- Hot days now (above 107°F)
- 7 days/yr
- Hot days in 30 yrs
- 26 days/yr
Wind risk 10/10 · Severe
- Chance of severe wind over 30 yrs
- 99.0%
Air-quality risk 2/10 · Minimal
- Unhealthy air days now
- 1 days/yr
- Unhealthy air days in 30 yrs
- 3 days/yr
Risk factors via First Street. Map © Google.
Why this score? — see what drove the D grade
The composite is a weighted blend of 9 inputs, each scored 0–100. Each bar is that input's sub-score; the figure is the points it added to the 100-point composite (weight × sub-score).
- Cash flow +11.6/30.0
- 1% rule +9.2/10.0
- ARV discount +7.5/15.0
- Schools +4.1/10.0
- Livability +3.8/5.0
- DSCR +3.4/10.0
- Rent growth +2.9/5.0
- Condition / age +2.5/5.0
- Appreciation +0.0/10.0
$145,000
🖨 Deal sheet (PDF) 📄 Offer letter ✓ Due diligence
Listing remarks
LOCATION, LOCATION, LOCATION!!! COULDN'T ASK FOR A BETTER VIEW - THE SERENITY AND TRANQUILITY IN THAT COMMUNITY ARE EXCELLENT - WHAT A BARGAIN!!! PLEASE HURRY UP!!! IT WON'T LAST - BEAUTIFUL 2 BEDROOMS 2 BATHS 2ND FLOOR CONDO MINUTES AWAY FROM THE BEACH AND FORT LAUDERDALE AIRPORT - IT'S A 55+ COMMUNITY - NO PETS ARE ALLOWED EXCEPT FOR CATS - SELLERS ARE EXTREMELY MOTIVATED AND WILLING TO PREPAY 6 MONTHS OF HOA FEE AT CLOSING FOR THE BUYER - THE ROOF IS FAIRLY RECENT - NO SPECIAL ASSESSMENTS - OCCUPIED WITH GREAT TENANT @ $1,500 PER MONTH UNTIL 06/16/2027
Key facts
- $560 HOA
- Parking
- Community pool
Property features AI
Finance
- HOA & community: Association with pool and parking; Quarterly HOA fee; HOA covers water, sewer and trash; Senior community; Pets not allowed
Exterior
- Parking: Open asphalt parking; Guest parking; 1 parking space
- Security: Smoke detectors
- Utilities: Public water; Public sewer; Sewer available; Water available
- Home design: Condominium; One level; Resale; Faces east; 2 total stories in building
- Construction: Block / CBS construction; Composition shingle roof; Concrete perimeter foundation; Built with doors that contribute to energy efficiency
- Exterior features: Covered patio; Screened patio; Patio; Fenced; City street frontage; Road surface: asphalt; Public maintained road; Not waterfront
Interior
- Kitchen: Electric range; Refrigerator
- Bedrooms: 2 bedrooms on the main level
- Flooring: Tile
- Bathrooms: 2 full bathrooms on the main level
- Heating & cooling: Central heating (electric); Space heater; Central air conditioning (electric); Ceiling fans
- Interior features: Split bedroom layout; Blinds; Unfurnished
- Laundry & utility: Common area laundry
Neighborhood map
What this means for you Summary
Snapshot
- This is a 2-bed/2.0-bath condo listed at $145k.
Deal economics
- At list price, monthly cash flow is $-46 ($-557/yr) — negative.
- To cash-flow at today's rent, offer at most $137k (5.7% below list).
- Meets the 1% rule at list price ($2k rent vs $145k).
- Recommended offer: $137k (5.7% below list) — sets the bar for cash-flow.
- Cap rate 5.9% vs local median 4.2% in Deerfield Beach — top-decile yield for the area; either an underpriced asset or a hidden risk that comps aren't pricing in. Stress-test before assuming the spread holds.
Location & tenants
- Location reads 75/100 on livability (#250 in FL, #3,970 nationally) — a middle-class / working-renter tenant base. Strengths: housing A+, health & safety A+, cost of living A; Watch: amenities D-, employment D-.
- Broward (suburban): math 42% / reading 53% proficiency, ranked #46 of 73 in FL (top 63%) — families likely to look elsewhere, expect single-tenant / working-renter base with shorter leases.
- Zoned schools: Quiet Waters Elementary School (math 40% / reading 48%, grade F, #1,330 of 2,144 statewide, top 63%, 1,128 students, 62% FRL); Crystal Lake Middle School (math 24% / reading 38%, grade F, #462 of 571 statewide, top 81%, 1,055 students, 74% FRL); Blanche Ely High School (math 7% / reading 29%, grade F, #570 of 667 statewide, top 86%, 1,906 students, 75% FRL) — zoned schools average 70% FRL vs 51% district-wide (19 pts higher); higher-poverty schools than district average — tighter screening recommended.
- Zoned-school proficiency averages 31% at this address vs 48% district-wide (-16 pts) — the specific schools serving this property underperform the Broward average; the district grade overstates school quality for this exact location.
- Market conditions: Rents rising (+1.8%/yr); 595 active listings in the ZIP; 40 comparable units currently listed for rent nearby; rentals at typical pace (median 27d on market — plan ~3-4 weeks tenant-placement turnaround); 2,111 units permitted in Broward County in 2024 (1,265 in 5+ unit buildings).
- This rent runs 35% of the median local income ($71k/yr) — at the standard rent-burdened threshold; future hikes will face affordability resistance.
Forward outlook
- Local home prices are declining (-3.0%/yr); year-one equity from $1k of loan paydown is wiped out by about $4k of value loss. Plan a longer hold.
- Broward County population projected at +34% by 2050 — long-run rental-demand tailwind backs the buy-and-hold thesis.
Negotiation context
- It's been on market 55 days — a 3% lower offer ($141k) is reasonable based on typical stale-listing flexibility.
- Current owner paid $80k; list at $145k implies a 81% gain — meaningful room to come down on a strong offer.
Risks & watch-outs
- Watch-outs: HOA is 27% of rent.
- Climate carrying-cost: severe wind risk, 99% chance of damaging wind over 30y; extreme-heat days projected 7→26/yr by 2055 (HVAC capex compounding) — expect insurance premiums to compound above CPI over the hold.
Questions for the listing agent
- What do current leases actually rent for vs. the listed asking? Can we see a recent rent roll and the last 12 months of T-12 income?
- It's been on market 55 days. Have you received any prior offers? Is the seller open to a 6% concession, seller financing, or rate buy-down credit?
- Built in 1965 — when were the roof, HVAC, electrical panel, plumbing, and water heater last replaced?
- What does the HOA fee cover, when was the last increase, and are there any pending special assessments or reserve-fund shortfalls?
- Any open or pending special assessments — roof, HVAC, plumbing, elevator, façade? What's the per-unit balance and payoff schedule, and is the seller paying it off at close or rolling it to the buyer?
- Is there a deadline driving the sale (1031 exchange, divorce, estate, relocation)? That informs how much negotiation room exists.
- Schools are D-rated, which usually means shorter tenancies and higher turnover. Who's the typical renter profile here, and what's been the actual vacancy rate?
- The area grade is low — what's the realistic commute time and amenity access for the typical tenant pool here? Any planned neighborhood developments (good or bad) we should know about?
- What's the average days-on-market for RENTAL listings here right now (not sales)? A rising rental-DOM trend means longer vacancies and softer asking-rent achievability than the comps imply.
- What's the recent tenant-quality profile in this submarket — average credit score on applications, eviction rate, late-payment / NSF rate, and stable-employment percentage? A property-management company in the area should have these aggregated.
- How much new apartment / multifamily construction is in the pipeline within 1–3 miles? Heavy new supply (>2% of stock underway) typically softens rents 12–24 months out; light construction supports rent growth.
Investment metrics
- 1% rule
- 1.42% ✓
- Cap rate
- 5.91%
- Cash-on-cash
- -1.37%
- DSCR
- 0.94
- GRM
- 5.9
CMA / ARV
No comps found within radius.
Projected returns pro-forma
-3.0% appreciation · 1.75% rent growth · sell at horizon
- IRR
- -20.6%
- Equity multiple
- 0.30×
- Total profit
- $-28,568
- Equity at exit
- $21,620
- IRR
- -18.4%
- Equity multiple
- 0.09×
- Total profit
- $-37,121
- Equity at exit
- $12,537
Cash invested: $40,600 (down + closing). Projections, not guarantees.
Landlord ↔ Tenant lean methodology
- Overall (STATE)
- 87 Strongly Landlord-Friendly
- State Florida
- 87 Strongly Landlord-Friendly · R+3
- County
- — inherits STATE
- City
- — inherits STATE
ZIP-level market 33064
- Home prices YoY
- -18.7%
- Rents YoY
- 1.8%
- Active inventory
- 595
- Price-to-rent
- 5.9×
Monthly cashflow live
- Estimated rent
- $2,060 high interval (Pro) →
- Mortgage (P&I)
- −$760
- Tax from tax record
- −$293 /mo · $3,520/yr
- Insurance
- −$60
- HOA
- −$560
- Vacancy / Maint / Mgmt
- −$433
- Net cashflow
- $-46
Break-even live
Sensitivity live
| Price | -10% $36 | -5% $-5 | +0% $-46 | +5% $-87 | +10% $-128 |
|---|---|---|---|---|---|
| Rent | -10% $-209 | -5% $-128 | +0% $-46 | +5% $35 | +10% $116 |
| Rate | -1.0pp $27 | -0.5pp $-10 | base $-46 | +0.5pp $-84 | +1.0pp $-122 |
UW: 25.0% down · 7.5% · 30yr · 1.5% tax · 5.0% vac · 8.0% maint · 8.0% mgmt
Financing live
Cash to close
- Down payment
- $36,250
- Closing costs
- $4,350
- Reserves months
- —
- Total cash needed
- —
Loan-product check · same deal, 3 products live
Conventional
25% down · 7.5% · 30yr
- Down + closing
- —
- Monthly P&I
- —
- Monthly cashflow
- —
- DSCR
- —
- Eligible?
- —
Personal DTI + credit; lowest rate.
DSCR
20% down · 8.5% · 30yr
- Down + closing
- —
- Monthly P&I
- —
- Monthly cashflow
- —
- DSCR
- —
- Eligible?
- —
No personal income docs; deal must DSCR.
Hard money
10% down · 12.0% · 12mo
- Down + closing
- —
- Monthly P&I
- —
- Monthly cashflow
- —
- DSCR
- —
- Eligible?
- —
Short-term bridge; refi at stabilization.
Rent comps 40 comps
| Address | Beds | Baths | Sqft | Rent | $/sqft | DOM | Units | Dist |
|---|---|---|---|---|---|---|---|---|
| 941 Crystal Lake Dr #302 Deerfield Beach, FL | 2.0 | 2.0 | 882 | $1,890 | $2.14 | 17d | 1 | 0.07mi |
| 1021 Crystal Lake Dr #203 Deerfield Beach, FL | 2.0 | 2.0 | 890 | $1,800 | $2.02 | 17d | 1 | 0.08mi |
| 1100 Crystal Lake Dr #207 Deerfield Beach, FL | 1.0 | 1.0 | 660 | $1,900 | $2.88 | 26d | 1 | 0.12mi |
| 1101 Crystal Lake Dr #203 Deerfield Beach, FL | 2.0 | 2.0 | 930 | $2,200 | $2.37 | 26d | 1 | 0.12mi |
| 858 Crystal Lake Dr #858 Pompano Beach, FL | 2.0 | 2.0 | 987 | $2,200 | $2.23 | 26d | 1 | 0.13mi |
| 3901 NW 9th Ave Deerfield Beach, FL | 2.0 | 2.0 | 800 | $1,995 | $2.49 | 26d | 1 | 0.14mi |
| 3808 Crystal Lake Dr Pompano Beach, FL | 2.0 | 2.0 | 986 | $2,550 | $2.59 | 0d | 1 | 0.21mi |
| 4061 NW 9th Ave #206 Deerfield Beach, FL | 2.0 | 2.0 | 800 | $1,900 | $2.38 | 26d | 1 | 0.27mi |
| 3910 Crystal Lake Dr #201 Deerfield Beach, FL | 2.0 | 2.0 | 884 | $2,000 | $2.26 | 26d | 1 | 0.32mi |
| 3550 NW 8th Ave Pompano Beach, FL | 2.0 | 1.5 | 765 | $1,775 | $2.32 | 17d | 4 | 0.39mi |
| 3500 Blue Lake Dr #101 Pompano Beach, FL | 1.0 | 1.5 | 850 | $1,900 | $2.24 | 26d | 1 | 0.41mi |
| 3400 Blue Lake Dr Pompano Beach, FL | 2.0 | 2.0 | 1039 | $2,288 | $2.20 | 26d | 2 | 0.41mi |
| 3550 Blue Lake Dr Pompano Beach, FL | 1.0 | 1.5 | 850 | $1,850 | $2.18 | 26d | 1 | 0.41mi |
| 521 NW 35th Ct Unit D Pompano Beach, FL | 1.0 | 1.0 | 600 | $1,525 | $2.54 | 26d | 1 | 0.42mi |
| 4304 NW 9th Ave Unit 2-2D Pompano Beach, FL | 2.0 | 2.0 | 1040 | $1,750 | $1.68 | 17d | 1 | 0.49mi |
| 4314 NW 9th Ave Deerfield Beach, FL | 1.0–2.0 | 1.5–2.0 | 992 | $1,940 | $1.95 | 17d | 2 | 0.50mi |
| 4354 NW 9th Ave Unit 12-3D Pompano Beach, FL | 2.0 | 2.0 | 1040 | $2,000 | $1.92 | 26d | 1 | 0.50mi |
| 4394 NW 9th Ave Unit 20-1A Deerfield Beach, FL | 2.0 | 2.0 | 950 | $1,700 | $1.79 | 26d | 1 | 0.50mi |
| 651 NW 42nd Ct #214 Deerfield Beach, FL | 2.0 | 1.0 | 721 | $1,695 | $2.35 | 26d | 1 | 0.54mi |
| 401 NW 34th St Pompano Beach, FL | 2.0 | 1.0–1.5 | 704 | $2,294 | $3.26 | 4d | 16 | 0.54mi |
| 4450 Military Trl Unit 22 Pompano Beach, FL | 2.0 | 1.0 | 940 | $1,950 | $2.07 | 26d | 1 | 0.58mi |
| 1001 NW 45th St #6 Deerfield Beach, FL | 2.0 | 2.0 | 850 | $2,200 | $2.59 | 17d | 1 | 0.59mi |
| 351 NW 42nd Ct Apt 205 Pompano Beach, FL | 2.0 | 1.0 | 800 | $1,899 | $2.37 | 17d | 1 | 0.65mi |
| 311 NW 42nd Ct #101 Deerfield Beach, FL | 2.0 | 1.0 | 800 | $1,799 | $2.25 | 26d | 1 | 0.66mi |
| 4325 NW 5th Ave Deerfield Beach, FL | 2.0 | 2.0 | 953 | $2,249 | $2.36 | 12d | 1 | 0.67mi |
| 3005 NW 5th Ter #2 Pompano Beach, FL | 2.0 | 1.0 | 968 | $2,100 | $2.17 | 26d | 1 | 0.68mi |
| 331 NW 42nd Ct Unit 101 Pompano Beach, FL | 2.0 | 1.0 | 800 | $1,799 | $2.25 | 17d | 1 | 0.69mi |
| 250 W Sample Rd Pompano Beach, FL | 1.0–2.0 | 1.0–2.0 | 900 | $2,150 | $2.39 | 26d | 1 | 0.70mi |
| 1421 NW 45th St #5 Deerfield Beach, FL | 2.0 | 2.0 | 760 | $2,000 | $2.63 | 26d | 1 | 0.70mi |
| 3000 NW 5th Ter #129 Pompano Beach, FL | 2.0 | 2.0 | 912 | $2,000 | $2.19 | 26d | 1 | 0.74mi |
| 3109 NW 2nd Ter Unit 4-156 Pompano Beach, FL | 1.0 | 1.0 | 680 | $1,600 | $2.35 | 17d | 1 | 0.76mi |
| 3109 NW 2nd Ter Unit 4-156 Pompano Beach, FL | 1.0 | 1.0 | 680 | $1,600 | $2.35 | 26d | 1 | 0.76mi |
| 145 NW 41st Ct #11 Deerfield Beach, FL | 3.0 | 1.5 | 1004 | $2,490 | $2.48 | 22d | 1 | 0.76mi |
| 624 NW 47th St Deerfield Beach, FL | 2.0 | 2.0 | 793 | $2,100 | $2.65 | 17d | 1 | 0.80mi |
| 616 NW 47th St Deerfield Beach, FL | 2.0 | 2.0 | 793 | $2,495 | $3.15 | 7d | 1 | 0.80mi |
| 4332 NW 1st Ter Deerfield Beach, FL | 3.0 | 2.0 | 1095 | $3,000 | $2.74 | 26d | 1 | 0.82mi |
| 4332 NW 1st Ter Deerfield Beach, FL | 3.0 | 2.0 | 1095 | $3,000 | $2.74 | 7d | 1 | 0.82mi |
| 551 NW 46th St Deerfield Beach, FL | 2.0 | 2.0 | 952 | $2,485 | $2.61 | 26d | 1 | 0.84mi |
| 300 NW 30th Ct #202 Pompano Beach, FL | 1.0 | 1.0 | 633 | $1,650 | $2.61 | 26d | 1 | 0.84mi |
| 4550 NW 18th Ave #606 Deerfield Beach, FL | 2.0 | 2.0 | 1070 | $2,300 | $2.15 | 1d | 1 | 0.86mi |
HOA detail condo
- Monthly dues
- $560 · $6,720/yr
- Assessments
- None detected in remarks — confirm with the listing agent.
Listing history 20 events
-
2026-06-21pricedays on market $145,000 Active 55 DOM
-
2026-06-18days on market $150,000 Active 52 DOM
-
2026-06-17days on market $150,000 Active 51 DOM
-
2026-06-16days on market $150,000 Active 50 DOM
-
2026-06-15days on market $150,000 Active 49 DOM
-
2026-06-13days on market $150,000 Active 47 DOM
-
2026-06-09days on market $150,000 Active 43 DOM
-
2026-06-08days on market $150,000 Active 42 DOM
-
2026-06-07days on market $150,000 Active 41 DOM
-
2026-06-04days on market $150,000 Active 38 DOM
-
2026-06-03days on market $150,000 Active 37 DOM
-
2026-06-02days on market $150,000 Active 36 DOM
-
2026-06-01days on market $150,000 Active 35 DOM
-
2026-05-31days on market $150,000 Active 34 DOM
-
2026-05-21price $150,000
-
2026-04-27$160,000 Active
-
2003-09-08soldstatus $80,000
-
2000-11-06soldstatus $44,900
-
1993-12-06soldstatus $43,000
-
1986-12-01soldstatus $46,000
ⓘ Source: listings_history table (triggers on properties + properties_extension) + one-shot
backfill from property_details.listing_events for pre-trigger history.
Tax reassessment forecast FL · Resets to sale price
- Current annual tax
- $3,520 · $293/mo
- Projected year-2 tax
- $3,520 · $293/mo
- Expected delta
- $0/yr ($0/mo · 0.0%)
ⓘ Screening estimate from a state-policy table — verify with the county assessor before closing.
Climate risk First Street
- Flood 1/10 Low FEMA zone X (unshaded) · 0% chance over 30 yrs
- Wildfire 1/10 Low
- Heat 9/10 Extreme 7 d/yr ≥107°F today · 26 d/yr by 30 yrs out
- Wind 10/10 Extreme 99% chance of damaging wind over 30 yrs
- Air quality 2/10 Low 1 unhealthy d/yr today · 3 by 30 yrs out
Nearby sold comps map
Loading sold comps map…
Walkable amenities ~0.75 mi
Loading nearby amenities…
Taxation est. · year 1
- Rental income
- $24,725
- − Mortgage interest
- −$8,122
- − Property taxes
- −$3,520
- − Insurance
- −$725
- − Repairs & maintenance
- −$1,978
- − Management
- −$1,978
- − HOA
- −$6,720
- − Depreciation
- −$4,218
- Taxable loss
- −$2,536
- Est. tax savings @ 24.0%
- +$609
- After-tax cash flow
- $52/yr
For passive investors: Depreciation is non-cash, so a rental often shows a tax loss while cash-flowing — sheltering income. Rental losses are passive: they offset passive income freely, and up to $25,000/yr can offset ordinary (W-2) income if you actively participate and your MAGI is under $100k (phasing out to $0 by $150k); unused losses carry forward. On sale, claimed depreciation is recaptured at up to 25%, and gains may owe capital-gains tax (a 1031 exchange can defer both). Figures are a year-1 estimate at your 24.0% rate — not tax advice; consult a CPA.
Schools (NCES district)
- District
- Broward
- NCES district ID
- 1200180
- Math proficiency
- 42% ▼ -18.00%
- Reading proficiency
- 53% ▼ -5.00%
- Median HH income
- $52,139
- Composite
- 40.88/100
- National rank
- #3621
- State rank
- #46 of 73 in FL
Livability — Deerfield Beach
- Score
- 75/100
- State rank
- #250
- US rank
- #3970
Category grades
Schools grade is shown separately in the Schools card above.
Census & demographics
- Census place
- Deerfield Beach, FL
- County
- Broward County · 1,963,430 people
- City population
- 61,449
- Metro
- Miami-Fort Lauderdale-Pompano Beach, FL
- Population (ZIP)
- 64,563
- Household income
- $71,301
- Rent vs Own
- Severe rent burden
- 2907.0
Population outlook (Broward County) Hauer SSP2
- Today (2025)
- 2,207,033 people
- By 2030
- 2,360,704 · +7.0%
- By 2040
- 2,661,208 · +20.6%
- By 2050
- 2,946,698 · +33.5%
- By 2075
- 3,602,273 · +63.2%
- By 2100
- 3,970,984 · +79.9%
Race, ethnicity, and origin ACS 2023
- Neighborhood character
- Highly diverse neighborhood (Simpson 0.75)
- Race & ethnicity
- White 34% Hispanic / Latino 27% Black 25% Two or more races 24% Asian 2%
- Hispanic origin (detail)
- Mexican 4% Puerto Rican 4% Cuban 4% Dominican 2%
- Common ancestry
- Hispanic 13% Estonian 10% Romanian 1%
- Foreign-born
- 43% · Canada, Jamaica, Dominican Republic
- Languages at home
- 45% English-only · Spanish 23% French/Haitian/Cajun 16% Other Indo-European 13%
Political lean MEDSL · Broward
- 2024 margin
- D (+17.0) · D 58.0% · R 41.0%
- 2008→2024 swing
- -17.8pp toward R · 2008: 34.7pp · 2024: 17.0pp
- All cycles
- 2024: D+17.0 2020: D+29.8 2016: D+35.0 2012: D+34.9 2008: D+34.7
Not yet ingested
- Civics
- —
Market trends
- HPI YoY
- ▼ -109.09%
- Current HPI
- 474.7007
- Rent YoY
- ▲ 1.75%
- Metro
- Miami-Fort Lauderdale-Pompano Beach, FL
- State GDP YoY
- ▲ 3.28%
- F500 in state
- 36
Industry mix (Fortune 500 HQ in FL)
| Industry | F500 HQs | Revenue |
|---|---|---|
| Industrial Technology | 2 | $29B |
|
||
| Insurance | 2 | $17B |
|
||
| Retail | 1 | $60B |
|
||
| Technology Distribution | 1 | $58B |
|
||
| Homebuilding | 1 | $35B |
|
||
| Technology Manufacturing | 1 | $35B |
|
||
Price history
+226.1% since first listed6 events — show timeline
- 2026-05-21 Price Changed $150,000 Beaches MLS
- 2026-04-27 Listed $160,000 Beaches MLS
- 2003-09-08 Sold (Public Records) $80,000 Public Records
- 2000-11-06 Sold (Public Records) $44,900 Public Records
- 1993-12-06 Sold (Public Records) $43,000 Public Records
- 1986-12-01 Sold (Public Records) $46,000 Public Records
Property tax history
+10.6%/yrLatest (2025): $3,520 · -4.6% YoY. Source: county tax records.
Cash-flow waterfall
monthlySold comps — $/sqft
last 12 mo · ≤1 miLoading sold comps…