 Duplex
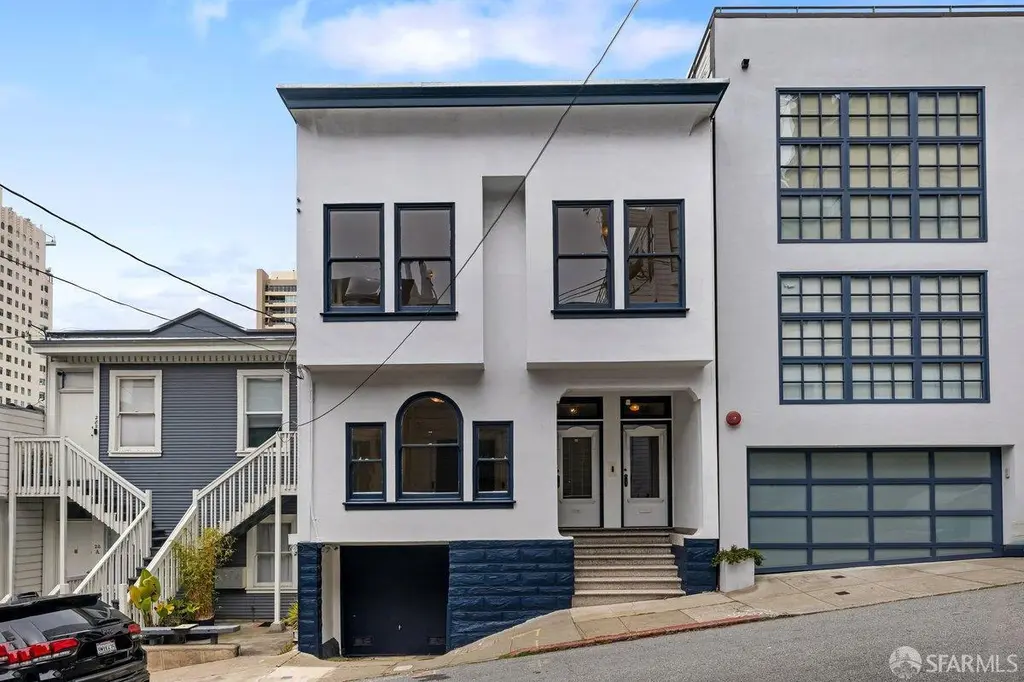
20-22 Glover St · San Francisco, CA
Flood risk 1/10 · Minimal
- FEMA flood zone
- X (unshaded)
- Chance of flooding over 30 yrs
- 0.0%
- Est. flood insurance / yr
- $507 – $1,088
Fire risk 1/10 · Minimal
- Est. fire insurance / yr
- $659 – $1,223
Heat risk 2/10 · Minimal
- Hot days now (above 79°F)
- 7 days/yr
- Hot days in 30 yrs
- 16 days/yr
Wind risk 1/10 · Minimal
- Chance of severe wind over 30 yrs
- —
Air-quality risk 8/10 · Major
- Unhealthy air days now
- 15 days/yr
- Unhealthy air days in 30 yrs
- 15 days/yr
Risk factors via First Street. Map © Google.
Why this score? — see what drove the C- grade
The composite is a weighted blend of 9 inputs, each scored 0–100. Each bar is that input's sub-score; the figure is the points it added to the 100-point composite (weight × sub-score).
- Cash flow +11.5/30.0
- ARV discount +11.5/15.0
- Appreciation +7.5/10.0
- Rent growth +5.0/5.0
- Schools +5.0/10.0
- Livability +3.8/5.0
- DSCR +3.4/10.0
- Condition / age +2.5/5.0
- 1% rule +2.2/10.0
$1,495,000
🖨 Deal sheet 📄 Offer letter ✓ Due diligence
Multi-family units
County records classify this as Multi-Family (2-4 Unit). Listing-text estimate: 2 units. confirmed
Listing remarks
20-22 Glover Street is a rare, vacant duplex in the heart of Russian Hill, blending classic San Francisco charm, with exciting upside in an unbeatable location. Held by the same family for over 100 years, this is a special opportunity to take the reins of a truly timeless property. The upper flat offers a 2-bedroom layout with a split bath, and a formal dining room that could serve as a third bedroom. The lower unit features a 1-bedroom with a split bath, and a formal dining room that also could function as a second bedroom. Each unit includes a light-filled, spacious living room with decorative fireplace, and its own laundry hook-ups for added convenience. While the property could be occup
Key facts
- Formal dining room
- Large garage
- Vacant duplex
Tags
Property features AI
Finance
- Financial info: Two total units; currently both units listed as vacant
- HOA & community: No association fee
Exterior
- Parking: Attached, covered tandem garage parking; 2 covered garage spaces (tandem)
- Utilities: Common area meter for some utilities; Gas on separate meter; Electric on separate meter; Water on separate meter and public water; Public sewer
- Home design: Residential income duplex; Two flat units (upper and lower); Built in 1909; Property in original condition
- Construction: Year built 1909
- Exterior features: Yard space
Interior
- Kitchen: Free-standing gas oven; Free-standing gas range; Free-standing refrigerator
- Bedrooms: Total of 3 bedrooms (across units; some rooms are described as flexible living/dining spaces that could serve as additional bedrooms)
- Flooring: Carpet; Tile; Vinyl; Wood
- Bathrooms: 2 full bathrooms
- Heating & cooling: Natural gas heating; Wall furnace
- Interior features: Wall furnace heating; Natural gas heating; In-unit laundry; Additional laundry/utility space; Carpet, tile, vinyl and wood flooring; Free-standing gas oven and range; Free-standing refrigerator
- Laundry & utility: Laundry in unit; Separate/common area utility meters
Neighborhood map
What this means for you Summary
Snapshot
- This is a 1×2bd/1.0ba + 1×1bd/1.0ba units multifamily listed at $1.50M.
Deal economics
- At list price, monthly cash flow is $-496 ($-6k/yr) — negative. Per door: $-248/mo.
- To cash-flow at today's rent, offer at most $1.41M (5.9% below list).
- To meet the 1% rule (rent ≥ 1% of price), the offer needs to be $1.07M (28.2% below list).
- Recommended offer: $1.07M (28.2% below list) — sets the bar for 1% rule.
- Cap rate 5.9% vs local median 2.1% in San Francisco — top-decile yield for the area; either an underpriced asset or a hidden risk that comps aren't pricing in. Stress-test before assuming the spread holds.
Location & tenants
- Location reads 76/100 on livability (#90 in CA, #3,143 nationally) — a middle-class / working-renter tenant base. Strengths: amenities A+, commute A+, employment A+; Watch: crime F, cost of living F.
- San Francisco Unified (urban): math 50% / reading 56% proficiency, ranked #322 of 1,400 in CA (top 23%) — acceptable for families but not a draw, mixed tenant base, ~2y average lease.
- Market conditions: Rents rising fast (+15.6%/yr); 155 active listings in the ZIP; 1 comparable units currently listed for rent nearby; solid renter incomes; 750 units permitted in San Francisco County in 2024 (688 in 5+ unit buildings).
- At $10,731/mo this rent would consume 121% of the median local household income ($106k/yr) (locally 5272% of renters already pay >50% of income on rent) — very limited rent-growth headroom before tenants either downsize or default.
Forward outlook
- In year one you build about $85k of equity ($10k loan paydown + $75k appreciation (5.0% local appreciation)).
- San Francisco County population projected at +39% by 2050 — long-run rental-demand tailwind backs the buy-and-hold thesis.
- By year 2, paydown + projected appreciation supports a ~$137k cash-out refi (75% LTV) — recoverable capital for the next deal without selling this one.
Negotiation context
- It's been on market 15 days — a 2% lower offer ($1.47M) is reasonable based on typical stale-listing flexibility.
Risks & watch-outs
- Watch-outs: built in 1909 — expect roof / HVAC / electrical / plumbing capex.
Questions for the listing agent
- What do current leases actually rent for vs. the listed asking? Can we see a recent rent roll and the last 12 months of T-12 income?
- Can we see the unit-by-unit rent roll, current vacancy, and any below-market leases? What's the average tenancy length?
- What capital expenditures (roof, boiler, parking lot, exteriors) have been made in the last 5 years, and what's planned in the next 2?
- Built in 1909 — when were the roof, HVAC, electrical panel, plumbing, and water heater last replaced?
- Is there a deadline driving the sale (1031 exchange, divorce, estate, relocation)? That informs how much negotiation room exists.
- Schools are B-rated — typically a magnet for longer-tenancy family renters. What's the average tenant stay here, and is there a school-zone premium baked into asking?
- Crime grade is F in this area — have there been break-ins, vandalism, or insurance claims at this property in the last 3 years? What carrier currently insures it and at what premium?
- What's the average days-on-market for RENTAL listings here right now (not sales)? A rising rental-DOM trend means longer vacancies and softer asking-rent achievability than the comps imply.
- What's the recent tenant-quality profile in this submarket — average credit score on applications, eviction rate, late-payment / NSF rate, and stable-employment percentage? A property-management company in the area should have these aggregated.
- How much new apartment / multifamily construction is in the pipeline within 1–3 miles? Heavy new supply (>2% of stock underway) typically softens rents 12–24 months out; light construction supports rent growth.
Investment metrics
- 1% rule
- 0.72% ✗
- Cap rate
- 5.90%
- Cash-on-cash
- -1.42%
- DSCR
- 0.94
- GRM
- 11.6
CMA / ARV
- ARV (median comp)
- $1,639,001
- List price
- $1,495,000
- Delta
- -8.79%
- Verdict
- FAIR
- Comps
- 20 within 1.0 mi
Show comp detail 7 sales within ~0.75 mi
| Address | Dist | Beds/Ba | Sqft | Sold | Price | $/sf | Match |
|---|---|---|---|---|---|---|---|
| 863-865 Greenwich St | 0.31mi | 5/— (-1) | 2,162 (+1%) | 7mo | $1,200,000 | $555 | 73 |
| 1519-1521 Jackson St | 0.32mi | 6/3.0 | 2,046 (-4%) | 6mo | $1,725,000 | $843 | 69 |
| 58-60 N Valparaiso St | 0.30mi | 6/— | 1,924 (-10%) | 12mo | $1,100,000 | $572 | 59 |
| 1316-1318 Powell St | 0.33mi | 6/2.0 | 2,324 (+9%) | 19mo | $1,200,000 | $516 | 54 |
| 1165-1167 Kearny St | 0.56mi | 6/3.0 | 2,008 (-6%) | 13mo | $958,000 | $477 | 49 |
| 24 Windsor Pl | 0.61mi | 5/4.0 (-1) | 2,335 (+9%) | 0mo | $1,468,000 | $629 | 43 |
| 1121-1123 Montgomery St | 0.64mi | 7/3.0 (+1) | 2,230 (+4%) | 18mo | $1,730,000 | $776 | 39 |
Match score weights: distance 35% · size 25% · config 20% · recency 20%. Top-matched comps best support the ARV.
Projected returns pro-forma
5.02% appreciation · 8.0% rent growth · sell at horizon
- IRR
- 13.6%
- Equity multiple
- 1.89×
- Total profit
- $370,871
- Equity at exit
- $849,134
- IRR
- 16.1%
- Equity multiple
- 4.06×
- Total profit
- $1,282,661
- Equity at exit
- $1,467,093
Cash invested: $418,600 (down + closing). Projections, not guarantees.
Landlord ↔ Tenant lean methodology
- Overall (CITY)
- 0 Strongly Tenant-Friendly
- State California
- 18 Strongly Tenant-Friendly · D+13
- County
- — inherits STATE
- City San Francisco
- 0 Strongly Tenant-Friendly · D+57
ZIP-level market 94109
- Home prices YoY
- 2.9%
- Rents YoY
- 15.6%
- Active inventory
- 155
- Price-to-rent
- 22.7×
Monthly cashflow live
- Estimated rent
- $10,731 high interval (Pro) →
- Mortgage (P&I)
- −$7,840
- Tax from tax record
- −$510 /mo · $6,122/yr
- Insurance
- −$623
- HOA
- −$0
- Vacancy / Maint / Mgmt
- −$2,254
- Net cashflow
- $-496
Break-even live
2-unit breakdown (identical units grouped — click to expand)
| Units | Beds | Baths | Est. rent |
|---|---|---|---|
| 1× unit | 2 | 1 | $5,488 |
| 1× unit | 1 | 1 | $5,243 |
| Total (2 units) | $10,731 | ||
UW: 25.0% down · 7.5% · 30yr · 1.5% tax · 5.0% vac · 8.0% maint · 8.0% mgmt
Financing live
Cash to close
- Down payment
- $373,750
- Closing costs
- $44,850
- Reserves months
- —
- Total cash needed
- —
Loan-product check · same deal, 3 products live
Conventional
25% down · 7.5% · 30yr
- Down + closing
- —
- Monthly P&I
- —
- Monthly cashflow
- —
- DSCR
- —
- Eligible?
- —
Personal DTI + credit; lowest rate.
DSCR
20% down · 8.5% · 30yr
- Down + closing
- —
- Monthly P&I
- —
- Monthly cashflow
- —
- DSCR
- —
- Eligible?
- —
No personal income docs; deal must DSCR.
Hard money
10% down · 12.0% · 12mo
- Down + closing
- —
- Monthly P&I
- —
- Monthly cashflow
- —
- DSCR
- —
- Eligible?
- —
Short-term bridge; refi at stabilization.
Rent comps 1 comps
| Address | Beds | Baths | Sqft | Rent | $/sqft | DOM | Units | Dist |
|---|---|---|---|---|---|---|---|---|
| 2256B Van Ness Ave San Francisco, CA | 5.0 | 2.0 | 1990 | $11,995 | $6.03 | 24d | 1 | 0.40mi |
Listing history 1 events
-
2026-05-04$1,495,000 Active 1436-char remark
ⓘ Source: listings_history table (triggers on properties + properties_extension) + one-shot
backfill from property_details.listing_events for pre-trigger history.
Tax reassessment forecast CA · Resets to sale price
- Current annual tax
- $6,122 · $510/mo
- Projected year-2 tax
- $11,362 · $947/mo
- Expected delta
- +$5,240/yr (+$437/mo · 85.6%)
ⓘ Screening estimate from a state-policy table — verify with the county assessor before closing.
Climate risk First Street
- Flood 1/10 Low FEMA zone X (unshaded) · 0% chance over 30 yrs
- Wildfire 1/10 Low
- Heat 2/10 Low 7 d/yr ≥79°F today · 16 d/yr by 30 yrs out
- Wind 1/10 Low
- Air quality 8/10 Severe 15 unhealthy d/yr today · 15 by 30 yrs out
Nearby sold comps map
Loading sold comps map…
Walkable amenities ~0.75 mi
Loading nearby amenities…
Taxation est. · year 1
- Rental income
- $128,772
- − Mortgage interest
- −$83,743
- − Property taxes
- −$6,122
- − Insurance
- −$7,475
- − Repairs & maintenance
- −$10,302
- − Management
- −$10,302
- − Depreciation
- −$43,491
- Taxable loss
- −$32,663
- Est. tax savings @ 24.0%
- +$7,839
- After-tax cash flow
- $1,892/yr
For passive investors: Depreciation is non-cash, so a rental often shows a tax loss while cash-flowing — sheltering income. Rental losses are passive: they offset passive income freely, and up to $25,000/yr can offset ordinary (W-2) income if you actively participate and your MAGI is under $100k (phasing out to $0 by $150k); unused losses carry forward. On sale, claimed depreciation is recaptured at up to 25%, and gains may owe capital-gains tax (a 1031 exchange can defer both). Figures are a year-1 estimate at your 24.0% rate — not tax advice; consult a CPA.
Schools (NCES district)
- District
- San Francisco Unified
- NCES district ID
- 0634410
- Math proficiency
- 50% ▬ 0.00%
- Reading proficiency
- 56% ▲ 1.00%
- Median HH income
- $81,249
- Composite
- 50.14/100
- National rank
- #4088
- State rank
- #322 of 1400 in CA
Livability — San Francisco
- Score
- 76/100
- State rank
- #90
- US rank
- #3143
Category grades
Schools grade is shown separately in the Schools card above.
Census & demographics
- Census place
- San Francisco, CA
- County
- San Francisco County · 827,552 people
- City population
- 827,552
- Metro
- San Francisco-Oakland-Berkeley, CA
- Population (ZIP)
- 54,553
- Household income
- $106,018
- Rent vs Own
- Severe rent burden
- 5272.0
Population outlook (San Francisco County) Hauer SSP2
- Today (2025)
- 1,030,936 people
- By 2030
- 1,110,409 · +7.7%
- By 2040
- 1,270,010 · +23.2%
- By 2050
- 1,435,001 · +39.2%
- By 2075
- 1,779,074 · +72.6%
- By 2100
- 1,966,767 · +90.8%
Race, ethnicity, and origin ACS 2023
- Neighborhood character
- Diverse neighborhood (Simpson 0.66)
- Race & ethnicity
- White 50% Asian 27% Hispanic / Latino 13% Two or more races 10% Black 4%
- Hispanic origin (detail)
- Mexican 7% Puerto Rican 1%
- Common ancestry
- Lithuanian 3% Italian 3% Romanian 2%
- Foreign-born
- 31% · China, Canada, Vietnam
- Languages at home
- 64% English-only · Chinese 10% Spanish 7% Other Asian/Pacific 4%
Political lean MEDSL · San Francisco
- 2024 margin
- Solid D (+64.8) · D 80.3% · R 15.5% · Other 4.1%
- 2008→2024 swing
- -5.7pp toward R · 2008: 70.5pp · 2024: 64.8pp
- All cycles
- 2024: D+64.8 2020: D+72.5 2016: D+76.1 2012: D+70.2 2008: D+70.5
Not yet ingested
- Civics
- —
Market trends
- HPI YoY
- ▲ 5.02%
- Current HPI
- 175.8886
- Rent YoY
- ▲ 15.60%
- Metro
- San Francisco-Oakland-Berkeley, CA
- State GDP YoY
- ▲ 3.21%
- F500 in state
- 116
Industry mix (Fortune 500 HQ in CA)
| Industry | F500 HQs | Revenue |
|---|---|---|
| Technology | 27 | $1,492B |
|
||
| Financial Services | 3 | $174B |
|
||
| Retail | 3 | $44B |
|
||
| Insurance | 3 | $26B |
|
||
| Media / Entertainment | 2 | $115B |
|
||
| Pharmaceuticals / Biotech | 2 | $62B |
|
||
Price history
+33.8% since first listed3 events — show timeline
- 2026-06-01 Sold (MLS) $2,000,000 San Francisco MLS
- 2026-05-19 Pending — San Francisco MLS
- 2026-05-04 Listed $1,495,000 San Francisco MLS
Property tax history
+2.4%/yrLatest (2025): $6,122 · +3.9% YoY. Source: county tax records.
Cash-flow waterfall
monthlySold comps — $/sqft
last 12 mo · ≤1 miLoading sold comps…