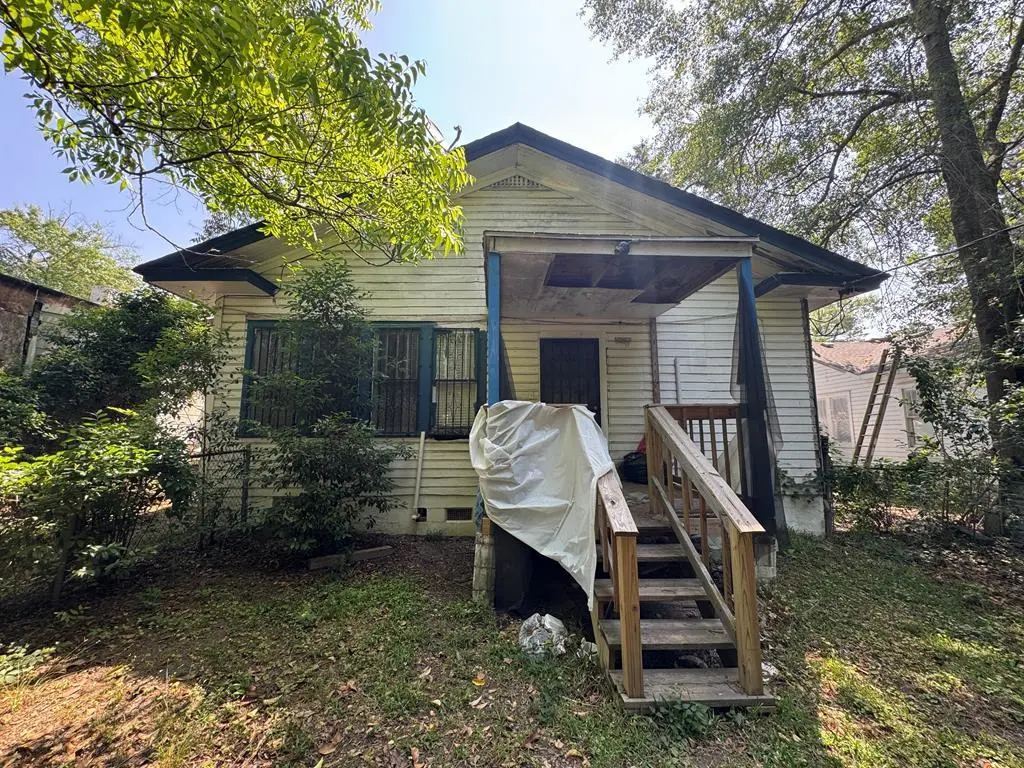
305 Jeff St · Dothan, AL
Flood risk 1/10 · Minimal
- FEMA flood zone
- X (unshaded)
- Chance of flooding over 30 yrs
- 0.0%
- Est. flood insurance / yr
- $507 – $1,088
Fire risk 1/10 · Minimal
- Est. fire insurance / yr
- $916 – $1,700
Heat risk 8/10 · Major
- Hot days now (above 107°F)
- 7 days/yr
- Hot days in 30 yrs
- 19 days/yr
Wind risk 8/10 · Major
- Chance of severe wind over 30 yrs
- 99.0%
Air-quality risk 4/10 · Minor
- Unhealthy air days now
- 5 days/yr
- Unhealthy air days in 30 yrs
- 6 days/yr
Risk factors via First Street. Map © Google.
Why this score? — see what drove the D grade
The composite is a weighted blend of 9 inputs, each scored 0–100. Each bar is that input's sub-score; the figure is the points it added to the 100-point composite (weight × sub-score).
- Cash flow +15.0/30.0
- ARV discount +7.5/15.0
- 1% rule +5.0/10.0
- DSCR +5.0/10.0
- Livability +3.2/5.0
- Rent growth +2.5/5.0
- Schools +2.5/10.0
- Condition / age +2.5/5.0
- Appreciation +0.0/10.0
$27,000
🖨 Deal sheet 📄 Offer letter ✓ Due diligence
Listing remarks
Spacious older home featuring multiple living areas, large bedrooms, and a covered screened front porch. The property includes a large backyard with mature trees, chain-link fencing, and a storage shed. Interior features include an oversized bathroom with tub/shower combo, laundry area, and kitchen with ample cabinet space. Several rooms wood-style flooring, and decorative archways between living spaces. Exterior features include front and rear ramps, covered rear entry, and off-street parking. Property is being sold as-is.
Key facts
- Charm and privacy
- Spacious homesite
- 6,969 sq ft lot
Tags
Property features AI
Exterior
- Parking: No garage
- Utilities: Public water; Public sewer
- Home design: Single-family residence; One level
- Construction: Wood siding
- Exterior features: Covered porch/patio
Interior
- Kitchen: Cooktop; Range hood; Refrigerator
- Flooring: Wood floors
- Bathrooms: 1 full bathroom
- Interior features: Wood-framed windows; No fireplace
Neighborhood map
What this means for you Summary
Snapshot
- This is a 3-bed/1.0-bath single-family listed at $27k.
Deal economics
- At list price, monthly cash flow is $753 ($9k/yr) — positive.
- The deal already cash-flows at list — no discount required.
- Meets the 1% rule at list price ($1k rent vs $27k).
- Recommended offer: $26k (3.0% below list) — sets the bar for market timing.
- Cap rate 39.8% vs local median 4.4% in Dothan — top-decile yield for the area; either an underpriced asset or a hidden risk that comps aren't pricing in. Stress-test before assuming the spread holds.
Location & tenants
- Location reads 64/100 on livability (#146 in AL) — a middle-class / working-renter tenant base. Strengths: cost of living A+, housing A+, health & safety A+; Watch: employment D, crime F, amenities F.
- Dothan City (urban): math 19% / reading 39% proficiency, ranked #73 of 129 in AL (top 57%) — low school quality limits family demand, transient renter base, plan for 1-2y turnover.
- Zoned schools: Girard Intermediate School (math 2% / reading 20%, grade F, #560 of 627 statewide, top 90%, 321 students, 95% FRL); Dothan High School (math 16% / reading 24%, grade F, #163 of 305 statewide, top 54%, 1,454 students, 70% FRL) — zoned schools average 82% FRL vs 59% district-wide (23 pts higher); higher-poverty schools than district average — tighter screening recommended.
- Zoned-school proficiency averages 16% at this address vs 29% district-wide (-14 pts) — the specific schools serving this property underperform the Dothan City average; the district grade overstates school quality for this exact location.
- Market conditions: 233 active listings in the ZIP; 9 comparable units currently listed for rent nearby; rentals lingering (median 44d on market — plan ~5-8 weeks vacancy on turnover, expect pricing pressure); 100% of comp listings sitting > 30 days — soft ceiling on asking rent; 463 units permitted in Houston County in 2024 (96 in 5+ unit buildings).
Forward outlook
- Local home prices are declining (-3.0%/yr); year-one equity from $187 of loan paydown is wiped out by about $810 of value loss. Plan a longer hold.
- Houston County population projected at +7% by 2050 — modest demand growth; plan on rents tracking national, not racing it.
- At projected returns (-3.0% appreciation + 3.0% rent growth), your $8k cash investment doubles in ~1 year — after that, you're playing with house money.
Negotiation context
- It's been on market 34 days — a 3% lower offer ($26k) is reasonable based on typical stale-listing flexibility.
- 2 sale attempts; this cycle's ask has dropped $20k (42%) from the opening price — seller is motivated, your offer sets the floor, not the list.
Risks & watch-outs
- Watch-outs: built in 1945 — expect roof / HVAC / electrical / plumbing capex.
- Climate carrying-cost: severe wind risk, 99% chance of damaging wind over 30y; extreme-heat days projected 7→19/yr by 2055 (HVAC capex compounding) — expect insurance premiums to compound above CPI over the hold.
Questions for the listing agent
- It's been on market 34 days. Have you received any prior offers? Is the seller open to a 3% concession, seller financing, or rate buy-down credit?
- Built in 1945 — when were the roof, HVAC, electrical panel, plumbing, and water heater last replaced?
- Is there a deadline driving the sale (1031 exchange, divorce, estate, relocation)? That informs how much negotiation room exists.
- Schools are D-rated, which usually means shorter tenancies and higher turnover. Who's the typical renter profile here, and what's been the actual vacancy rate?
- Crime grade is F in this area — have there been break-ins, vandalism, or insurance claims at this property in the last 3 years? What carrier currently insures it and at what premium?
- The area grade is low — what's the realistic commute time and amenity access for the typical tenant pool here? Any planned neighborhood developments (good or bad) we should know about?
- What's the average days-on-market for RENTAL listings here right now (not sales)? A rising rental-DOM trend means longer vacancies and softer asking-rent achievability than the comps imply.
- What's the recent tenant-quality profile in this submarket — average credit score on applications, eviction rate, late-payment / NSF rate, and stable-employment percentage? A property-management company in the area should have these aggregated.
- How much new for-sale + rental construction is in the pipeline within 1–3 miles? Heavy new supply typically softens prices + rents 12–24 months out; constrained supply supports both.
Investment metrics
- 1% rule
- 4.38% ✓
- Cap rate
- 39.78%
- Cash-on-cash
- 119.59%
- DSCR
- 6.32
- GRM
- 1.9
CMA / ARV
- ARV (median comp)
- $84,137
- List price
- $27,000
- Delta
- -67.91%
- Verdict
- UNDERPRICED
- Comps
- 20 within 1.0 mi
Show comp detail 9 sales within ~0.75 mi
| Address | Dist | Beds/Ba | Sqft | Sold | Price | $/sf | Match |
|---|---|---|---|---|---|---|---|
| 503 W Powell St | 0.40mi | 3/1.0 | 1,260 (-2%) | 5mo | $55,000 | $44 | 73 |
| 607 Arlington Ave | 0.59mi | 4/1.0 (+1) | 1,278 (-1%) | 1mo | $55,000 | $43 | 65 |
| 1307 Osceola St | 0.36mi | 3/1.5 | 1,392 (+8%) | 8mo | $164,000 | $118 | 62 |
| 610 Catalpa Ave | 0.46mi | 3/2.0 | 1,296 (+0%) | 21mo | $61,148 | $47 | 57 |
| 1304 W Powell St | 0.40mi | 3/2.0 | 1,360 (+5%) | 14mo | $167,000 | $123 | 56 |
| 507 W Newton St | 0.38mi | 3/1.5 | 1,357 (+5%) | 20mo | $120,000 | $88 | 55 |
| 603 S Edgewood Dr | 0.56mi | 3/1.0 | 1,190 (-8%) | 22mo | $80,000 | $67 | 43 |
| 706 Westmead St A & B St | 0.58mi | 2/2.0 (-1) | 1,102 (-15%) | 0mo | $20,000 | $18 | 39 |
| 706 S Edgewood Dr | 0.67mi | 3/1.0 | 1,448 (+12%) | 20mo | $60,000 | $41 | 32 |
Match score weights: distance 35% · size 25% · config 20% · recency 20%. Top-matched comps best support the ARV.
Projected returns pro-forma
-3.0% appreciation · 3.0% rent growth · sell at horizon
- IRR
- —
- Equity multiple
- 6.77×
- Total profit
- $43,626
- Equity at exit
- $4,026
- IRR
- —
- Equity multiple
- 14.21×
- Total profit
- $99,839
- Equity at exit
- $2,334
Cash invested: $7,560 (down + closing). Projections, not guarantees.
Landlord ↔ Tenant lean methodology
- Overall (STATE)
- 90 Strongly Landlord-Friendly
- State Alabama
- 90 Strongly Landlord-Friendly · R+15
- County
- — inherits STATE
- City
- — inherits STATE
ZIP-level market 36303
- Active inventory
- 233
- Price-to-rent
- 1.9×
Monthly cashflow live
- Estimated rent
- $1,184 high interval (Pro) →
- Mortgage (P&I)
- −$142
- Tax from tax record
- −$29 /mo · $347/yr
- Insurance
- −$11
- HOA
- −$0
- Vacancy / Maint / Mgmt
- −$249
- Net cashflow
- $753
Break-even live
UW: 25.0% down · 7.5% · 30yr · 1.5% tax · 5.0% vac · 8.0% maint · 8.0% mgmt
Financing live
Cash to close
- Down payment
- $6,750
- Closing costs
- $810
- Reserves months
- —
- Total cash needed
- —
Loan-product check · same deal, 3 products live
Conventional
25% down · 7.5% · 30yr
- Down + closing
- —
- Monthly P&I
- —
- Monthly cashflow
- —
- DSCR
- —
- Eligible?
- —
Personal DTI + credit; lowest rate.
DSCR
20% down · 8.5% · 30yr
- Down + closing
- —
- Monthly P&I
- —
- Monthly cashflow
- —
- DSCR
- —
- Eligible?
- —
No personal income docs; deal must DSCR.
Hard money
10% down · 12.0% · 12mo
- Down + closing
- —
- Monthly P&I
- —
- Monthly cashflow
- —
- DSCR
- —
- Eligible?
- —
Short-term bridge; refi at stabilization.
Rent comps 9 comps
| Address | Beds | Baths | Sqft | Rent | $/sqft | DOM | Units | Dist |
|---|---|---|---|---|---|---|---|---|
| 706 Chinook St Dothan, AL | 3.0 | 2.0 | 1214 | $850 | $0.70 | 43d | 1 | 0.38mi |
| 403 Holly Ln Dothan, AL | 2.0 | 1.0–2.0 | 1175 | $1,350 | $1.15 | 43d | 4 | 0.55mi |
| 1658 W Main St Dothan, AL | 2.0 | 1.0 | 1000 | $875 | $0.88 | 43d | 1 | 0.56mi |
| 1308 Sioux St Dothan, AL | 2.0 | 2.0 | 1004 | $850 | $0.85 | 43d | 1 | 0.64mi |
| 310 W Lafayette St Dothan, AL | 3.0 | 1.0 | 1459 | $995 | $0.68 | 43d | 1 | 0.90mi |
| 193 S Saint Andrews St Dothan, AL | 2.0 | 2.0 | 1100 | $2,100 | $1.91 | 43d | 1 | 1.03mi |
| 1809 Haisten Dr Dothan, AL | 3.0 | 2.0 | 1345 | $1,300 | $0.97 | 43d | 1 | 1.34mi |
| 803 E Adams St Dothan, AL | 4.0 | 2.0 | 1564 | $1,350 | $0.86 | 43d | 1 | 1.35mi |
| 806 S Ussery St Dothan, AL | 3.0 | 1.0 | 934 | $895 | $0.96 | 43d | 1 | 1.49mi |
Listing history 18 events
-
2026-06-19days on market $27,000 Active 34 DOM
-
2026-06-18days on market $27,000 Active 33 DOM
-
2026-06-17days on market $27,000 Active 32 DOM
-
2026-06-16pricedays on market $27,000 Active 31 DOM
-
2026-06-15days on market $29,900 Active 30 DOM
-
2026-06-14days on market $29,900 Active 28 DOM
-
2026-06-12pricedays on market $29,900 Active 27 DOM
-
2026-06-09days on market $34,900 Active 24 DOM
-
2026-06-08days on market $34,900 Active 23 DOM
-
2026-06-07days on market $34,900 Active 22 DOM
-
2026-06-05days on market $34,900 Active 19 DOM
-
2026-06-03pricedays on market $34,900 Active 18 DOM
-
2026-06-03price $39,900 Active 17 DOM
-
2026-06-02days on market $44,900 Active 17 DOM
-
2026-06-01days on market $44,900 Active 16 DOM
-
2026-05-31days on market $44,900 Active 15 DOM
-
2026-05-30days on market $44,900 Active 14 DOM
-
2026-05-15$46,800 Active 781-char remark
ⓘ Source: listings_history table (triggers on properties + properties_extension) + one-shot
backfill from property_details.listing_events for pre-trigger history.
Tax reassessment forecast AL · Resets to sale price
- Current annual tax
- $347 · $29/mo
- Projected year-2 tax
- $347 · $29/mo
- Expected delta
- $0/yr ($0/mo · 0.0%)
ⓘ Screening estimate from a state-policy table — verify with the county assessor before closing.
Climate risk First Street
- Flood 1/10 Low FEMA zone X (unshaded) · 0% chance over 30 yrs
- Wildfire 1/10 Low
- Heat 8/10 Severe 7 d/yr ≥107°F today · 19 d/yr by 30 yrs out
- Wind 8/10 Severe 99% chance of damaging wind over 30 yrs
- Air quality 4/10 Moderate 5 unhealthy d/yr today · 6 by 30 yrs out
Nearby sold comps map
Loading sold comps map…
Walkable amenities ~0.75 mi
Loading nearby amenities…
Taxation est. · year 1
- Rental income
- $14,205
- − Mortgage interest
- −$1,512
- − Property taxes
- −$347
- − Insurance
- −$135
- − Repairs & maintenance
- −$1,136
- − Management
- −$1,136
- − Depreciation
- −$785
- Taxable income
- $9,153
- Est. tax owed @ 24.0%
- −$2,197
- After-tax cash flow
- $6,844/yr
For passive investors: Depreciation is non-cash, so a rental often shows a tax loss while cash-flowing — sheltering income. Rental losses are passive: they offset passive income freely, and up to $25,000/yr can offset ordinary (W-2) income if you actively participate and your MAGI is under $100k (phasing out to $0 by $150k); unused losses carry forward. On sale, claimed depreciation is recaptured at up to 25%, and gains may owe capital-gains tax (a 1031 exchange can defer both). Figures are a year-1 estimate at your 24.0% rate — not tax advice; consult a CPA.
Schools (NCES district)
- District
- Dothan City
- NCES district ID
- 0101230
- Math proficiency
- 19% ▼ -23.00%
- Reading proficiency
- 39% ▼ -3.00%
- Median HH income
- $42,279
- Composite
- 24.56/100
- National rank
- #7640
- State rank
- #73 of 129 in AL
Livability — Dothan
- Score
- 64/100
- State rank
- #146
- US rank
- #13662
Category grades
Schools grade is shown separately in the Schools card above.
Census & demographics
- Census place
- Dothan, AL
- County
- Houston County · 47,783 people
- City population
- 47,783
- Metro
- Dothan, AL
- Population (ZIP)
- 30,173
- Household income
- $54,147
- Rent vs Own
- Severe rent burden
- 1156.0
Population outlook (Houston County) Hauer SSP2
- Today (2025)
- 110,280 people
- By 2030
- 112,668 · +2.2%
- By 2040
- 116,149 · +5.3%
- By 2050
- 117,805 · +6.8%
- By 2075
- 118,577 · +7.5%
- By 2100
- 110,940 · +0.6%
Race, ethnicity, and origin ACS 2023
- Neighborhood character
- Diverse neighborhood (Simpson 0.58)
- Race & ethnicity
- White 50% Black 41% Two or more races 5% Hispanic / Latino 4% Asian 1%
- Common ancestry
- Italian 2% Slovak 2% Lithuanian 1%
- Foreign-born
- 3% · Canada
- Languages at home
- 95% English-only · Spanish 3%
Political lean MEDSL · Houston
- 2024 margin
- Solid R (+47.8) · D 25.7% · R 73.5%
- 2008→2024 swing
- -7.0pp toward R · 2008: -40.8pp · 2024: -47.8pp
- All cycles
- 2024: R+47.8 2020: R+42.7 2016: R+47.6 2012: R+40.3 2008: R+40.8
Not yet ingested
- Civics
- —
Market trends
- HPI YoY
- ▼ -121.35%
- Current HPI
- 182.6482
- Rent YoY
- —
- Metro
- Dothan, AL
- State GDP YoY
- ▲ 2.94%
- F500 in state
- 4
Industry mix (Fortune 500 HQ in AL)
| Industry | F500 HQs | Revenue |
|---|---|---|
| Financial Services | 1 | $8B |
|
||
| Healthcare | 1 | $5B |
|
||
Price history
-42.3% since first listed7 events — show timeline
- 2026-06-16 Price Changed $27,000 SAMLS
- 2026-06-09 Price Changed $29,900 SAMLS
- 2026-06-03 Price Changed $34,900 SAMLS
- 2026-06-02 Price Changed $39,900 SAMLS
- 2026-05-20 Relisted — SAMLS
- 2026-05-20 Price Changed $44,900 SAMLS
- 2026-05-15 Listed $46,800 SAMLS
Property tax history
+6.3%/yrLatest (2025): $347 · +3.0% YoY. Source: county tax records.
Cash-flow waterfall
monthlySold comps — $/sqft
last 12 mo · ≤1 miLoading sold comps…