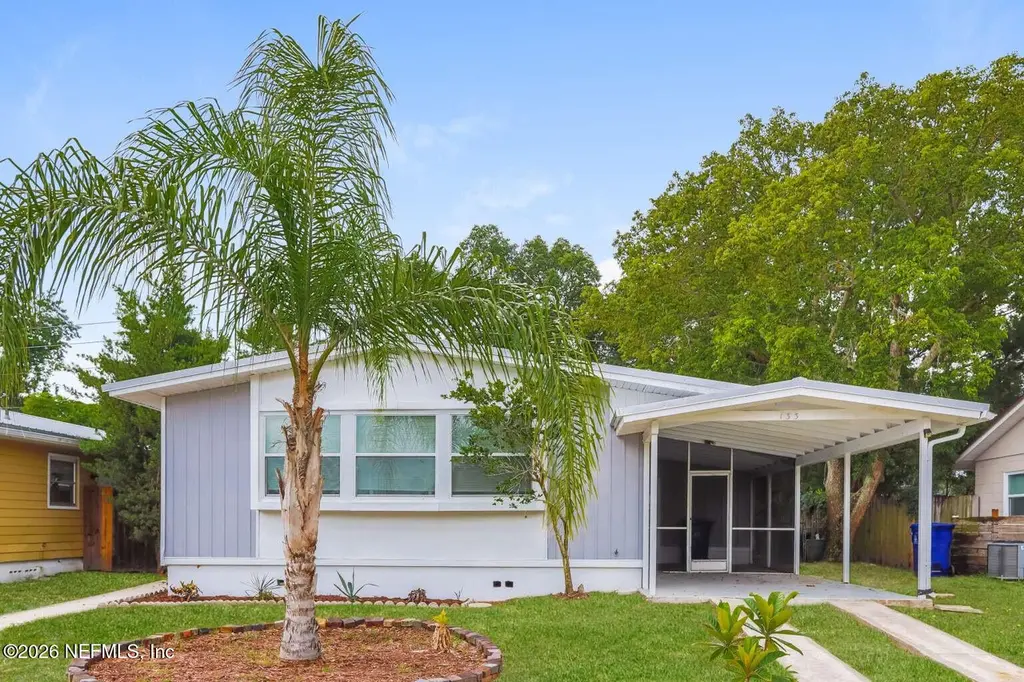
133 Andora St · St. Augustine Shores, FL
Flood risk 1/10 · Minimal
- FEMA flood zone
- X (unshaded)
- Chance of flooding over 30 yrs
- 0.0%
- Est. flood insurance / yr
- $507 – $1,088
Fire risk 3/10 · Minor
- Est. fire insurance / yr
- $947 – $1,759
Heat risk 10/10 · Severe
- Hot days now (above 106°F)
- 7 days/yr
- Hot days in 30 yrs
- 22 days/yr
Wind risk 10/10 · Severe
- Chance of severe wind over 30 yrs
- 99.0%
Air-quality risk 3/10 · Minor
- Unhealthy air days now
- 3 days/yr
- Unhealthy air days in 30 yrs
- 3 days/yr
Risk factors via First Street. Map © Google.
Why this score? — see what drove the C grade
The composite is a weighted blend of 9 inputs, each scored 0–100. Each bar is that input's sub-score; the figure is the points it added to the 100-point composite (weight × sub-score).
- Cash flow +18.7/30.0
- ARV discount +15.0/15.0
- Schools +6.4/10.0
- DSCR +5.9/10.0
- 1% rule +5.2/10.0
- Rent growth +2.7/5.0
- Livability +2.5/5.0
- Condition / age +2.5/5.0
- Appreciation +0.0/10.0
$199,000
🖨 Deal sheet 📄 Offer letter ✓ Due diligence
Listing remarks
One or more photos have been virtually staged. Welcome to this 3-bedroom, 2-bathroom single-family home located in beautiful St. Augustine. Step inside to a bright and spacious layout designed for both comfort and functionality. The kitchen offers energy-efficient appliances, ample cabinet space, and recent updates, including a new dishwasher and range--making it ideal for everyday cooking and entertaining. Each bedroom features generous closet space and large windows that fill the home with natural light, creating a warm and welcoming feel throughout. Step outside to a private, fenced backyard--perfect for outdoor gatherings, gardening, or simply relaxing. As part of the St. Augustine Shor
Key facts
- Recent updates
- Community pool
- 4,791 sq ft lot
Tags
Property features AI
Finance
- HOA & community: Community association with monthly fee of $33; Community amenities include park and playground
Exterior
- Parking: Carport (1 space)
- Utilities: Public sewer; Electricity connected; Water connected; Sewer connected
- Home design: Single-family residence; One story
- Construction: Other roof
- Exterior features: Other exterior features; Paved road access
Interior
- Kitchen: Electric range; Microwave; Refrigerator
- Bedrooms: Three bedrooms (all on the first/main level)
- Flooring: Tile flooring
- Bathrooms: Two full bathrooms
- Heating & cooling: Heat pump heating; Central air conditioning
- Interior features: Six total rooms; Other interior details
- Laundry & utility: Utilities connected: electricity, water, sewer
Neighborhood map
What this means for you Summary
Snapshot
- This is a 3-bed/2.0-bath single-family listed at $199k.
Deal economics
- At list price, monthly cash flow is $197 ($2k/yr) — positive.
- The deal already cash-flows at list — no discount required.
- Meets the 1% rule at list price ($2k rent vs $199k).
- Cap rate 7.5% vs local median 3.4% in St. Augustine Shores — top-decile yield for the area; either an underpriced asset or a hidden risk that comps aren't pricing in. Stress-test before assuming the spread holds.
Location & tenants
- Location reads: area grade C — affects rentability + tenant quality, not the cash-flow math above.
- St. Johns (rural): math 75% / reading 73% proficiency, ranked #2 of 73 in FL (top 3%) — strong family-tenant draw, lease renewals of 3-5y typical; only 20% free/reduced lunch — higher-income household profile.
- Zoned schools: Gamble Rogers Middle School (math 61% / reading 55%, grade B, #151 of 571 statewide, top 27%, 925 students, 47% FRL); Pedro Menendez High School (math 31% / reading 54%, grade F, #264 of 667 statewide, top 41%, 1,519 students, 39% FRL) — zoned schools average 43% FRL vs 20% district-wide (23 pts higher); higher-poverty schools than district average — tighter screening recommended.
- Zoned-school proficiency averages 50% at this address vs 74% district-wide (-24 pts) — the specific schools serving this property underperform the St. Johns average; the district grade overstates school quality for this exact location.
- Market conditions: Rents flat; 400 active listings in the ZIP; 21 comparable units currently listed for rent nearby; rentals at typical pace (median 15d on market — plan ~3-4 weeks tenant-placement turnaround); solid renter incomes; 5,575 units permitted in St. Johns County in 2024 (584 in 5+ unit buildings).
- This rent runs 32% of the median local income ($77k/yr) — at the standard rent-burdened threshold; future hikes will face affordability resistance.
Forward outlook
- Local home prices are declining (-3.0%/yr); year-one equity from $1k of loan paydown is wiped out by about $6k of value loss. Plan a longer hold.
- St. Johns County population projected at +60% by 2050 — long-run rental-demand tailwind backs the buy-and-hold thesis.
Negotiation context
- Only 6 days on market — expect competitive offers; lowballing is unlikely to land.
- 4 sale attempts with the ask held roughly flat each time — persistent listings suggest the price (not the market) is what's stuck; bring a comps-based counter.
- Current owner paid $118k; list at $199k implies a 69% gain — meaningful room to come down on a strong offer.
Risks & watch-outs
- Climate carrying-cost: severe wind risk, 99% chance of damaging wind over 30y; extreme-heat days projected 7→22/yr by 2055 (HVAC capex compounding) — expect insurance premiums to compound above CPI over the hold.
Questions for the listing agent
- Built in 1973 — when were the roof, HVAC, electrical panel, plumbing, and water heater last replaced?
- What does the HOA fee cover, when was the last increase, and are there any pending special assessments or reserve-fund shortfalls?
- Is there a deadline driving the sale (1031 exchange, divorce, estate, relocation)? That informs how much negotiation room exists.
- What's the average days-on-market for RENTAL listings here right now (not sales)? A rising rental-DOM trend means longer vacancies and softer asking-rent achievability than the comps imply.
- What's the recent tenant-quality profile in this submarket — average credit score on applications, eviction rate, late-payment / NSF rate, and stable-employment percentage? A property-management company in the area should have these aggregated.
- How much new for-sale + rental construction is in the pipeline within 1–3 miles? Heavy new supply typically softens prices + rents 12–24 months out; constrained supply supports both.
Investment metrics
- 1% rule
- 1.02% ✓
- Cap rate
- 7.48%
- Cash-on-cash
- 4.23%
- DSCR
- 1.19
- GRM
- 8.2
CMA / ARV
- ARV (median comp)
- $262,955
- List price
- $199,000
- Delta
- -24.32%
- Verdict
- UNDERPRICED
- Comps
- 20 within 1.0 mi
Show comp detail 12 sales within ~0.75 mi
| Address | Dist | Beds/Ba | Sqft | Sold | Price | $/sf | Match |
|---|---|---|---|---|---|---|---|
| 200 Cecilia Ct | 0.18mi | 2/2.0 (-1) | 1,128 (+3%) | 0mo | $279,000 | $247 | 81 |
| 165 Toledo St | 0.22mi | 2/2.0 (-1) | 1,128 (+3%) | 3mo | $175,000 | $155 | 77 |
| 59 Deltona Blvd | 0.32mi | 2/2.0 (-1) | 1,066 (-3%) | 2mo | $239,900 | $225 | 74 |
| 196 Phoenetia Dr | 0.22mi | 2/2.0 (-1) | 1,008 (-8%) | 3mo | $225,000 | $223 | 69 |
| 124 Captains Point Cir | 0.50mi | 3/2.0 | 1,140 (+4%) | 4mo | $290,000 | $254 | 67 |
| 258 Costado St | 0.56mi | 2/1.5 (-1) | 1,108 (+1%) | 3mo | $275,000 | $248 | 62 |
| 72 Deltona Blvd | 0.34mi | 2/1.0 (-1) | 1,014 (-8%) | 1mo | $265,000 | $261 | 62 |
| 758 Viscaya Blvd | 0.70mi | 3/2.0 | 1,040 (-5%) | 1mo | $284,900 | $274 | 58 |
| 200 Laguna Ct | 0.47mi | 2/2.0 (-1) | 1,212 (+11%) | 0mo | $307,500 | $254 | 55 |
| 281 Rosario St | 0.45mi | 2/2.0 (-1) | 1,237 (+13%) | 3mo | $315,500 | $255 | 50 |
| 1008 Dorado Dr | 0.67mi | 2/2.0 (-1) | 1,025 (-6%) | 5mo | $296,000 | $289 | 49 |
| 991 Dorado Dr | 0.64mi | 2/2.0 (-1) | 1,212 (+11%) | 0mo | $275,000 | $227 | 48 |
Match score weights: distance 35% · size 25% · config 20% · recency 20%. Top-matched comps best support the ARV.
Projected returns pro-forma
-3.0% appreciation · 0.85% rent growth · sell at horizon
- IRR
- -12.2%
- Equity multiple
- 0.57×
- Total profit
- $-23,965
- Equity at exit
- $29,672
- IRR
- -6.6%
- Equity multiple
- 0.62×
- Total profit
- $-21,392
- Equity at exit
- $17,206
Cash invested: $55,720 (down + closing). Projections, not guarantees.
Landlord ↔ Tenant lean methodology
- Overall (STATE)
- 87 Strongly Landlord-Friendly
- State Florida
- 87 Strongly Landlord-Friendly · R+3
- County
- — inherits STATE
- City
- — inherits STATE
ZIP-level market 32086
- Rents YoY
- 0.8%
- Active inventory
- 400
- Price-to-rent
- 8.2×
Monthly cashflow live
- Estimated rent
- $2,022 high interval (Pro) →
- Mortgage (P&I)
- −$1,044
- Tax from tax record
- −$241 /mo · $2,894/yr
- Insurance
- −$83
- HOA
- −$33
- Vacancy / Maint / Mgmt
- −$425
- Net cashflow
- $197
Break-even live
UW: 25.0% down · 7.5% · 30yr · 1.5% tax · 5.0% vac · 8.0% maint · 8.0% mgmt
Financing live
Cash to close
- Down payment
- $49,750
- Closing costs
- $5,970
- Reserves months
- —
- Total cash needed
- —
Loan-product check · same deal, 3 products live
Conventional
25% down · 7.5% · 30yr
- Down + closing
- —
- Monthly P&I
- —
- Monthly cashflow
- —
- DSCR
- —
- Eligible?
- —
Personal DTI + credit; lowest rate.
DSCR
20% down · 8.5% · 30yr
- Down + closing
- —
- Monthly P&I
- —
- Monthly cashflow
- —
- DSCR
- —
- Eligible?
- —
No personal income docs; deal must DSCR.
Hard money
10% down · 12.0% · 12mo
- Down + closing
- —
- Monthly P&I
- —
- Monthly cashflow
- —
- DSCR
- —
- Eligible?
- —
Short-term bridge; refi at stabilization.
Rent comps 21 comps
| Address | Beds | Baths | Sqft | Rent | $/sqft | DOM | Units | Dist |
|---|---|---|---|---|---|---|---|---|
| 146 Phoenetia Dr St Augustine, FL | 3.0 | 2.0 | 1042 | $1,900 | $1.82 | 3d | 1 | 0.08mi |
| 68 Angelo Ln Saint Augustine, FL | 2.0 | 2.0 | 900 | $1,645 | $1.83 | 13d | 1 | 0.27mi |
| 901 Mariana Pl Saint Augustine, FL | 3.0 | 2.0 | 1447 | $2,175 | $1.50 | 3d | 1 | 0.84mi |
| 250 Brainard Dr Unit A St. Augustine, FL | 2.0 | 1.0 | 960 | $2,400 | $2.50 | 23d | 1 | 0.88mi |
| 4420 Carter Rd #43 Saint Augustine, FL | 2.0 | 1.5 | 870 | $1,450 | $1.67 | 23d | 1 | 1.04mi |
| 968 Salzedo Ave Saint Augustine, FL | 2.0 | 2.0 | 1036 | $2,100 | $2.03 | 23d | 1 | 1.10mi |
| 494 Romano St St. Augustine, FL | 3.0 | 2.0 | 1289 | $1,899 | $1.47 | 2d | 1 | 1.19mi |
| 707 Augusta Cir Saint Augustine, FL | 3.0 | 2.0 | 1428 | $1,868 | $1.31 | 3d | 1 | 1.28mi |
| 204 Augusta Cir Saint Augustine, FL | 2.0 | 2.0 | 1189 | $1,750 | $1.47 | 17d | 1 | 1.33mi |
| 204 Augusta Cir Saint Augustine, FL | 2.0 | 2.0 | 1189 | $1,750 | $1.47 | 23d | 1 | 1.33mi |
| 15 Cartagena Ct Saint Augustine, FL | 2.0 | 2.0 | 880 | $1,850 | $2.10 | 14d | 1 | 1.33mi |
| 37 Tarragona Ct #37 St. Augustine, FL | 2.0 | 2.0 | 880 | $1,600 | $1.82 | 7d | 1 | 1.35mi |
| 4 Tarragona Ct Saint Augustine, FL | 2.0 | 2.0 | 920 | $1,550 | $1.68 | 23d | 1 | 1.35mi |
| 407 Augusta Cir Saint Augustine, FL | 3.0 | 2.0 | 1428 | $2,095 | $1.47 | 7d | 1 | 1.35mi |
| 9 Tarragona Ct Saint Augustine, FL | 2.0 | 2.0 | 880 | $1,600 | $1.82 | 23d | 1 | 1.35mi |
| 16 Alcira Ct Unit 16 St. Augustine, FL | 2.0 | 2.0 | 920 | $1,500 | $1.63 | 7d | 1 | 1.38mi |
| 1603 Prestwick Pl Saint Augustine, FL | 3.0 | 2.0 | 1428 | $2,200 | $1.54 | 23d | 1 | 1.42mi |
| 7 Castania Ct Saint Augustine, FL | 2.0 | 2.0 | 880 | $1,700 | $1.93 | 23d | 1 | 1.44mi |
| 40 Andalusia Ct Unit 40 St. Augustine, FL | 2.0 | 2.0 | 920 | $1,650 | $1.79 | 23d | 1 | 1.47mi |
| 13 Navarra Ct Saint Augustine, FL | 2.0 | 2.0 | 1074 | $1,695 | $1.58 | 7d | 1 | 1.48mi |
| 54 Veronese Ct Saint Augustine, FL | 2.0 | 2.0 | 920 | $1,495 | $1.62 | 3d | 1 | 1.48mi |
HOA detail
- Monthly dues
- $33 · $396/yr
Listing history 13 events
-
2026-05-15status Active 909-char remark
-
2026-05-14historical 909-char remark
-
2026-05-13$199,000 Active 909-char remark
-
2026-03-10price $224,999
-
2025-12-03status Active
-
2025-11-19status Pending
-
2025-10-24price $239,900
-
2025-09-23$249,900 Active
-
2022-07-15price $1,950
-
2018-05-15soldstatus $118,000
-
2018-05-11soldstatus $90,000
-
2018-05-11soldstatus $99,000
-
1987-09-01soldstatus $36,100
ⓘ Source: listings_history table (triggers on properties + properties_extension) + one-shot
backfill from property_details.listing_events for pre-trigger history.
Tax reassessment forecast FL · Resets to sale price
- Current annual tax
- $2,894 · $241/mo
- Projected year-2 tax
- $2,894 · $241/mo
- Expected delta
- $0/yr ($0/mo · 0.0%)
ⓘ Screening estimate from a state-policy table — verify with the county assessor before closing.
Climate risk First Street
- Flood 1/10 Low FEMA zone X (unshaded) · 0% chance over 30 yrs
- Wildfire 3/10 Moderate
- Heat 10/10 Extreme 7 d/yr ≥106°F today · 22 d/yr by 30 yrs out
- Wind 10/10 Extreme 99% chance of damaging wind over 30 yrs
- Air quality 3/10 Moderate 3 unhealthy d/yr today · 3 by 30 yrs out
Nearby sold comps map
Loading sold comps map…
Walkable amenities ~0.75 mi
Loading nearby amenities…
Taxation est. · year 1
- Rental income
- $24,261
- − Mortgage interest
- −$11,147
- − Property taxes
- −$2,894
- − Insurance
- −$995
- − Repairs & maintenance
- −$1,941
- − Management
- −$1,941
- − HOA
- −$396
- − Depreciation
- −$5,789
- Taxable loss
- −$842
- Est. tax savings @ 24.0%
- +$202
- After-tax cash flow
- $2,560/yr
For passive investors: Depreciation is non-cash, so a rental often shows a tax loss while cash-flowing — sheltering income. Rental losses are passive: they offset passive income freely, and up to $25,000/yr can offset ordinary (W-2) income if you actively participate and your MAGI is under $100k (phasing out to $0 by $150k); unused losses carry forward. On sale, claimed depreciation is recaptured at up to 25%, and gains may owe capital-gains tax (a 1031 exchange can defer both). Figures are a year-1 estimate at your 24.0% rate — not tax advice; consult a CPA.
Schools (NCES district)
- District
- St. Johns
- NCES district ID
- 1201740
- Math proficiency
- 75% ▼ -5.00%
- Reading proficiency
- 73% ▼ -2.00%
- Median HH income
- $66,842
- Composite
- 64.31/100
- National rank
- #556
- State rank
- #2 of 73 in FL
Livability — St. Augustine Shores
No livability data for this city. (Only ~50 U.S. cities are tracked.)
Census & demographics
- Census place
- St. Augustine Shores, FL
- County
- Saint Johns County · 301,599 people
- Metro
- Jacksonville, FL
- Population (ZIP)
- 34,855
- Household income
- $76,512
- Rent vs Own
- Severe rent burden
- 634.0
Population outlook (St. Johns County) Hauer SSP2
- Today (2025)
- 303,941 people
- By 2030
- 342,590 · +12.7%
- By 2040
- 417,328 · +37.3%
- By 2050
- 487,011 · +60.2%
- By 2075
- 635,395 · +109.1%
- By 2100
- 717,469 · +136.1%
Race, ethnicity, and origin ACS 2023
- Neighborhood character
- Predominantly White (84%)
- Race & ethnicity
- White 84% Hispanic / Latino 8% Two or more races 5% Black 3% Asian 1%
- Hispanic origin (detail)
- Puerto Rican 2% Dominican 1%
- Common ancestry
- Romanian 3% Lithuanian 3% Italian 2%
- Foreign-born
- 7% · Canada, Jamaica, Guatemala
- Languages at home
- 91% English-only · Spanish 5% German/W. Germanic 1% Other Indo-European 1%
Political lean MEDSL · St. Johns
- 2024 margin
- Solid R (+31.4) · D 33.9% · R 65.2%
- 2008→2024 swing
- +0.2pp no change · 2008: -31.6pp · 2024: -31.4pp
- All cycles
- 2024: R+31.4 2020: R+26.7 2016: R+33.4 2012: R+37.8 2008: R+31.6
Not yet ingested
- Civics
- —
Market trends
- HPI YoY
- ▼ -278.21%
- Current HPI
- 306.2813
- Rent YoY
- ▲ 0.85%
- Metro
- Jacksonville, FL
- State GDP YoY
- ▲ 3.28%
- F500 in state
- 36
Industry mix (Fortune 500 HQ in FL)
| Industry | F500 HQs | Revenue |
|---|---|---|
| Industrial Technology | 2 | $29B |
|
||
| Insurance | 2 | $17B |
|
||
| Retail | 1 | $60B |
|
||
| Technology Distribution | 1 | $58B |
|
||
| Homebuilding | 1 | $35B |
|
||
| Technology Manufacturing | 1 | $35B |
|
||
Price history
+451.2% since first listed14 events — show timeline
- 2026-05-21 Pending — realMLS
- 2026-05-15 Relisted — realMLS
- 2026-05-14 Listing Removed — realMLS
- 2026-05-13 Listed $199,000 realMLS
- 2026-03-10 Price Changed $224,999 Stellar MLS as Distributed by MLS Grid
- 2025-12-03 Relisted — Stellar MLS as Distributed by MLS Grid
- 2025-11-19 Pending — Stellar MLS as Distributed by MLS Grid
- 2025-10-24 Price Changed $239,900 Stellar MLS as Distributed by MLS Grid
- 2025-09-23 Listed $249,900 Stellar MLS as Distributed by MLS Grid
- 2022-07-15 Price Changed $1,950 RENT.
- 2018-05-15 Sold (Public Records) $118,000 Public Records
- 2018-05-11 Sold (Public Records) $99,000 Public Records
- 2018-05-11 Sold (Public Records) $90,000 Public Records
- 1987-09-01 Sold (Public Records) $36,100 Public Records
Property tax history
+8.5%/yrLatest (2025): $2,894 · +13.5% YoY. Source: county tax records.
Cash-flow waterfall
monthlySold comps — $/sqft
last 12 mo · ≤1 miLoading sold comps…