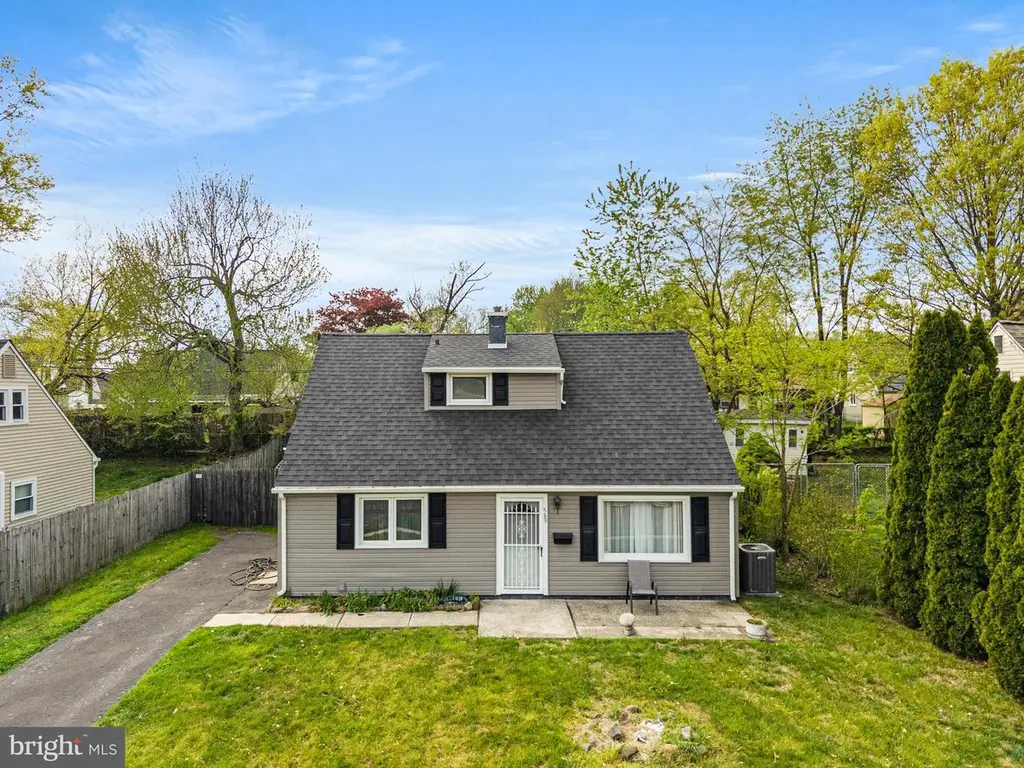
589 Elbridge Rd · Morrisville, PA
Flood risk 1/10 · Minimal
- FEMA flood zone
- X (unshaded)
- Chance of flooding over 30 yrs
- 0.0%
- Est. flood insurance / yr
- $507 – $1,088
Fire risk 1/10 · Minimal
- Est. fire insurance / yr
- $511 – $949
Heat risk 6/10 · Moderate
- Hot days now (above 103°F)
- 7 days/yr
- Hot days in 30 yrs
- 15 days/yr
Wind risk 6/10 · Moderate
- Chance of severe wind over 30 yrs
- 27.0%
Air-quality risk 5/10 · Moderate
- Unhealthy air days now
- 6 days/yr
- Unhealthy air days in 30 yrs
- 8 days/yr
Risk factors via First Street. Map © Google.
Why this score? — see what drove the C- grade
The composite is a weighted blend of 9 inputs, each scored 0–100. Each bar is that input's sub-score; the figure is the points it added to the 100-point composite (weight × sub-score).
- ARV discount +15.0/15.0
- Cash flow +14.9/30.0
- 1% rule +4.8/10.0
- DSCR +4.6/10.0
- Livability +4.0/5.0
- Rent growth +3.3/5.0
- Condition / age +2.5/5.0
- Schools +1.7/10.0
- Appreciation +0.0/10.0
$289,000
🖨 Deal sheet 📄 Offer letter ✓ Due diligence
Listing remarks
Welcome to 589 Elbridge Rd! This 3 bedroom 1.5 bath is ready for your finishing touches. Cosmetic upgrades are needed but this is a great home at a great price! The main level offers an eat in kitchen that opens up to a spacious dining room. Off of the dining room you will find a bedroom and down the hall towards the back of the house you will be amazed to find not only a sizeable room that could be used for an office or den in addition to the very spacious family room. Upstairs boosts two sizable rooms and a half bath. Outside your driveway will be able to fit 2+ cars and the sizable backyard will make hosting summer events a breeze! Home is being sold as is, no repairs will be made any re
Key facts
- Sizeable room
- Sizable backyard
- Spacious dining room
Tags
Property features AI
Exterior
- Parking: Driveway
- Utilities: Public water; Public sewer; Electric cooling; Natural gas service
- Home design: Detached structure; Frame construction
- Construction: Frame construction; Slab foundation; Above grade and below grade structures noted
- Exterior features: Lot dimensions approximately 60 x 100; No tidal water
Interior
- Bedrooms: One bedroom on the main level; Two bedrooms on the first upper level
- Bathrooms: One full bathroom on the main level; One half bathroom on the first upper level
- Heating & cooling: Central heating; Natural gas heating; Central air conditioning (electric); Natural gas hot water
- Interior features: No basement; Living area recorded from assessor
Neighborhood map
What this means for you Summary
Snapshot
- This is a 3-bed/1.5-bath single-family listed at $289k.
Deal economics
- At list price, monthly cash flow is $84 ($1k/yr) — positive.
- The deal already cash-flows at list — no discount required.
- To meet the 1% rule (rent ≥ 1% of price), the offer needs to be $283k (2.1% below list).
- Recommended offer: $283k (2.1% below list) — sets the bar for 1% rule.
- Cap rate 6.6% vs local median 4.1% in Morrisville — top-decile yield for the area; either an underpriced asset or a hidden risk that comps aren't pricing in. Stress-test before assuming the spread holds.
Location & tenants
- Location reads 81/100 on livability (#174 in PA, #1,447 nationally) — a professional / high-income tenant draw. Strengths: employment A+, housing A+, schools B+.
- Morrisville Borough SD (suburban): math 7% / reading 30% proficiency, ranked #490 of 539 in PA (top 91%) — low school quality limits family demand, transient renter base, plan for 1-2y turnover.
- Market conditions: Rents rising (+3.1%/yr); 168 active listings in the ZIP; 5 comparable units currently listed for rent nearby; rentals lingering (median 44d on market — plan ~5-8 weeks vacancy on turnover, expect pricing pressure); 60% of comp listings sitting > 30 days — soft ceiling on asking rent; high-income renter base; 663 units permitted in Bucks County in 2024 (106 in 5+ unit buildings).
Forward outlook
- Local home prices are declining (-3.0%/yr); year-one equity from $2k of loan paydown is wiped out by about $9k of value loss. Plan a longer hold.
- Bucks County population projected to shrink 7% by 2050 — rents likely to lag national; underwrite the cash flow, not the appreciation.
Negotiation context
- Only 8 days on market — expect competitive offers; lowballing is unlikely to land.
Risks & watch-outs
- Watch-outs: built in 1955 — expect roof / HVAC / electrical / plumbing capex.
- Climate carrying-cost: major wind risk, 27% chance of damaging wind over 30y; extreme-heat days projected 7→15/yr by 2055 (HVAC capex compounding) — expect insurance premiums to compound above CPI over the hold.
Questions for the listing agent
- Built in 1955 — when were the roof, HVAC, electrical panel, plumbing, and water heater last replaced?
- Is there a deadline driving the sale (1031 exchange, divorce, estate, relocation)? That informs how much negotiation room exists.
- Schools are B-rated — typically a magnet for longer-tenancy family renters. What's the average tenant stay here, and is there a school-zone premium baked into asking?
- What's the average days-on-market for RENTAL listings here right now (not sales)? A rising rental-DOM trend means longer vacancies and softer asking-rent achievability than the comps imply.
- What's the recent tenant-quality profile in this submarket — average credit score on applications, eviction rate, late-payment / NSF rate, and stable-employment percentage? A property-management company in the area should have these aggregated.
- How much new for-sale + rental construction is in the pipeline within 1–3 miles? Heavy new supply typically softens prices + rents 12–24 months out; constrained supply supports both.
Investment metrics
- 1% rule
- 0.98% ✗
- Cap rate
- 6.64%
- Cash-on-cash
- 1.25%
- DSCR
- 1.06
- GRM
- 8.5
CMA / ARV
- ARV (median comp)
- $355,664
- List price
- $289,000
- Delta
- -18.74%
- Verdict
- UNDERPRICED
- Comps
- 20 within 1.0 mi
Show comp detail 12 sales within ~0.75 mi
| Address | Dist | Beds/Ba | Sqft | Sold | Price | $/sf | Match |
|---|---|---|---|---|---|---|---|
| 589 Elbridge Rd | 0.00mi | 3/1.5 | 1,760 (0%) | 1mo | $255,000 | $145 | 99 |
| 606 Fairhill Rd | 0.17mi | 3/2.0 | 1,632 (-7%) | 3mo | $320,000 | $196 | 75 |
| 596 Rosemar Dr | 0.04mi | 3/2.0 | 1,545 (-12%) | 3mo | $400,000 | $259 | 73 |
| 333 E Birch Dr | 0.47mi | 3/1.5 | 1,710 (-3%) | 1mo | $475,000 | $278 | 73 |
| 582 Elbridge Rd | 0.04mi | 3/2.0 | 1,558 (-12%) | 8mo | $389,900 | $250 | 71 |
| 101 Walnut Ln | 0.54mi | 3/1.5 | 1,848 (+5%) | 0mo | $547,000 | $296 | 66 |
| 222 Arborlea Ave | 0.51mi | 3/2.0 | 1,682 (-4%) | 1mo | $690,000 | $410 | 66 |
| 6 Carolina Ave | 0.23mi | 3/2.0 | 1,974 (+12%) | 4mo | $305,000 | $155 | 63 |
| 625 Hillcrest Ave | 0.48mi | 3/1.0 | 1,612 (-8%) | 2mo | $330,000 | $205 | 60 |
| 430 W Palmer St | 0.47mi | 3/1.5 | 1,888 (+7%) | 8mo | $445,000 | $236 | 59 |
| 708 Barclay Ave | 0.48mi | 3/2.0 | 1,513 (-14%) | 2mo | $425,000 | $281 | 50 |
| 603 Jefferson Ave | 0.52mi | 3/2.5 | 1,532 (-13%) | 6mo | $395,000 | $258 | 45 |
Match score weights: distance 35% · size 25% · config 20% · recency 20%. Top-matched comps best support the ARV.
Projected returns pro-forma
-3.0% appreciation · 3.12% rent growth · sell at horizon
- IRR
- -14.1%
- Equity multiple
- 0.49×
- Total profit
- $-40,980
- Equity at exit
- $43,091
- IRR
- -5.0%
- Equity multiple
- 0.67×
- Total profit
- $-26,804
- Equity at exit
- $24,987
Cash invested: $80,920 (down + closing). Projections, not guarantees.
Landlord ↔ Tenant lean methodology
- Overall (STATE)
- 62 Landlord-Friendly
- State Pennsylvania
- 62 Landlord-Friendly · EVEN
- County
- — inherits STATE
- City
- — inherits STATE
ZIP-level market 19067
- Rents YoY
- 3.1%
- Active inventory
- 168
- Price-to-rent
- 8.5×
Monthly cashflow live
- Estimated rent
- $2,829 medium interval (Pro) →
- Mortgage (P&I)
- −$1,516
- Tax from tax record
- −$514 /mo · $6,173/yr
- Insurance
- −$120
- HOA
- −$0
- Vacancy / Maint / Mgmt
- −$594
- Net cashflow
- $84
Break-even live
UW: 25.0% down · 7.5% · 30yr · 1.5% tax · 5.0% vac · 8.0% maint · 8.0% mgmt
Financing live
Cash to close
- Down payment
- $72,250
- Closing costs
- $8,670
- Reserves months
- —
- Total cash needed
- —
Loan-product check · same deal, 3 products live
Conventional
25% down · 7.5% · 30yr
- Down + closing
- —
- Monthly P&I
- —
- Monthly cashflow
- —
- DSCR
- —
- Eligible?
- —
Personal DTI + credit; lowest rate.
DSCR
20% down · 8.5% · 30yr
- Down + closing
- —
- Monthly P&I
- —
- Monthly cashflow
- —
- DSCR
- —
- Eligible?
- —
No personal income docs; deal must DSCR.
Hard money
10% down · 12.0% · 12mo
- Down + closing
- —
- Monthly P&I
- —
- Monthly cashflow
- —
- DSCR
- —
- Eligible?
- —
Short-term bridge; refi at stabilization.
Rent comps 5 comps
| Address | Beds | Baths | Sqft | Rent | $/sqft | DOM | Units | Dist |
|---|---|---|---|---|---|---|---|---|
| 432 W Bridge St Morrisville, PA | 2.0 | 1.0 | 1853 | $2,000 | $1.08 | 43d | 1 | 0.71mi |
| 130 Harper Ave Morrisville, PA | 3.0 | 2.5 | 1276 | $3,500 | $2.74 | 12d | 1 | 0.87mi |
| 34 E Hendrickson Ave Morrisville, PA | 3.0 | 1.0 | 1360 | $2,650 | $1.95 | 43d | 1 | 0.91mi |
| 250 Washington St Morrisville, PA | 2.0 | 1.0 | 2371 | $1,750 | $0.74 | 44d | 1 | 1.15mi |
| 117 Park Ave Morrisville, PA | 3.0 | 2.0 | 1396 | $3,200 | $2.29 | 12d | 1 | 1.23mi |
Listing history 3 events
-
2026-05-03status Pending 761-char remark
-
2026-04-30price $289,000 761-char remark
-
2026-04-24$319,990 Active 761-char remark
ⓘ Source: listings_history table (triggers on properties + properties_extension) + one-shot
backfill from property_details.listing_events for pre-trigger history.
Tax reassessment forecast PA · Partial reset (capped growth)
- Current annual tax
- $6,173 · $514/mo
- Projected year-2 tax
- $6,173 · $514/mo
- Expected delta
- $0/yr ($0/mo · 0.0%)
ⓘ Screening estimate from a state-policy table — verify with the county assessor before closing.
Climate risk First Street
- Flood 1/10 Low FEMA zone X (unshaded) · 0% chance over 30 yrs
- Wildfire 1/10 Low
- Heat 6/10 Major 7 d/yr ≥103°F today · 15 d/yr by 30 yrs out
- Wind 6/10 Major 27% chance of damaging wind over 30 yrs
- Air quality 5/10 Major 6 unhealthy d/yr today · 8 by 30 yrs out
Nearby sold comps map
Loading sold comps map…
Walkable amenities ~0.75 mi
Loading nearby amenities…
Taxation est. · year 1
- Rental income
- $33,945
- − Mortgage interest
- −$16,188
- − Property taxes
- −$6,173
- − Insurance
- −$1,445
- − Repairs & maintenance
- −$2,716
- − Management
- −$2,716
- − Depreciation
- −$8,407
- Taxable loss
- −$3,700
- Est. tax savings @ 24.0%
- +$888
- After-tax cash flow
- $1,900/yr
For passive investors: Depreciation is non-cash, so a rental often shows a tax loss while cash-flowing — sheltering income. Rental losses are passive: they offset passive income freely, and up to $25,000/yr can offset ordinary (W-2) income if you actively participate and your MAGI is under $100k (phasing out to $0 by $150k); unused losses carry forward. On sale, claimed depreciation is recaptured at up to 25%, and gains may owe capital-gains tax (a 1031 exchange can defer both). Figures are a year-1 estimate at your 24.0% rate — not tax advice; consult a CPA.
Schools (NCES district)
- District
- Morrisville Borough SD
- NCES district ID
- 4215900
- Math proficiency
- 7% ▼ -22.00%
- Reading proficiency
- 30% ▼ -18.00%
- Median HH income
- $58,263
- Composite
- 17.37/100
- National rank
- #9075
- State rank
- #490 of 539 in PA
Livability — Morrisville
- Score
- 81/100
- State rank
- #174
- US rank
- #1447
Category grades
Schools grade is shown separately in the Schools card above.
Census & demographics
- Census place
- Morrisville, PA
- County
- Bucks County · 506,477 people
- City population
- 53,885
- Metro
- Philadelphia-Camden-Wilmington, PA-NJ-DE-MD
- Population (ZIP)
- 53,885
- Household income
- $133,630
- Rent vs Own
- Severe rent burden
- 1036.0
Population outlook (Bucks County) Hauer SSP2
- Today (2025)
- 630,973 people
- By 2030
- 627,093 · -0.6%
- By 2040
- 609,680 · -3.4%
- By 2050
- 584,225 · -7.4%
- By 2075
- 539,840 · -14.4%
- By 2100
- 483,970 · -23.3%
Race, ethnicity, and origin ACS 2023
- Neighborhood character
- Predominantly White (80%)
- Race & ethnicity
- White 80% Hispanic / Latino 7% Asian 6% Two or more races 5% Black 4%
- Hispanic origin (detail)
- Mexican 2% Puerto Rican 1% Dominican 1%
- Common ancestry
- Romanian 10% Scotch-Irish 2% Italian 2%
- Foreign-born
- 11% · Canada, China, Jamaica
- Languages at home
- 88% English-only · Spanish 5% Other Indo-European 3% Russian/Polish/Slavic 2%
Political lean MEDSL · Bucks
- 2024 margin
- Toss-up / Even · D 49.5% · R 49.5%
- 2008→2024 swing
- -8.7pp toward R · 2008: 8.7pp · 2024: -0.1pp
- All cycles
- 2024: R+0.1 2020: D+4.4 2016: D+0.6 2012: D+1.2 2008: D+8.7
Not yet ingested
- Civics
- —
Market trends
- HPI YoY
- ▼ -435.62%
- Current HPI
- 281.8167
- Rent YoY
- ▲ 3.12%
- Metro
- Philadelphia-Camden-Wilmington, PA-NJ-DE-MD
- State GDP YoY
- ▲ 1.68%
- F500 in state
- 34
Industry mix (Fortune 500 HQ in PA)
| Industry | F500 HQs | Revenue |
|---|---|---|
| Healthcare | 2 | $309B |
|
||
| Insurance | 2 | $27B |
|
||
| Telecommunications / Media | 1 | $124B |
|
||
| Industrial Distribution | 1 | $22B |
|
||
| Financial Services | 1 | $20B |
|
||
| Chemicals / Materials | 1 | $18B |
|
||
Price history
-20.3% since first listed5 events — show timeline
- 2026-06-05 Sold (Public Records) $255,000 Public Records
- 2026-05-28 Sold (MLS) $255,000 BRIGHT MLS
- 2026-05-03 Pending — BRIGHT MLS
- 2026-04-30 Price Changed $289,000 BRIGHT MLS
- 2026-04-24 Listed $319,990 BRIGHT MLS
Property tax history
+2.1%/yrLatest (2026): $6,173 · +1.4% YoY. Source: county tax records.
Cash-flow waterfall
monthlySold comps — $/sqft
last 12 mo · ≤1 miLoading sold comps…