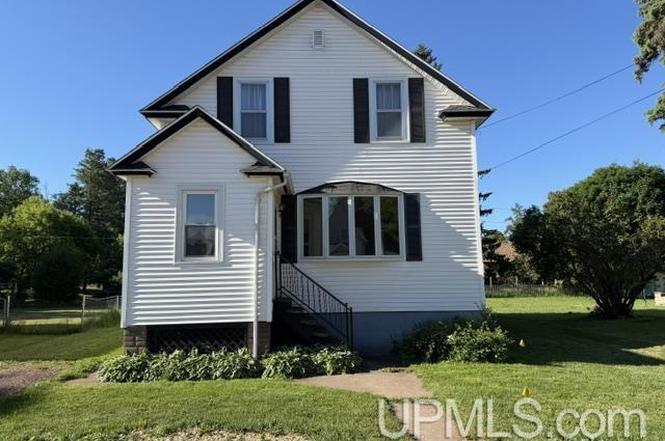
241 E Michigan Ave · Ironwood, MI
Flood risk 4/10 · Minor
- FEMA flood zone
- X
- Chance of flooding over 30 yrs
- 0.22%
- Est. flood insurance / yr
- $473 – $860
Fire risk 1/10 · Minimal
- Est. fire insurance / yr
- $784 – $1,456
Heat risk 1/10 · Minimal
- Hot days now (above 89°F)
- 7 days/yr
- Hot days in 30 yrs
- 14 days/yr
Wind risk 1/10 · Minimal
- Chance of severe wind over 30 yrs
- —
Air-quality risk 1/10 · Minimal
- Unhealthy air days now
- 0 days/yr
- Unhealthy air days in 30 yrs
- 0 days/yr
Risk factors via First Street. Map © Google.
Why this score? — see what drove the B+ grade
The composite is a weighted blend of 9 inputs, each scored 0–100. Each bar is that input's sub-score; the figure is the points it added to the 100-point composite (weight × sub-score).
- Cash flow +30.0/30.0
- ARV discount +15.0/15.0
- 1% rule +10.0/10.0
- DSCR +10.0/10.0
- Livability +3.5/5.0
- Schools +2.6/10.0
- Rent growth +2.5/5.0
- Condition / age +2.5/5.0
- Appreciation +0.0/10.0
$94,500
🖨 Deal sheet 📄 Offer letter ✓ Due diligence
Listing remarks MLS
Welcome home to this charming property conveniently located near downtown Ironwood and outdoor recreation opportunities. The main level features a spacious living room with hardwood floors and a bow window that fills the space with natural light. The kitchen offers plenty of cabinet space, along with a main-floor bedroom and a full bathroom for added convenience. A sunny back porch provides a perfect spot to relax, unwind, or create a functional mudroom area. Upstairs, you'll find a large primary bedroom with a sitting area, along with two additional walk-through bedrooms that offer flexible use as bedrooms, a home office, playroom, whatever best suits your needs. There is also an older half bath on the upper level that is not in working order but would be an excellent opportunity to create a full second bathroom. Recent updates include a newer roof and hot water heater. Outdoor enthusiasts will appreciate the property's proximity to the ATV and snowmobile trails, the Iron Belle Trail, and all downtown Ironwood's amenities. Buyer to verify square footage and lot size.
Key facts
- Sunny back porch
- Newer roof
- Hot water heater
Tags
Property features AI
Exterior
- Parking: Detached 1-car garage
- Utilities: Public water; Public sanitary sewer; Natural gas heating fuel available; Electric water heater; Cable available
- Home design: Residential 2-story home; Built in 1909; Entry facing road (municipality: Ironwood)
- Construction: Michigan basement foundation; Stone basement; Vinyl siding; Asphalt roofing (as listed)
- Exterior features: Vinyl siding; Asphalt (exterior material/roof detail); City limits location; Paved street frontage; Frontage on a road
Interior
- Kitchen: Range/oven; Refrigerator
- Bedrooms: Main floor bedroom (12 x 12); Upper bedroom (20 x 12); Upper bedroom (approx. 10 width); Upper bedroom (11 x 10)
- Flooring: Hardwood floors
- Bathrooms: One full bathroom on the main floor
- Heating & cooling: Forced air heating; No central air listed
- Interior features: Hardwood floors; Full basement (stone foundation)
- Laundry & utility: Washer; Electric water heater
Neighborhood map
What this means for you Summary
Snapshot
- This is a 4-bed/1.0-bath single-family listed at $94k.
Deal economics
- At list price, monthly cash flow is $545 ($7k/yr) — positive.
- The deal already cash-flows at list — no discount required.
- Meets the 1% rule at list price ($1k rent vs $94k).
- Cap rate 13.2% vs local median 5.8% in Ironwood — top-decile yield for the area; either an underpriced asset or a hidden risk that comps aren't pricing in. Stress-test before assuming the spread holds.
Location & tenants
- Location reads 70/100 on livability (#325 in MI) — a middle-class / working-renter tenant base. Strengths: cost of living A+, crime A, housing A; Watch: health & safety C-, schools D+, amenities F.
- Ironwood Area Schools Of Gogebic County (town): math 23% / reading 40% proficiency, ranked #361 of 540 in MI (top 67%) — families likely to look elsewhere, expect single-tenant / working-renter base with shorter leases.
- Market conditions: 70 active listings in the ZIP; 28 units permitted in Gogebic County in 2024 (0 in 5+ unit buildings).
Forward outlook
- Local home prices are declining (-3.0%/yr); year-one equity from $653 of loan paydown is wiped out by about $3k of value loss. Plan a longer hold.
- Gogebic County population projected at -24% by 2050 — secular population decline; favor cash flow + early exit over multi-decade hold.
- At projected returns (-3.0% appreciation + 3.0% rent growth), your $26k cash investment doubles in ~5 years — after that, you're playing with house money.
Negotiation context
- Only 3 days on market — expect competitive offers; lowballing is unlikely to land.
- 4 sale attempts since 8y ago with the ask held roughly flat each time — persistent listings suggest the price (not the market) is what's stuck; bring a comps-based counter.
- Current owner paid $19k; list at $94k implies a 397% gain — meaningful room to come down on a strong offer.
Risks & watch-outs
- Watch-outs: built in 1909 — expect roof / HVAC / electrical / plumbing capex.
Questions for the listing agent
- Built in 1909 — when were the roof, HVAC, electrical panel, plumbing, and water heater last replaced?
- Is there a deadline driving the sale (1031 exchange, divorce, estate, relocation)? That informs how much negotiation room exists.
- Schools are D-rated, which usually means shorter tenancies and higher turnover. Who's the typical renter profile here, and what's been the actual vacancy rate?
- What's the average days-on-market for RENTAL listings here right now (not sales)? A rising rental-DOM trend means longer vacancies and softer asking-rent achievability than the comps imply.
- What's the recent tenant-quality profile in this submarket — average credit score on applications, eviction rate, late-payment / NSF rate, and stable-employment percentage? A property-management company in the area should have these aggregated.
- How much new for-sale + rental construction is in the pipeline within 1–3 miles? Heavy new supply typically softens prices + rents 12–24 months out; constrained supply supports both.
Investment metrics
- 1% rule
- 1.57% ✓
- Cap rate
- 13.21%
- Cash-on-cash
- 24.70%
- DSCR
- 2.10
- GRM
- 5.3
CMA / ARV
- ARV (on-the-fly)
- $117,216
- Comps found
- 12
Show comp detail 12 sales within ~0.75 mi
| Address | Dist | Beds/Ba | Sqft | Sold | Price | $/sf | Match |
|---|---|---|---|---|---|---|---|
| 148 E Michigan Ave | 0.13mi | 4/2.0 | 1,360 (+2%) | 9mo | $144,000 | $106 | 79 |
| 257 E Michigan Ave | 0.03mi | 4/1.5 | 1,500 (+13%) | 4mo | $110,000 | $73 | 72 |
| 230 W Michigan Ave | 0.41mi | 3/1.5 (-1) | 1,338 (+0%) | 7mo | $165,000 | $123 | 67 |
| 215 E Gogebic St | 0.22mi | 3/1.0 (-1) | 1,470 (+10%) | 4mo | $71,500 | $49 | 64 |
| 126 W Michigan Ave | 0.31mi | 3/1.5 (-1) | 1,252 (-6%) | 7mo | $197,000 | $157 | 63 |
| 108 W Ridge St | 0.26mi | 3/1.5 (-1) | 1,440 (+8%) | 8mo | $127,000 | $88 | 60 |
| 150 W Arch St | 0.35mi | 3/1.0 (-1) | 1,493 (+12%) | 0mo | $120,000 | $80 | 58 |
| 308 W Ayer St | 0.58mi | 4/2.0 | 1,402 (+5%) | 2mo | $118,450 | $84 | 58 |
| 233 W Pewabic St | 0.49mi | 3/1.0 (-1) | 1,260 (-5%) | 9mo | $50,925 | $40 | 56 |
| 717 Pabst St | 0.47mi | 3/2.0 (-1) | 1,190 (-11%) | 6mo | $86,900 | $73 | 46 |
| 504 N 1st Ave | 0.72mi | 3/1.0 (-1) | 1,160 (-13%) | 1mo | $134,700 | $116 | 39 |
| 501 E Margaret St | 0.52mi | 3/2.0 (-1) | 1,152 (-14%) | 8mo | $170,000 | $148 | 37 |
Match score weights: distance 35% · size 25% · config 20% · recency 20%. Top-matched comps best support the ARV.
Projected returns pro-forma
-3.0% appreciation · 3.0% rent growth · sell at horizon
- IRR
- 18.1%
- Equity multiple
- 1.73×
- Total profit
- $19,382
- Equity at exit
- $14,090
- IRR
- 26.5%
- Equity multiple
- 3.33×
- Total profit
- $61,572
- Equity at exit
- $8,171
Cash invested: $26,460 (down + closing). Projections, not guarantees.
Landlord ↔ Tenant lean methodology
- Overall (STATE)
- 62 Landlord-Friendly
- State Michigan
- 62 Landlord-Friendly · EVEN
- County
- — inherits STATE
- City
- — inherits STATE
ZIP-level market 49938
- Home prices YoY
- -23.3%
- Active inventory
- 70
- Price-to-rent
- 5.3×
Monthly cashflow live
- Estimated rent
- $1,484 medium interval (Pro) →
- Mortgage (P&I)
- −$496
- Tax from tax record
- −$93 /mo · $1,116/yr
- Insurance
- −$39
- HOA
- −$0
- Vacancy / Maint / Mgmt
- −$312
- Net cashflow
- $545
Break-even live
UW: 25.0% down · 7.5% · 30yr · 1.5% tax · 5.0% vac · 8.0% maint · 8.0% mgmt
Financing live
Cash to close
- Down payment
- $23,625
- Closing costs
- $2,835
- Reserves months
- —
- Total cash needed
- —
Loan-product check · same deal, 3 products live
Conventional
25% down · 7.5% · 30yr
- Down + closing
- —
- Monthly P&I
- —
- Monthly cashflow
- —
- DSCR
- —
- Eligible?
- —
Personal DTI + credit; lowest rate.
DSCR
20% down · 8.5% · 30yr
- Down + closing
- —
- Monthly P&I
- —
- Monthly cashflow
- —
- DSCR
- —
- Eligible?
- —
No personal income docs; deal must DSCR.
Hard money
10% down · 12.0% · 12mo
- Down + closing
- —
- Monthly P&I
- —
- Monthly cashflow
- —
- DSCR
- —
- Eligible?
- —
Short-term bridge; refi at stabilization.
Listing history 4 events
-
2026-06-18days on market $94,500 Active 3 DOM
-
2026-06-17days on market $94,500 Active 2 DOM
-
2026-06-16remarks 699-char remark
-
2026-06-16$94,500 Active 1 DOM
ⓘ Source: listings_history table (triggers on properties + properties_extension) + one-shot
backfill from property_details.listing_events for pre-trigger history.
Tax reassessment forecast MI · Partial reset (capped growth)
- Current annual tax
- $1,116 · $93/mo
- Projected year-2 tax
- $1,285 · $107/mo
- Expected delta
- +$170/yr (+$14/mo · 15.2%)
ⓘ Screening estimate from a state-policy table — verify with the county assessor before closing.
Climate risk First Street
- Flood 4/10 Moderate FEMA zone X · 22% chance over 30 yrs
- Wildfire 1/10 Low
- Heat 1/10 Low 7 d/yr ≥89°F today · 14 d/yr by 30 yrs out
- Wind 1/10 Low
- Air quality 1/10 Low 0 unhealthy d/yr today · 0 by 30 yrs out
Nearby sold comps map
Loading sold comps map…
Walkable amenities ~0.75 mi
Loading nearby amenities…
Taxation est. · year 1
- Rental income
- $17,811
- − Mortgage interest
- −$5,293
- − Property taxes
- −$1,116
- − Insurance
- −$472
- − Repairs & maintenance
- −$1,425
- − Management
- −$1,425
- − Depreciation
- −$2,749
- Taxable income
- $5,330
- Est. tax owed @ 24.0%
- −$1,279
- After-tax cash flow
- $5,256/yr
For passive investors: Depreciation is non-cash, so a rental often shows a tax loss while cash-flowing — sheltering income. Rental losses are passive: they offset passive income freely, and up to $25,000/yr can offset ordinary (W-2) income if you actively participate and your MAGI is under $100k (phasing out to $0 by $150k); unused losses carry forward. On sale, claimed depreciation is recaptured at up to 25%, and gains may owe capital-gains tax (a 1031 exchange can defer both). Figures are a year-1 estimate at your 24.0% rate — not tax advice; consult a CPA.
Schools (NCES district)
- District
- Ironwood Area Schools Of Gogebic County
- NCES district ID
- 2619470
- Math proficiency
- 23% ▼ -13.00%
- Reading proficiency
- 40% ▼ -5.00%
- Median HH income
- $33,313
- Composite
- 25.78/100
- National rank
- #7369
- State rank
- #361 of 540 in MI
Livability — Ironwood
- Score
- 70/100
- State rank
- #325
- US rank
- #8024
Category grades
Schools grade is shown separately in the Schools card above.
Census & demographics
- Census place
- Ironwood, MI
- Population (ZIP)
- 7,424
Population outlook (Gogebic County) Hauer SSP2
- Today (2025)
- 13,951 people
- By 2030
- 13,191 · -5.4%
- By 2040
- 11,739 · -15.9%
- By 2050
- 10,580 · -24.2%
- By 2075
- 8,530 · -38.9%
- By 2100
- 6,903 · -50.5%
Race, ethnicity, and origin ACS 2023
- Neighborhood character
- Predominantly White (94%)
- Race & ethnicity
- White 94% Two or more races 3% Hispanic / Latino 2%
- Common ancestry
- Romanian 10% Lithuanian 4% Portuguese 3%
- Foreign-born
- 1%
- Languages at home
- 97% English-only · Spanish 2%
Political lean MEDSL · Gogebic
- 2024 margin
- R (+17.1) · D 40.8% · R 57.9% · Other 1.2%
- 2008→2024 swing
- -34.4pp toward R · 2008: 17.3pp · 2024: -17.1pp
- All cycles
- 2024: R+17.1 2020: R+12.5 2016: R+15.0 2012: D+8.1 2008: D+17.3
Not yet ingested
- Civics
- —
Market trends
- HPI YoY
- ▼ -61.86%
- Current HPI
- 204.0924
- Rent YoY
- —
- Metro
- —
- State GDP YoY
- ▲ 1.37%
- F500 in state
- 28
Industry mix (Fortune 500 HQ in MI)
| Industry | F500 HQs | Revenue |
|---|---|---|
| Automotive Parts | 3 | $48B |
|
||
| Automotive | 2 | $372B |
|
||
| Chemicals | 1 | $45B |
|
||
| Automotive Retail | 1 | $29B |
|
||
| Healthcare / Medical Devices | 1 | $23B |
|
||
| Automotive Technology | 1 | $20B |
|
||
Price history
+374.9% since first listed6 events — show timeline
- 2026-06-15 Listed $94,500 UPAR
- 2026-06-15 Listed $94,500 MiRealSource-MiMLS
- 2018-05-17 Sold (MLS) $19,000 MiRealSource-MiMLS
- 2018-05-17 Sold (MLS) $19,000 UPAR
- 2018-04-25 Listed $19,900 MiRealSource-MiMLS
- 2018-04-25 Listed $19,900 UPAR
Property tax history
-1.7%/yrLatest (2024): $1,116 · -3.4% YoY. Source: county tax records.
Cash-flow waterfall
monthlySold comps — $/sqft
last 12 mo · ≤1 miLoading sold comps…