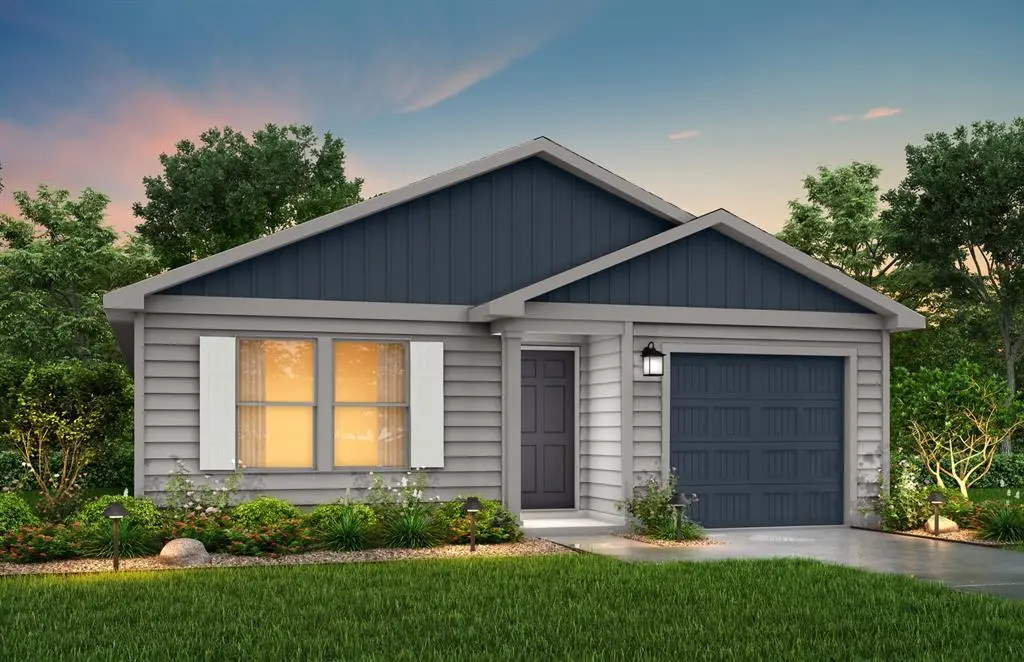
525 Don Ln · Itasca, TX
Flood risk No data
- FEMA flood zone
- —
- Chance of flooding over 30 yrs
- —
- Est. flood insurance / yr
- —
Fire risk No data
- Est. fire insurance / yr
- —
Heat risk No data
- Hot days now (above threshold)
- —
- Hot days in 30 yrs
- —
Wind risk No data
- Chance of severe wind over 30 yrs
- —
Air-quality risk No data
- Unhealthy air days now
- —
- Unhealthy air days in 30 yrs
- —
Risk factors via First Street. Map © Google.
Why this score? — see what drove the C- grade
The composite is a weighted blend of 9 inputs, each scored 0–100. Each bar is that input's sub-score; the figure is the points it added to the 100-point composite (weight × sub-score).
- Cash flow +12.7/30.0
- ARV discount +11.2/15.0
- Appreciation +10.0/10.0
- Condition / age +4.0/5.0
- DSCR +3.8/10.0
- 1% rule +3.6/10.0
- Livability +3.2/5.0
- Rent growth +2.5/5.0
- Schools +2.5/10.0
$199,990
🖨 Deal sheet 📄 Offer letter ✓ Due diligence
Listing remarks MLS
MLS# 21131633 - Built by NHC - Jul 2026 completion! ~ Model 1401 A1 - Yellowstone The Yellowstone Plan from our Freedom Series is thoughtfully designed for comfort and convenience, offering 4 bedrooms, 2 bathrooms, and 1,401 square feet of single-story living.As you enter the home, you’ll find three secondary bedrooms and a full bathroom, perfectly positioned to provide privacy and flexibility for family members or guests. Continue down the hall, and you’ll pass the conveniently located laundry room before reaching the heart of the home.The open-concept kitchen, complete with a central island, seamlessly overlooks the family room and dining area, creating a welcoming space for family time, meals, and for entertaining. Tucked off the dining area, the primary suite features a private bathroom and walk-in closet, offering a peaceful retreat from the rest of the home. Known for providing the lowest price and price per square foot, National Homecorp is here to help you get more home for your money! SELLER-Paid Closing Costs: Enjoy up to 3% closing cost contribution when you use NHC Lender and our preferred title company.
Key facts
- 5,663 sq ft lot
- Garage
- Built 2025
Neighborhood map
What this means for you Summary
Snapshot
- This is a 4-bed/2.0-bath single-family listed at $200k. Condition is rated good.
Deal economics
- At list price, monthly cash flow is $-24 ($-283/yr) — negative.
- To cash-flow at today's rent, offer at most $197k (1.7% below list).
- To meet the 1% rule (rent ≥ 1% of price), the offer needs to be $172k (14.0% below list).
- Recommended offer: $172k (14.0% below list) — sets the bar for 1% rule.
Location & tenants
- Location reads 63/100 on livability (#832 in TX) — a middle-class / working-renter tenant base. Strengths: cost of living A+, housing A+, crime A-; Watch: employment D, schools D-, amenities F.
- Itasca ISD (rural): math 23% / reading 35% proficiency, ranked #636 of 826 in TX (top 77%) — low school quality limits family demand, transient renter base, plan for 1-2y turnover; 63% free/reduced lunch — lower-income household profile, screen leases tightly.
- Market conditions: 83 active listings in the ZIP; 4 comparable units currently listed for rent nearby; rentals lingering (median 44d on market — plan ~5-8 weeks vacancy on turnover, expect pricing pressure); 75% of comp listings sitting > 30 days — soft ceiling on asking rent; 65 units permitted in Hill County in 2024 (0 in 5+ unit buildings).
Forward outlook
- In year one you build about $21k of equity ($1k loan paydown + $20k appreciation (10.0% local appreciation)).
- Hill County population projected at -12% by 2050 — secular population decline; favor cash flow + early exit over multi-decade hold.
- At projected returns (10.0% appreciation + 3.0% rent growth), your $56k cash investment doubles in ~3 years — after that, you're playing with house money.
- By year 2, paydown + projected appreciation supports a ~$34k cash-out refi (75% LTV) — recoverable capital for the next deal without selling this one.
Negotiation context
- It's been on market 168 days — a 12% lower offer ($176k) is reasonable based on typical stale-listing flexibility.
- 2 sale attempts with the ask held roughly flat each time — persistent listings suggest the price (not the market) is what's stuck; bring a comps-based counter.
Questions for the listing agent
- What do current leases actually rent for vs. the listed asking? Can we see a recent rent roll and the last 12 months of T-12 income?
- It's been on market 168 days. Have you received any prior offers? Is the seller open to a 14% concession, seller financing, or rate buy-down credit?
- Why hasn't it sold? Are there any deal-killer items the seller is aware of (foundation, flood, title, zoning, code violations)?
- Is there a deadline driving the sale (1031 exchange, divorce, estate, relocation)? That informs how much negotiation room exists.
- Schools are D-rated, which usually means shorter tenancies and higher turnover. Who's the typical renter profile here, and what's been the actual vacancy rate?
- What's the average days-on-market for RENTAL listings here right now (not sales)? A rising rental-DOM trend means longer vacancies and softer asking-rent achievability than the comps imply.
- What's the recent tenant-quality profile in this submarket — average credit score on applications, eviction rate, late-payment / NSF rate, and stable-employment percentage? A property-management company in the area should have these aggregated.
- How much new for-sale + rental construction is in the pipeline within 1–3 miles? Heavy new supply typically softens prices + rents 12–24 months out; constrained supply supports both.
Investment metrics
- 1% rule
- 0.86% ✗
- Cap rate
- 6.15%
- Cash-on-cash
- -0.51%
- DSCR
- 0.98
- GRM
- 9.7
CMA / ARV
- ARV (median comp)
- $217,703
- List price
- $199,990
- Delta
- -8.14%
- Verdict
- FAIR
- Comps
- 20 within 1.0 mi
Show comp detail 12 sales within ~0.75 mi
| Address | Dist | Beds/Ba | Sqft | Sold | Price | $/sf | Match |
|---|---|---|---|---|---|---|---|
| 526 Don Ln | 0.12mi | 4/2.0 | 1,401 (0%) | 10mo | $182,990 | $131 | 86 |
| 512 Don Ln | 0.06mi | 3/2.0 (-1) | 1,501 (+7%) | 8mo | $249,900 | $166 | 73 |
| 604 S Aquilla St | 0.10mi | 3/2.0 (-1) | 1,215 (-13%) | 1mo | $245,000 | $202 | 67 |
| 205 E South St | 0.31mi | 3/2.0 (-1) | 1,462 (+4%) | 7mo | $219,900 | $150 | 67 |
| 705 E South St | 0.43mi | 3/2.0 (-1) | 1,430 (+2%) | 10mo | $214,900 | $150 | 63 |
| 104 Beard Dr | 0.22mi | 3/2.5 (-1) | 1,562 (+12%) | 3mo | $130,000 | $83 | 61 |
| 604 E South St | 0.35mi | 3/2.0 (-1) | 1,534 (+10%) | 3mo | $249,999 | $163 | 61 |
| 202 E Henderson St | 0.37mi | 3/2.0 (-1) | 1,485 (+6%) | 13mo | $198,000 | $133 | 57 |
| 103 S Hooks St | 0.61mi | 3/2.0 (-1) | 1,416 (+1%) | 12mo | $282,000 | $199 | 55 |
| 301 S Lamar St | 0.38mi | 3/2.0 (-1) | 1,220 (-13%) | 5mo | $244,900 | $201 | 51 |
| 105 E North St | 0.68mi | 3/2.0 (-1) | 1,500 (+7%) | 2mo | $158,000 | $105 | 50 |
| 104 S College St | 0.54mi | 3/1.0 (-1) | 1,232 (-12%) | 9mo | $99,999 | $81 | 39 |
Match score weights: distance 35% · size 25% · config 20% · recency 20%. Top-matched comps best support the ARV.
Projected returns pro-forma
10.0% appreciation · 3.0% rent growth · sell at horizon
- IRR
- 23.9%
- Equity multiple
- 2.92×
- Total profit
- $107,444
- Equity at exit
- $180,167
- IRR
- 21.2%
- Equity multiple
- 6.67×
- Total profit
- $317,637
- Equity at exit
- $388,537
Cash invested: $55,997 (down + closing). Projections, not guarantees.
Landlord ↔ Tenant lean methodology
- Overall (STATE)
- 87 Strongly Landlord-Friendly
- State Texas
- 87 Strongly Landlord-Friendly · R+5
- County
- — inherits STATE
- City
- — inherits STATE
ZIP-level market 76055
- Home prices YoY
- 4.1%
- Active inventory
- 83
- Price-to-rent
- 9.7×
Monthly cashflow live
- Estimated rent
- $1,720 medium interval (Pro) →
- Mortgage (P&I)
- −$1,049
- Tax est. 1.5%
- −$250 /mo · $3,000/yr
- Insurance
- −$83
- HOA
- −$0
- Vacancy / Maint / Mgmt
- −$361
- Net cashflow
- $-24
Break-even live
UW: 25.0% down · 7.5% · 30yr · 1.5% tax · 5.0% vac · 8.0% maint · 8.0% mgmt
Financing live
Cash to close
- Down payment
- $49,998
- Closing costs
- $6,000
- Reserves months
- —
- Total cash needed
- —
Loan-product check · same deal, 3 products live
Conventional
25% down · 7.5% · 30yr
- Down + closing
- —
- Monthly P&I
- —
- Monthly cashflow
- —
- DSCR
- —
- Eligible?
- —
Personal DTI + credit; lowest rate.
DSCR
20% down · 8.5% · 30yr
- Down + closing
- —
- Monthly P&I
- —
- Monthly cashflow
- —
- DSCR
- —
- Eligible?
- —
No personal income docs; deal must DSCR.
Hard money
10% down · 12.0% · 12mo
- Down + closing
- —
- Monthly P&I
- —
- Monthly cashflow
- —
- DSCR
- —
- Eligible?
- —
Short-term bridge; refi at stabilization.
Rent comps 4 comps
| Address | Beds | Baths | Sqft | Rent | $/sqft | DOM | Units | Dist |
|---|---|---|---|---|---|---|---|---|
| 111 Minnie Dr Itasca, TX | 3.0 | 2.0 | 1250 | $1,775 | $1.42 | 43d | 1 | 0.31mi |
| 202 E Henderson St Itasca, TX | 3.0 | 2.0 | 1485 | $1,750 | $1.18 | 11d | 1 | 0.40mi |
| 108 E Adams St Itasca, TX | 3.0 | 2.0 | 1188 | $1,650 | $1.39 | 43d | 1 | 0.48mi |
| 106 W Adams St Itasca, TX | 3.0 | 2.0 | 1174 | $1,650 | $1.41 | 43d | 1 | 0.55mi |
Listing history 11 events
-
2026-05-14price $199,990 1145-char remark
Show marketing remark (27 chars)
Model 1401 A1 - Yellowstone
-
2026-05-14price $199,990 27-char remark
Show marketing remark (27 chars)
Model 1401 A1 - Yellowstone
-
2026-04-03price $215,990 1145-char remark
Show marketing remark (27 chars)
Model 1401 A1 - Yellowstone
-
2026-04-03price $215,990 27-char remark
Show marketing remark (27 chars)
Model 1401 A1 - Yellowstone
-
2026-03-31price $211,990 1145-char remark
Show marketing remark (27 chars)
Model 1401 A1 - Yellowstone
-
2026-03-31price $211,990 27-char remark
Show marketing remark (27 chars)
Model 1401 A1 - Yellowstone
-
2026-03-31price $212,990 27-char remark
Show marketing remark (27 chars)
Model 1401 A1 - Yellowstone
-
2025-12-22price $211,100 1145-char remark
Show marketing remark (1145 chars)
MLS# 21131633 - Built by NHC - Jul 2026 completion! ~ Model 1401 A1 - Yellowstone The Yellowstone Plan from our Freedom Series is thoughtfully designed for comfort and convenience, offering 4 bedrooms, 2 bathrooms, and 1,401 square feet of single-story living.As you enter the home, you’ll find three secondary bedrooms and a full bathroom, perfectly positioned to provide privacy and flexibility for family members or guests. Continue down the hall, and you’ll pass the conveniently located laundry room before reaching the heart of the home.The open-concept kitchen, complete with a central island, seamlessly overlooks the family room and dining area, creating a welcoming space for family time, meals, and for entertaining. Tucked off the dining area, the primary suite features a private bathroom and walk-in closet, offering a peaceful retreat from the rest of the home. Known for providing the lowest price and price per square foot, National Homecorp is here to help you get more home for your money! SELLER-Paid Closing Costs: Enjoy up to 3% closing cost contribution when you use NHC Lender and our preferred title company.
-
2025-12-12$210,100 Active 1145-char remark
Show marketing remark (27 chars)
Model 1401 A1 - Yellowstone
-
2025-12-12price $211,100 27-char remark
Show marketing remark (27 chars)
Model 1401 A1 - Yellowstone
-
2025-12-10$210,100 Active 27-char remark
Show marketing remark (27 chars)
Model 1401 A1 - Yellowstone
ⓘ Source: listings_history table (triggers on properties + properties_extension) + one-shot
backfill from property_details.listing_events for pre-trigger history.
Nearby sold comps map
Loading sold comps map…
Walkable amenities ~0.75 mi
Loading nearby amenities…
Taxation est. · year 1
- Rental income
- $20,635
- − Mortgage interest
- −$11,203
- − Property taxes
- −$3,000
- − Insurance
- −$1,000
- − Repairs & maintenance
- −$1,651
- − Management
- −$1,651
- − Depreciation
- −$5,818
- Taxable loss
- −$3,686
- Est. tax savings @ 24.0%
- +$885
- After-tax cash flow
- $602/yr
For passive investors: Depreciation is non-cash, so a rental often shows a tax loss while cash-flowing — sheltering income. Rental losses are passive: they offset passive income freely, and up to $25,000/yr can offset ordinary (W-2) income if you actively participate and your MAGI is under $100k (phasing out to $0 by $150k); unused losses carry forward. On sale, claimed depreciation is recaptured at up to 25%, and gains may owe capital-gains tax (a 1031 exchange can defer both). Figures are a year-1 estimate at your 24.0% rate — not tax advice; consult a CPA.
Condition & rehab AI · 12 photos
This home is in excellent condition with modern finishes and a well-maintained exterior. It offers a good return on investment with minimal updates needed.
Value-add opportunities
- Both Painting exterior and interior walls — Fresh paint enhances curb appeal and interior aesthetics
- Both Landscaping improvements — Enhances curb appeal and adds value
- Resale Kitchen appliances — Modern appliances improve functionality and appeal to potential buyers
Renovation cost estimate screening
Value-add ROI direction
- Both Painting exterior and interior walls — Fresh paint enhances curb appeal and interior aesthetics ↑
- Both Landscaping improvements — Enhances curb appeal and adds value ↑
- Resale Kitchen appliances — Modern appliances improve functionality and appeal to potential buyers ↑
ⓘ Cost ranges are severity-bucket heuristics (US national rule-of-thumb). Get contractor quotes + a written scope before underwriting a rehab budget.
Schools (NCES district)
- District
- Itasca ISD
- NCES district ID
- 4824480
- Math proficiency
- 23% ▼ -8.00%
- Reading proficiency
- 35% ▼ -1.00%
- Median HH income
- $49,224
- Composite
- 25.26/100
- National rank
- #7499
- State rank
- #636 of 826 in TX
Livability — Itasca
- Score
- 63/100
- State rank
- #832
- US rank
- #14977
Category grades
Schools grade is shown separately in the Schools card above.
Census & demographics
- Census place
- Itasca, TX
- City population
- 3,719
- Population (ZIP)
- 3,719
Population outlook (Hill County) Hauer SSP2
- Today (2025)
- 34,013 people
- By 2030
- 33,289 · -2.1%
- By 2040
- 31,688 · -6.8%
- By 2050
- 30,100 · -11.5%
- By 2075
- 26,818 · -21.2%
- By 2100
- 22,918 · -32.6%
Race, ethnicity, and origin ACS 2023
- Neighborhood character
- Majority White (60%)
- Race & ethnicity
- White 60% Hispanic / Latino 30% Two or more races 9% Black 6%
- Hispanic origin (detail)
- Mexican 29%
- Common ancestry
- Lithuanian 2% Slovak 1% Italian 1%
- Foreign-born
- 5% · Canada
- Languages at home
- 87% English-only · Spanish 11% German/W. Germanic 1% French/Haitian/Cajun 1%
Political lean MEDSL · Hill
- 2024 margin
- Solid R (+64.4) · D 17.5% · R 81.8%
- 2008→2024 swing
- -23.0pp toward R · 2008: -41.4pp · 2024: -64.4pp
- All cycles
- 2024: R+64.4 2020: R+60.7 2016: R+58.4 2012: R+53.0 2008: R+41.4
Not yet ingested
- Civics
- —
Market trends
- HPI YoY
- ▲ 10.37%
- Current HPI
- 264.5221
- Rent YoY
- —
- Metro
- —
- State GDP YoY
- ▲ 3.95%
- F500 in state
- 110
Industry mix (Fortune 500 HQ in TX)
| Industry | F500 HQs | Revenue |
|---|---|---|
| Energy | 16 | $1,198B |
|
||
| Technology | 5 | $198B |
|
||
| Engineering / Construction | 4 | $72B |
|
||
| Energy Services | 3 | $60B |
|
||
| Utilities | 3 | $41B |
|
||
| Healthcare | 2 | $330B |
|
||
Price history
-4.8% since first listed11 events — show timeline
- 2026-05-14 Price Changed $199,990 NTREIS
- 2026-05-14 Price Changed $199,990 Zillow
- 2026-04-03 Price Changed $215,990 NTREIS
- 2026-04-03 Price Changed $215,990 Zillow
- 2026-03-31 Price Changed $211,990 NTREIS
- 2026-03-31 Price Changed $211,990 Zillow
- 2026-03-31 Price Changed $212,990 Zillow
- 2025-12-22 Price Changed $211,100 NTREIS
- 2025-12-12 Listed $210,100 NTREIS
- 2025-12-12 Price Changed $211,100 Zillow
- 2025-12-10 Listed $210,100 Zillow
Cash-flow waterfall
monthlySold comps — $/sqft
last 12 mo · ≤1 miLoading sold comps…