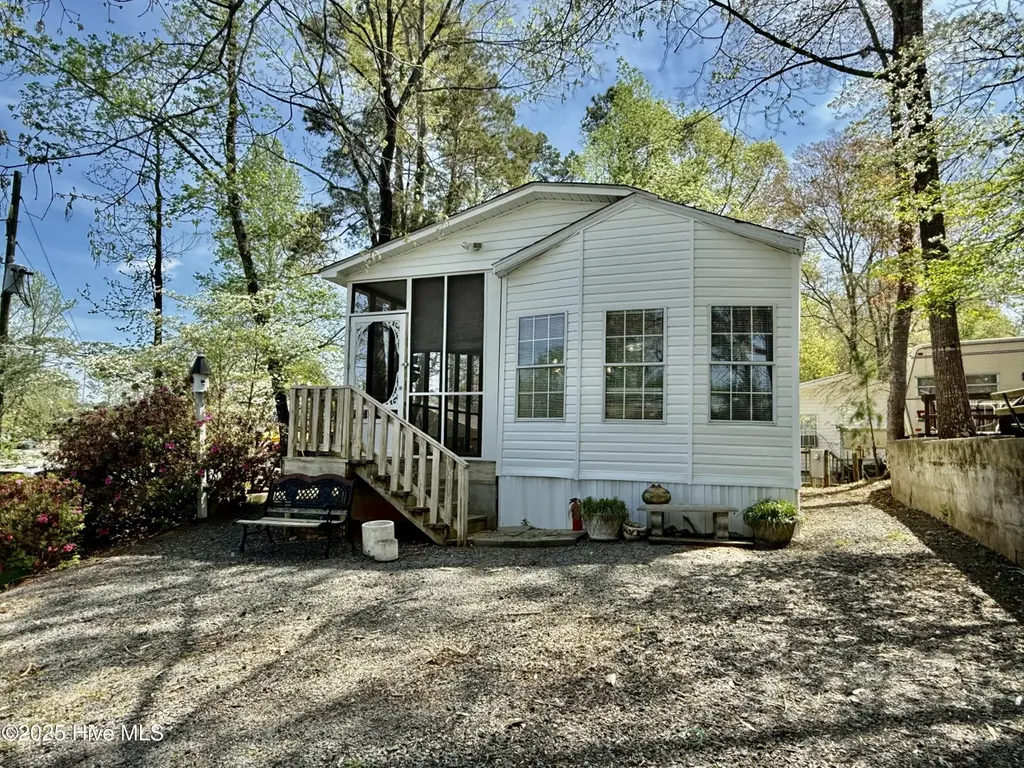
120 Overland Trl · Norwood, NC
Flood risk 1/10 · Minimal
- FEMA flood zone
- X (unshaded)
- Chance of flooding over 30 yrs
- 0.0%
- Est. flood insurance / yr
- $507 – $1,088
Fire risk 3/10 · Minor
- Est. fire insurance / yr
- $906 – $1,684
Heat risk 6/10 · Moderate
- Hot days now (above 108°F)
- 7 days/yr
- Hot days in 30 yrs
- 16 days/yr
Wind risk 6/10 · Moderate
- Chance of severe wind over 30 yrs
- 27.0%
Air-quality risk 2/10 · Minimal
- Unhealthy air days now
- 2 days/yr
- Unhealthy air days in 30 yrs
- 2 days/yr
Risk factors via First Street. Map © Google.
Why this score? — see what drove the F grade
The composite is a weighted blend of 9 inputs, each scored 0–100. Each bar is that input's sub-score; the figure is the points it added to the 100-point composite (weight × sub-score).
- Cash flow +11.2/30.0
- Appreciation +4.5/10.0
- DSCR +3.3/10.0
- Livability +3.2/5.0
- Schools +2.6/10.0
- Rent growth +2.5/5.0
- Condition / age +2.5/5.0
- 1% rule +2.4/10.0
- ARV discount +0.0/15.0
$169,000
🖨 Deal sheet 📄 Offer letter ✓ Due diligence
Listing remarks
This beautiful Park Model home is located directly across from the community pool in Twin Harbor Camping Resort. An enormous screened porch spans the entire home. This would make a great sleeping porch along with additional gathering space for entertaining. All furnishings are included. Behind the home is a large outbuilding that is currently being used for storage for the golf cart that is included in the sale as well. This move in ready Lake Tillery getaway is one of a kind. Make your appointment today to view this centrally located Twin Harbor beauty.
Key facts
- Lake tillery getaway
- Community pool
- Park model home
Tags
Property features AI
Finance
- Other: Located in Twin Harbor Camping Resort
- HOA & community: Part of a homeowners association; Annual association fee of $520; Community amenities include boat dock, gated entry, playground, sport court, and pool
Exterior
- Parking: Gravel off-street parking
- Utilities: Water connected
- Home design: Manufactured home (Residential); One story; Entry level: 1
- Construction: Vinyl siding; See remarks for additional construction and foundation details
- Exterior features: Screened porch; No fencing; Composition roof; Paved road access; Private road frontage; Has a view
Interior
- Bedrooms: Total of 3 rooms (includes bedrooms and living areas)
- Bathrooms: 1 full bathroom
- Heating & cooling: Central air conditioning; Electric heating with heat pump
- Interior features: Ceiling fan(s); Furnished
Neighborhood map
What this means for you Summary
Snapshot
- This is a 1-bed/1.0-bath manufactured listed at $169k.
Deal economics
- At list price, monthly cash flow is $-64 ($-770/yr) — negative.
- To cash-flow at today's rent, offer at most $158k (6.7% below list).
- To meet the 1% rule (rent ≥ 1% of price), the offer needs to be $124k (26.3% below list).
- Recommended offer: $124k (26.3% below list) — sets the bar for 1% rule.
- Cap rate 5.8% vs local median 2.9% in Norwood — top-decile yield for the area; either an underpriced asset or a hidden risk that comps aren't pricing in. Stress-test before assuming the spread holds.
Location & tenants
- Location reads 63/100 on livability (#410 in NC) — a middle-class / working-renter tenant base. Strengths: cost of living A+, housing A+, crime A; Watch: amenities F, commute F, employment D-.
- Montgomery County Schools (rural): math 29% / reading 34% proficiency, ranked #143 of 178 in NC (top 80%) — families likely to look elsewhere, expect single-tenant / working-renter base with shorter leases; 66% free/reduced lunch — lower-income household profile, screen leases tightly.
- Zoned schools: Mount Gilead Elementary (math 27% / reading 32%, grade F, #975 of 1,410 statewide, top 71%, 213 students, 87% FRL); West Middle (math 20% / reading 31%, grade F, #388 of 475 statewide, top 83%, 309 students, 72% FRL); Montgomery Central High (math 42% / reading 39%, grade F, #387 of 535 statewide, top 73%, 893 students, 73% FRL).
- Market conditions: 113 active listings in the ZIP; 138 units permitted in Montgomery County in 2024 (0 in 5+ unit buildings).
Forward outlook
- Local home prices are declining (-0.9%/yr); year-one equity from $1k of loan paydown is wiped out by about $2k of value loss. Plan a longer hold.
- Montgomery County population projected at -17% by 2050 — secular population decline; favor cash flow + early exit over multi-decade hold.
Negotiation context
- It's been on market 43 days — a 3% lower offer ($164k) is reasonable based on typical stale-listing flexibility.
- 2 sale attempts with the ask held roughly flat each time — persistent listings suggest the price (not the market) is what's stuck; bring a comps-based counter.
- Current owner paid $14k; list at $169k implies a 1107% gain — meaningful room to come down on a strong offer.
Risks & watch-outs
- Climate carrying-cost: major wind risk, 27% chance of damaging wind over 30y; extreme-heat days projected 7→16/yr by 2055 (HVAC capex compounding) — expect insurance premiums to compound above CPI over the hold.
Questions for the listing agent
- What do current leases actually rent for vs. the listed asking? Can we see a recent rent roll and the last 12 months of T-12 income?
- It's been on market 43 days. Have you received any prior offers? Is the seller open to a 26% concession, seller financing, or rate buy-down credit?
- What does the HOA fee cover, when was the last increase, and are there any pending special assessments or reserve-fund shortfalls?
- Is there a deadline driving the sale (1031 exchange, divorce, estate, relocation)? That informs how much negotiation room exists.
- Schools are F-rated, which usually means shorter tenancies and higher turnover. Who's the typical renter profile here, and what's been the actual vacancy rate?
- The area grade is low — what's the realistic commute time and amenity access for the typical tenant pool here? Any planned neighborhood developments (good or bad) we should know about?
- What's the average days-on-market for RENTAL listings here right now (not sales)? A rising rental-DOM trend means longer vacancies and softer asking-rent achievability than the comps imply.
- What's the recent tenant-quality profile in this submarket — average credit score on applications, eviction rate, late-payment / NSF rate, and stable-employment percentage? A property-management company in the area should have these aggregated.
- How much new for-sale + rental construction is in the pipeline within 1–3 miles? Heavy new supply typically softens prices + rents 12–24 months out; constrained supply supports both.
Investment metrics
- 1% rule
- 0.74% ✗
- Cap rate
- 5.84%
- Cash-on-cash
- -1.63%
- DSCR
- 0.93
- GRM
- 11.3
CMA / ARV
- ARV (on-the-fly)
- $133,560
- Comps found
- 2
Show comp detail 2 sales within ~0.75 mi
| Address | Dist | Beds/Ba | Sqft | Sold | Price | $/sf | Match |
|---|---|---|---|---|---|---|---|
| 152 Hollywood Cir | 0.06mi | 1/1.0 | 408 (-3%) | 11mo | $50,000 | $123 | 83 |
| 200 Lake Tillery Trl | 0.07mi | 1/1.0 | 400 (-5%) | 22mo | $127,000 | $318 | 70 |
Match score weights: distance 35% · size 25% · config 20% · recency 20%. Top-matched comps best support the ARV.
Projected returns pro-forma
-0.94% appreciation · 3.0% rent growth · sell at horizon
- IRR
- -8.0%
- Equity multiple
- 0.65×
- Total profit
- $-16,395
- Equity at exit
- $41,297
- IRR
- -1.2%
- Equity multiple
- 0.88×
- Total profit
- $-5,509
- Equity at exit
- $43,794
Cash invested: $47,320 (down + closing). Projections, not guarantees.
Landlord ↔ Tenant lean methodology
- Overall (STATE)
- 85 Strongly Landlord-Friendly
- State North Carolina
- 85 Strongly Landlord-Friendly · R+3
- County
- — inherits STATE
- City
- — inherits STATE
ZIP-level market 27306
- Home prices YoY
- -0.3%
- Active inventory
- 113
- Price-to-rent
- 11.3×
Monthly cashflow live
- Estimated rent
- $1,245 medium interval (Pro) →
- Mortgage (P&I)
- −$886
- Tax from tax record
- −$48 /mo · $574/yr
- Insurance
- −$70
- HOA
- −$43
- Vacancy / Maint / Mgmt
- −$261
- Net cashflow
- $-64
Break-even live
UW: 25.0% down · 7.5% · 30yr · 1.5% tax · 5.0% vac · 8.0% maint · 8.0% mgmt
Financing live
Cash to close
- Down payment
- $42,250
- Closing costs
- $5,070
- Reserves months
- —
- Total cash needed
- —
Loan-product check · same deal, 3 products live
Conventional
25% down · 7.5% · 30yr
- Down + closing
- —
- Monthly P&I
- —
- Monthly cashflow
- —
- DSCR
- —
- Eligible?
- —
Personal DTI + credit; lowest rate.
DSCR
20% down · 8.5% · 30yr
- Down + closing
- —
- Monthly P&I
- —
- Monthly cashflow
- —
- DSCR
- —
- Eligible?
- —
No personal income docs; deal must DSCR.
Hard money
10% down · 12.0% · 12mo
- Down + closing
- —
- Monthly P&I
- —
- Monthly cashflow
- —
- DSCR
- —
- Eligible?
- —
Short-term bridge; refi at stabilization.
HOA detail
- Monthly dues
- $43 · $516/yr
- Likely covers
- pool
Listing history 20 events
-
2026-06-18days on market $169,000 Active 43 DOM
-
2026-06-17days on market $169,000 Active 42 DOM
-
2026-06-16days on market $169,000 Active 41 DOM
-
2026-06-15days on market $169,000 Active 40 DOM
-
2026-06-14days on market $169,000 Active 38 DOM
-
2026-06-13days on market $169,000 Active 37 DOM
-
2026-06-10days on market $169,000 Active 35 DOM
-
2026-06-09days on market $169,000 Active 34 DOM
-
2026-06-08days on market $169,000 Active 33 DOM
-
2026-06-07days on market $169,000 Active 32 DOM
-
2026-06-05days on market $169,000 Active 29 DOM
-
2026-06-03days on market $169,000 Active 28 DOM
-
2026-06-02days on market $169,000 Active 27 DOM
-
2026-06-01days on market $169,000 Active 26 DOM
-
2026-05-31days on market $169,000 Active 25 DOM
-
2026-05-31days on market $169,000 Active 24 DOM
-
2025-11-24historical
-
2025-05-24$188,900 Active
-
2025-05-24$169,000 Active
-
2007-02-02soldstatus $14,000
ⓘ Source: listings_history table (triggers on properties + properties_extension) + one-shot
backfill from property_details.listing_events for pre-trigger history.
Tax reassessment forecast NC · Resets to sale price
- Current annual tax
- $574 · $48/mo
- Projected year-2 tax
- $1,386 · $115/mo
- Expected delta
- +$811/yr (+$68/mo · 141.3%)
ⓘ Screening estimate from a state-policy table — verify with the county assessor before closing.
Climate risk First Street
- Flood 1/10 Low FEMA zone X (unshaded) · 0% chance over 30 yrs
- Wildfire 3/10 Moderate
- Heat 6/10 Major 7 d/yr ≥108°F today · 16 d/yr by 30 yrs out
- Wind 6/10 Major 27% chance of damaging wind over 30 yrs
- Air quality 2/10 Low 2 unhealthy d/yr today · 2 by 30 yrs out
Nearby sold comps map
Loading sold comps map…
Walkable amenities ~0.75 mi
Loading nearby amenities…
Taxation est. · year 1
- Rental income
- $14,937
- − Mortgage interest
- −$9,467
- − Property taxes
- −$574
- − Insurance
- −$845
- − Repairs & maintenance
- −$1,195
- − Management
- −$1,195
- − HOA
- −$516
- − Depreciation
- −$4,916
- Taxable loss
- −$3,771
- Est. tax savings @ 24.0%
- +$905
- After-tax cash flow
- $135/yr
For passive investors: Depreciation is non-cash, so a rental often shows a tax loss while cash-flowing — sheltering income. Rental losses are passive: they offset passive income freely, and up to $25,000/yr can offset ordinary (W-2) income if you actively participate and your MAGI is under $100k (phasing out to $0 by $150k); unused losses carry forward. On sale, claimed depreciation is recaptured at up to 25%, and gains may owe capital-gains tax (a 1031 exchange can defer both). Figures are a year-1 estimate at your 24.0% rate — not tax advice; consult a CPA.
Schools (NCES district)
- District
- Montgomery County Schools
- NCES district ID
- 3703060
- Math proficiency
- 29% ▼ -6.00%
- Reading proficiency
- 34% ▼ -2.00%
- Median HH income
- $34,706
- Composite
- 25.97/100
- National rank
- #7328
- State rank
- #143 of 178 in NC
Livability — Norwood
- Score
- 63/100
- State rank
- #410
- US rank
- #15485
Category grades
Schools grade is shown separately in the Schools card above.
Census & demographics
- Population (ZIP)
- 5,457
Population outlook (Montgomery County) Hauer SSP2
- Today (2025)
- 26,533 people
- By 2030
- 25,724 · -3.0%
- By 2040
- 23,842 · -10.1%
- By 2050
- 22,077 · -16.8%
- By 2075
- 18,754 · -29.3%
- By 2100
- 15,537 · -41.4%
Race, ethnicity, and origin ACS 2023
- Neighborhood character
- Majority White (64%)
- Race & ethnicity
- White 64% Black 26% Asian 6% Hispanic / Latino 2% Two or more races 2%
- Common ancestry
- Slovak 2% Serbian 1% Iranian 1%
- Foreign-born
- 6% · China, Canada, Philippines
- Languages at home
- 92% English-only · Other Asian/Pacific 5% Spanish 2% Chinese 1%
Political lean MEDSL · Montgomery
- 2024 margin
- Solid R (+37.8) · D 30.8% · R 68.6%
- 2008→2024 swing
- -26.9pp toward R · 2008: -11.0pp · 2024: -37.8pp
- All cycles
- 2024: R+37.8 2020: R+31.8 2016: R+25.9 2012: R+15.2 2008: R+11.0
Not yet ingested
- Civics
- —
Market trends
- HPI YoY
- ▼ -0.94%
- Current HPI
- 334.2599
- Rent YoY
- —
- Metro
- —
- State GDP YoY
- ▲ 3.28%
- F500 in state
- 26
Industry mix (Fortune 500 HQ in NC)
| Industry | F500 HQs | Revenue |
|---|---|---|
| Financial Services | 2 | $213B |
|
||
| Retail | 2 | $95B |
|
||
| Industrial Conglomerate | 1 | $38B |
|
||
| Metals / Steel | 1 | $35B |
|
||
| Utilities | 1 | $30B |
|
||
| Industrial Machinery | 1 | $19B |
|
||
Price history
+1107.1% since first listed4 events — show timeline
- 2025-11-24 Listing Removed — Hive MLS
- 2025-05-24 Listed $169,000 Hive MLS
- 2025-05-24 Listed $188,900 Hive MLS
- 2007-02-02 Sold (Public Records) $14,000 Public Records
Property tax history
+5.1%/yrLatest (2021): $574 · +0.0% YoY. Source: county tax records.
Cash-flow waterfall
monthlySold comps — $/sqft
last 12 mo · ≤1 miLoading sold comps…