18 N Baldwin Pl · East Massapequa, NY
Flood risk 1/10 · Minimal
- FEMA flood zone
- X (unshaded)
- Chance of flooding over 30 yrs
- 0.0%
- Est. flood insurance / yr
- $507 – $1,088
Fire risk 1/10 · Minimal
- Est. fire insurance / yr
- $691 – $1,283
Heat risk 6/10 · Moderate
- Hot days now (above 94°F)
- 7 days/yr
- Hot days in 30 yrs
- 17 days/yr
Wind risk 6/10 · Moderate
- Chance of severe wind over 30 yrs
- 72.0%
Air-quality risk 4/10 · Minor
- Unhealthy air days now
- 5 days/yr
- Unhealthy air days in 30 yrs
- 7 days/yr
Risk factors via First Street. Map © Google.
Why this score? — see what drove the D grade
The composite is a weighted blend of 9 inputs, each scored 0–100. Each bar is that input's sub-score; the figure is the points it added to the 100-point composite (weight × sub-score).
- Cash flow +20.6/30.0
- DSCR +6.6/10.0
- 1% rule +5.6/10.0
- Livability +3.7/5.0
- Rent growth +2.5/5.0
- Condition / age +2.5/5.0
- Schools +2.4/10.0
- ARV discount +0.0/15.0
- Appreciation +0.0/10.0
$399,000
🖨 Deal sheet (PDF) 📄 Offer letter ✓ Due diligence
Listing remarks MLS
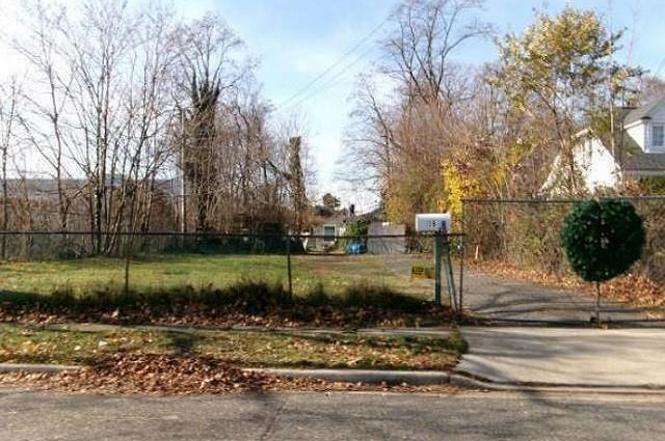
Investment opportunity in Massapequa, NY. Home shows it was built in 1913 and sits on a good size lot of approx. 11,761 sq. ft. Roll up your sleeves and put your designer touches to make this a dream home. Buyers check with City, County, Zoning, Tax, and other records to their satisfaction. AS-IS REO property. Additional Information: ParkingFeatures:1 Car Attached,
Key facts
- 0.27 acre lot
- Garage
- Built 1913
Property features AI
Exterior
- Parking: Assigned parking; Three-space carport; One-car garage
- Utilities: Electricity connected; Sewer: other
- Home design: Single-family residence
- Construction: Frame construction
- Exterior features: Frame construction; Not waterfront
Interior
- Kitchen: No appliances listed
- Bedrooms: Includes a bedroom on the first floor
- Bathrooms: One full bathroom
- Heating & cooling: Oil heating; No central cooling
- Interior features: First-floor bedroom; Five total rooms
- Laundry & utility: No laundry appliances listed
Neighborhood map
What this means for you Summary
Snapshot
- This is a 3-bed/1.0-bath single-family listed at $399k.
Deal economics
- At list price, monthly cash flow is $534 ($6k/yr) — positive.
- The deal already cash-flows at list — no discount required.
- Meets the 1% rule at list price ($4k rent vs $399k).
- Cap rate 7.9% vs local median 2.7% in East Massapequa — top-decile yield for the area; either an underpriced asset or a hidden risk that comps aren't pricing in. Stress-test before assuming the spread holds.
Location & tenants
- Location reads 74/100 on livability (#287 in NY, #4,601 nationally) — a middle-class / working-renter tenant base. Strengths: commute A+, employment A+, housing A+; Watch: amenities F, cost of living F.
- Amityville Union Free School District (suburban): math 23% / reading 28% proficiency, ranked #579 of 590 in NY (top 98%) — low school quality limits family demand, transient renter base, plan for 1-2y turnover; 62% free/reduced lunch — lower-income household profile, screen leases tightly.
- Zoned schools: Northwest Elementary School (564 students, 62% FRL); Edmund W Miles Middle School (math 10% / reading 30%, grade F, #666 of 729 statewide, top 93%, 599 students, 75% FRL).
- Market conditions: 268 active listings in the ZIP; 3 comparable units currently listed for rent nearby; rentals leasing fast (median 0d on market — plan ~1-2 weeks tenant-placement turnaround); 824 units permitted in Nassau County in 2024 (153 in 5+ unit buildings).
Forward outlook
- Local home prices are declining (-3.0%/yr); year-one equity from $3k of loan paydown is wiped out by about $12k of value loss. Plan a longer hold.
- Nassau County population projected at +7% by 2050 — modest demand growth; plan on rents tracking national, not racing it.
Negotiation context
- Only 5 days on market — expect competitive offers; lowballing is unlikely to land.
- 2 sale attempts since 3y ago with the ask held roughly flat each time — persistent listings suggest the price (not the market) is what's stuck; bring a comps-based counter.
- Current owner paid $268k; 49% above their basis — modest negotiation headroom, anchor on the comps not their cost.
Risks & watch-outs
- Watch-outs: built in 1913 — expect roof / HVAC / electrical / plumbing capex.
- Climate carrying-cost: major wind risk, 72% chance of damaging wind over 30y; extreme-heat days projected 7→17/yr by 2055 (HVAC capex compounding) — expect insurance premiums to compound above CPI over the hold.
Questions for the listing agent
- Built in 1913 — when were the roof, HVAC, electrical panel, plumbing, and water heater last replaced?
- Is there a deadline driving the sale (1031 exchange, divorce, estate, relocation)? That informs how much negotiation room exists.
- Schools are B-rated — typically a magnet for longer-tenancy family renters. What's the average tenant stay here, and is there a school-zone premium baked into asking?
- The area grade is low — what's the realistic commute time and amenity access for the typical tenant pool here? Any planned neighborhood developments (good or bad) we should know about?
- What's the average days-on-market for RENTAL listings here right now (not sales)? A rising rental-DOM trend means longer vacancies and softer asking-rent achievability than the comps imply.
- What's the recent tenant-quality profile in this submarket — average credit score on applications, eviction rate, late-payment / NSF rate, and stable-employment percentage? A property-management company in the area should have these aggregated.
- How much new for-sale + rental construction is in the pipeline within 1–3 miles? Heavy new supply typically softens prices + rents 12–24 months out; constrained supply supports both.
Investment metrics
- 1% rule
- 1.06% ✓
- Cap rate
- 7.90%
- Cash-on-cash
- 5.73%
- DSCR
- 1.26
- GRM
- 7.9
CMA / ARV
- ARV (on-the-fly)
- $268,380
- Comps found
- 1
Show comp detail 1 sale within ~0.75 mi
| Address | Dist | Beds/Ba | Sqft | Sold | Price | $/sf | Match |
|---|---|---|---|---|---|---|---|
| 18 N Baldwin Pl | 0.00mi | 4/1.0 (+1) | 710 (0%) | 23mo | $268,500 | $378 | 76 |
Match score weights: distance 35% · size 25% · config 20% · recency 20%. Top-matched comps best support the ARV.
Projected returns pro-forma
-3.0% appreciation · 3.0% rent growth · sell at horizon
- IRR
- -7.4%
- Equity multiple
- 0.73×
- Total profit
- $-30,571
- Equity at exit
- $59,492
- IRR
- 2.2%
- Equity multiple
- 1.16×
- Total profit
- $17,531
- Equity at exit
- $34,498
Cash invested: $111,720 (down + closing). Projections, not guarantees.
Landlord ↔ Tenant lean methodology
- Overall (STATE)
- 15 Strongly Tenant-Friendly
- State New York
- 15 Strongly Tenant-Friendly · D+10
- County
- — inherits STATE
- City
- — inherits STATE
ZIP-level market 11758
- Active inventory
- 268
- Price-to-rent
- 7.9×
Monthly cashflow live
- Estimated rent
- $4,230 medium interval (Pro) →
- Mortgage (P&I)
- −$2,092
- Tax from tax record
- −$549 /mo · $6,593/yr
- Insurance
- −$166
- HOA
- −$0
- Vacancy / Maint / Mgmt
- −$888
- Net cashflow
- $534
Break-even live
Sensitivity live
| Price | -10% $760 | -5% $647 | +0% $534 | +5% $421 | +10% $308 |
|---|---|---|---|---|---|
| Rent | -10% $199 | -5% $367 | +0% $534 | +5% $701 | +10% $868 |
| Rate | -1.0pp $735 | -0.5pp $635 | base $534 | +0.5pp $430 | +1.0pp $325 |
UW: 25.0% down · 7.5% · 30yr · 1.5% tax · 5.0% vac · 8.0% maint · 8.0% mgmt
Financing live
Cash to close
- Down payment
- $99,750
- Closing costs
- $11,970
- Reserves months
- —
- Total cash needed
- —
Loan-product check · same deal, 3 products live
Conventional
25% down · 7.5% · 30yr
- Down + closing
- —
- Monthly P&I
- —
- Monthly cashflow
- —
- DSCR
- —
- Eligible?
- —
Personal DTI + credit; lowest rate.
DSCR
20% down · 8.5% · 30yr
- Down + closing
- —
- Monthly P&I
- —
- Monthly cashflow
- —
- DSCR
- —
- Eligible?
- —
No personal income docs; deal must DSCR.
Hard money
10% down · 12.0% · 12mo
- Down + closing
- —
- Monthly P&I
- —
- Monthly cashflow
- —
- DSCR
- —
- Eligible?
- —
Short-term bridge; refi at stabilization.
Rent comps 3 comps
| Address | Beds | Baths | Sqft | Rent | $/sqft | DOM | Units | Dist |
|---|---|---|---|---|---|---|---|---|
| 25 Weaver Dr Massapequa, NY | 1.0–3.0 | 1.0–2.5 | 1003 | $4,470 | $4.46 | 0d | 1 | 0.27mi |
| 366 Broadway Amityville, NY | 3.0 | 1.0–2.5 | 1354 | $5,095 | $3.76 | 0d | 1 | 1.01mi |
| 100 Merrick Rd Amityville, NY | 2.0 | 1.0 | 550 | $2,200 | $4.00 | 0d | 1 | 1.47mi |
Listing history 4 events
-
2026-06-21days on market $399,000 Active 5 DOM
-
2026-06-18days on market $399,000 Active 2 DOM
-
2026-06-17remarks 131-char remark
-
2026-06-17$399,000 Active 1 DOM
ⓘ Source: listings_history table (triggers on properties + properties_extension) + one-shot
backfill from property_details.listing_events for pre-trigger history.
Tax reassessment forecast NY · Partial reset (capped growth)
- Current annual tax
- $6,593 · $549/mo
- Projected year-2 tax
- $6,668 · $556/mo
- Expected delta
- +$75/yr (+$6/mo · 1.1%)
ⓘ Screening estimate from a state-policy table — verify with the county assessor before closing.
Climate risk First Street
- Flood 1/10 Low FEMA zone X (unshaded) · 0% chance over 30 yrs
- Wildfire 1/10 Low
- Heat 6/10 Major 7 d/yr ≥94°F today · 17 d/yr by 30 yrs out
- Wind 6/10 Major 72% chance of damaging wind over 30 yrs
- Air quality 4/10 Moderate 5 unhealthy d/yr today · 7 by 30 yrs out
Nearby sold comps map
Loading sold comps map…
Walkable amenities ~0.75 mi
Loading nearby amenities…
Taxation est. · year 1
- Rental income
- $50,760
- − Mortgage interest
- −$22,350
- − Property taxes
- −$6,593
- − Insurance
- −$1,995
- − Repairs & maintenance
- −$4,061
- − Management
- −$4,061
- − Depreciation
- −$11,607
- Taxable income
- $93
- Est. tax owed @ 24.0%
- −$22
- After-tax cash flow
- $6,382/yr
For passive investors: Depreciation is non-cash, so a rental often shows a tax loss while cash-flowing — sheltering income. Rental losses are passive: they offset passive income freely, and up to $25,000/yr can offset ordinary (W-2) income if you actively participate and your MAGI is under $100k (phasing out to $0 by $150k); unused losses carry forward. On sale, claimed depreciation is recaptured at up to 25%, and gains may owe capital-gains tax (a 1031 exchange can defer both). Figures are a year-1 estimate at your 24.0% rate — not tax advice; consult a CPA.
Schools (NCES district)
- District
- Amityville Union Free School District
- NCES district ID
- 3602940
- Math proficiency
- 23% ▼ -12.00%
- Reading proficiency
- 28% ▼ -14.00%
- Median HH income
- $70,995
- Composite
- 24.47/100
- National rank
- #7663
- State rank
- #579 of 590 in NY
Livability — East Massapequa
- Score
- 74/100
- State rank
- #287
- US rank
- #4601
Category grades
Schools grade is shown separately in the Schools card above.
Census & demographics
- Census place
- East Massapequa, NY
- Population (ZIP)
- 54,741
Population outlook (Nassau County) Hauer SSP2
- Today (2025)
- 1,409,302 people
- By 2030
- 1,431,482 · +1.6%
- By 2040
- 1,471,607 · +4.4%
- By 2050
- 1,502,845 · +6.6%
- By 2075
- 1,575,403 · +11.8%
- By 2100
- 1,554,356 · +10.3%
Race, ethnicity, and origin ACS 2023
- Neighborhood character
- Predominantly White (80%)
- Race & ethnicity
- White 80% Hispanic / Latino 11% Two or more races 7% Black 6% Asian 2%
- Hispanic origin (detail)
- Puerto Rican 4% Dominican 1%
- Common ancestry
- Romanian 4% Scotch-Irish 2% Italian 1%
- Foreign-born
- 8% · Canada, China
- Languages at home
- 89% English-only · Spanish 6% Other Indo-European 3% Russian/Polish/Slavic 1%
Political lean MEDSL · Nassau
- 2024 margin
- Toss-up / Even · D 47.9% · R 52.1%
- 2008→2024 swing
- -12.6pp toward R · 2008: 8.4pp · 2024: -4.2pp
- All cycles
- 2024: R+4.2 2020: D+9.5 2016: D+5.3 2012: D+6.7 2008: D+8.4
Not yet ingested
- Civics
- —
Market trends
- HPI YoY
- ▼ -765.19%
- Current HPI
- 287.8085
- Rent YoY
- —
- Metro
- —
- State GDP YoY
- ▲ 2.60%
- F500 in state
- 92
Industry mix (Fortune 500 HQ in NY)
| Industry | F500 HQs | Revenue |
|---|---|---|
| Financial Services | 10 | $950B |
|
||
| Consumer Goods | 9 | $162B |
|
||
| Insurance | 4 | $225B |
|
||
| Telecommunications | 2 | $144B |
|
||
| Pharmaceuticals | 2 | $112B |
|
||
| Media / Entertainment | 2 | $69B |
|
||
Price history
+398.8% since first listed15 events — show timeline
- 2026-06-16 Listed $399,000 OneKey® MLS as Distributed by MLS Grid
- 2024-07-24 Sold (MLS) $268,500 OneKey® MLS as Distributed by MLS Grid
- 2024-06-05 Pending — OneKey® MLS as Distributed by MLS Grid
- 2024-05-10 Price Changed $313,100 OneKey® MLS as Distributed by MLS Grid
- 2024-04-22 Price Changed $328,300 OneKey® MLS as Distributed by MLS Grid
- 2024-04-05 Price Changed $343,500 OneKey® MLS as Distributed by MLS Grid
- 2024-03-21 Price Changed $381,700 OneKey® MLS as Distributed by MLS Grid
- 2024-03-06 Price Changed $393,400 OneKey® MLS as Distributed by MLS Grid
- 2024-02-20 Price Changed $406,000 OneKey® MLS as Distributed by MLS Grid
- 2024-02-05 Price Changed $413,400 OneKey® MLS as Distributed by MLS Grid
- 2024-01-17 Price Changed $472,200 OneKey® MLS as Distributed by MLS Grid
- 2024-01-02 Price Changed $474,600 OneKey® MLS as Distributed by MLS Grid
- 2023-12-14 Listed $477,000 OneKey® MLS as Distributed by MLS Grid
- 2006-10-31 Sold (Public Records) $345,000 Public Records
- 1993-10-13 Sold (Public Records) $80,000 Public Records
Property tax history
+2.7%/yrLatest (2024): $6,593 · -1.0% YoY. Source: county tax records.
Cash-flow waterfall
monthlySold comps — $/sqft
last 12 mo · ≤1 miLoading sold comps…