None · Goodsprings, NV
Flood risk 1/10 · Minimal
- FEMA flood zone
- X (unshaded)
- Chance of flooding over 30 yrs
- 0.0%
- Est. flood insurance / yr
- $473 – $860
Fire risk 9/10 · Severe
- Est. fire insurance / yr
- $490 – $910
Heat risk 6/10 · Moderate
- Hot days now (above 101°F)
- 8 days/yr
- Hot days in 30 yrs
- 21 days/yr
Wind risk 1/10 · Minimal
- Chance of severe wind over 30 yrs
- —
Air-quality risk 3/10 · Minor
- Unhealthy air days now
- 2 days/yr
- Unhealthy air days in 30 yrs
- 2 days/yr
Risk factors via First Street. Map © Google.
Why this score? — see what drove the C- grade
The composite is a weighted blend of 9 inputs, each scored 0–100. Each bar is that input's sub-score; the figure is the points it added to the 100-point composite (weight × sub-score).
- Cash flow +18.0/30.0
- Appreciation +8.3/10.0
- ARV discount +7.5/15.0
- DSCR +5.6/10.0
- 1% rule +4.8/10.0
- Schools +2.6/10.0
- Rent growth +2.5/5.0
- Livability +1.9/5.0
- Condition / age +1.0/5.0
$150,000
🖨 Deal sheet 📄 Offer letter ✓ Due diligence
Listing remarks
Nice house.
Key facts
- 1.13 acre lot
- Built 2012
Property features AI
Finance
- Financial info: Annual tax amount not included per instructions
Exterior
- Parking: Open parking; RV access/parking
- Utilities: Electricity available; Private well water; Septic available (septic tank)
- Home design: Single family property; 2-story home; Faces west; Resale condition
- Construction: Asphalt roof
- Exterior features: Patio; Block fencing in front yard; Desert landscaping; Landscaped yard; One to five acre lot
Interior
- Kitchen: Island kitchen; Built-in electric oven; Electric cooktop; Microwave; Refrigerator
- Bedrooms: 2 possible bedrooms; Bedroom 2 located downstairs
- Flooring: Carpet; Ceramic tile; Laminate
- Bathrooms: 2 full bathrooms
- Heating & cooling: Central heating (electric); Central air conditioning (electric)
- Interior features: Furnished; Primary bedroom is downstairs; Bedroom on main level; Shower-only bathroom
- Laundry & utility: Washer; Dryer; Electric dryer hookup on main level
Neighborhood map
What this means for you Summary
Snapshot
- This is a 2-bed/2.0-bath single-family listed at $150k. Condition is rated poor.
Deal economics
- At list price, monthly cash flow is $130 ($2k/yr) — positive.
- The deal already cash-flows at list — no discount required.
- To meet the 1% rule (rent ≥ 1% of price), the offer needs to be $148k (1.6% below list).
- Recommended offer: $148k (1.6% below list) — sets the bar for 1% rule.
Location & tenants
- Location reads 37/100 on livability (#124 in NV) — a limited-amenity area; tenant pool skews transient or value-seeking. Strengths: cost of living A+, crime A; Watch: schools F, amenities F, employment F.
- Clark County School District (urban): math 21% / reading 39% proficiency, ranked #11 of 17 in NV (top 65%) — families likely to look elsewhere, expect single-tenant / working-renter base with shorter leases.
- Market conditions: 53 active listings in the ZIP; 14,754 units permitted in Clark County in 2024 (2,301 in 5+ unit buildings).
Forward outlook
- In year one you build about $11k of equity ($1k loan paydown + $10k appreciation (6.6% local appreciation)).
- Clark County population projected at +36% by 2050 — long-run rental-demand tailwind backs the buy-and-hold thesis.
- At projected returns (6.6% appreciation + 3.0% rent growth), your $42k cash investment doubles in ~4 years — after that, you're playing with house money.
- By year 4, paydown + projected appreciation supports a ~$37k cash-out refi (75% LTV) — recoverable capital for the next deal without selling this one.
Negotiation context
- Only 1 days on market — expect competitive offers; lowballing is unlikely to land.
Risks & watch-outs
- Climate carrying-cost: severe wildfire risk; extreme-heat days projected 8→21/yr by 2055 (HVAC capex compounding) — expect insurance premiums to compound above CPI over the hold.
Questions for the listing agent
- Have any recent inspections been done? Can we get a copy of the seller's disclosures and any deferred-maintenance estimates?
- Is there a deadline driving the sale (1031 exchange, divorce, estate, relocation)? That informs how much negotiation room exists.
- Schools are F-rated, which usually means shorter tenancies and higher turnover. Who's the typical renter profile here, and what's been the actual vacancy rate?
- What's the average days-on-market for RENTAL listings here right now (not sales)? A rising rental-DOM trend means longer vacancies and softer asking-rent achievability than the comps imply.
- What's the recent tenant-quality profile in this submarket — average credit score on applications, eviction rate, late-payment / NSF rate, and stable-employment percentage? A property-management company in the area should have these aggregated.
- How much new for-sale + rental construction is in the pipeline within 1–3 miles? Heavy new supply typically softens prices + rents 12–24 months out; constrained supply supports both.
Investment metrics
- 1% rule
- 0.98% ✗
- Cap rate
- 7.33%
- Cash-on-cash
- 3.70%
- DSCR
- 1.16
- GRM
- 8.5
CMA / ARV
No comps found within radius.
Projected returns pro-forma
6.61% appreciation · 3.0% rent growth · sell at horizon
- IRR
- 19.8%
- Equity multiple
- 2.36×
- Total profit
- $57,096
- Equity at exit
- $100,154
- IRR
- 18.9%
- Equity multiple
- 4.82×
- Total profit
- $160,274
- Equity at exit
- $186,909
Cash invested: $42,000 (down + closing). Projections, not guarantees.
Landlord ↔ Tenant lean methodology
- Overall (STATE)
- 71 Landlord-Friendly
- State Nevada
- 71 Landlord-Friendly · R+1
- County
- — inherits STATE
- City
- — inherits STATE
ZIP-level market 89019
- Home prices YoY
- 2.6%
- Active inventory
- 53
- Price-to-rent
- 8.5×
Monthly cashflow live
- Estimated rent
- $1,476 medium interval (Pro) →
- Mortgage (P&I)
- −$787
- Tax est. 1.5%
- −$188 /mo · $2,250/yr
- Insurance
- −$62
- HOA
- −$0
- Vacancy / Maint / Mgmt
- −$310
- Net cashflow
- $130
Break-even live
UW: 25.0% down · 7.5% · 30yr · 1.5% tax · 5.0% vac · 8.0% maint · 8.0% mgmt
Financing live
Cash to close
- Down payment
- $37,500
- Closing costs
- $4,500
- Reserves months
- —
- Total cash needed
- —
Loan-product check · same deal, 3 products live
Conventional
25% down · 7.5% · 30yr
- Down + closing
- —
- Monthly P&I
- —
- Monthly cashflow
- —
- DSCR
- —
- Eligible?
- —
Personal DTI + credit; lowest rate.
DSCR
20% down · 8.5% · 30yr
- Down + closing
- —
- Monthly P&I
- —
- Monthly cashflow
- —
- DSCR
- —
- Eligible?
- —
No personal income docs; deal must DSCR.
Hard money
10% down · 12.0% · 12mo
- Down + closing
- —
- Monthly P&I
- —
- Monthly cashflow
- —
- DSCR
- —
- Eligible?
- —
Short-term bridge; refi at stabilization.
Listing history 2 events
-
2026-06-13remarks 11-char remark
-
2026-06-13$150,000 Pending 1 DOM
ⓘ Source: listings_history table (triggers on properties + properties_extension) + one-shot
backfill from property_details.listing_events for pre-trigger history.
Climate risk First Street
- Flood 1/10 Low FEMA zone X (unshaded) · 0% chance over 30 yrs
- Wildfire 9/10 Extreme
- Heat 6/10 Major 8 d/yr ≥101°F today · 21 d/yr by 30 yrs out
- Wind 1/10 Low
- Air quality 3/10 Moderate 2 unhealthy d/yr today · 2 by 30 yrs out
Nearby sold comps map
Loading sold comps map…
Walkable amenities ~0.75 mi
Loading nearby amenities…
Taxation est. · year 1
- Rental income
- $17,716
- − Mortgage interest
- −$8,402
- − Property taxes
- −$2,250
- − Insurance
- −$750
- − Repairs & maintenance
- −$1,417
- − Management
- −$1,417
- − Depreciation
- −$4,364
- Taxable loss
- −$885
- Est. tax savings @ 24.0%
- +$212
- After-tax cash flow
- $1,768/yr
For passive investors: Depreciation is non-cash, so a rental often shows a tax loss while cash-flowing — sheltering income. Rental losses are passive: they offset passive income freely, and up to $25,000/yr can offset ordinary (W-2) income if you actively participate and your MAGI is under $100k (phasing out to $0 by $150k); unused losses carry forward. On sale, claimed depreciation is recaptured at up to 25%, and gains may owe capital-gains tax (a 1031 exchange can defer both). Figures are a year-1 estimate at your 24.0% rate — not tax advice; consult a CPA.
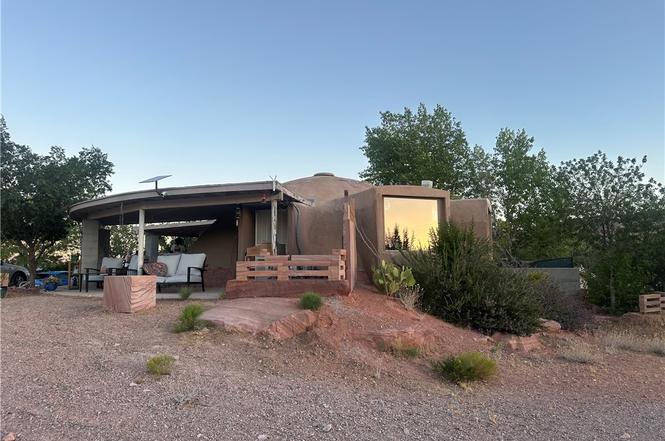
Condition & rehab AI · 2 photos
This property requires extensive repairs and renovations, including roof replacement, siding repair, and landscaping improvements, to become move-in ready and increase its value.
Repairs flagged
- Major roof — Significant damage and potential leaks.
- Major siding — Peeling and weathered condition.
- Major HVAC — No visible condition, but the exterior suggests potential issues.
- Major plumbing — No visible condition, but the exterior suggests potential issues.
- Major landscaping — Sparse and not well-maintained, indicating a need for improvement and possibly re-landscaping.
Value-add opportunities
- Both roof replacement — Fixing the roof will address the most critical issue and improve both resale and rental value.
- Both siding replacement — Replacing the siding will improve the home's appearance and increase its value.
- Both landscaping — A well-maintained and aesthetically pleasing landscape will enhance curb appeal and attract potential buyers/tenants.
- Both HVAC and plumbing updates — Upgrading these systems will improve comfort and functionality, making the home more attractive to buyers/tenants.
- Both interior renovations — Updating the interior will address any issues and improve the home's overall condition, increasing its value for resale or rental.
Renovation cost estimate screening
| Repair item | Severity | Est. cost |
|---|---|---|
| roof · Significant damage and potential leaks. | Major | $15,000–50,000 |
| siding · Peeling and weathered condition. | Major | $15,000–50,000 |
| HVAC · No visible condition, but the exterior suggests potential issues. | Major | $15,000–50,000 |
| plumbing · No visible condition, but the exterior suggests potential issues. | Major | $15,000–50,000 |
| landscaping · Sparse and not well-maintained, indicating a need for improvement and possibly re-landscaping. | Major | $15,000–50,000 |
| Total estimated repair cost · 5 items | $75,000–250,000 |
Value-add ROI direction
- Both roof replacement — Fixing the roof will address the most critical issue and improve both resale and rental value. ↑
- Both siding replacement — Replacing the siding will improve the home's appearance and increase its value. ↑
- Both landscaping — A well-maintained and aesthetically pleasing landscape will enhance curb appeal and attract potential buyers/tenants. ↑
- Both HVAC and plumbing updates — Upgrading these systems will improve comfort and functionality, making the home more attractive to buyers/tenants. ↑
- Both interior renovations — Updating the interior will address any issues and improve the home's overall condition, increasing its value for resale or rental. ↑
ⓘ Cost ranges are severity-bucket heuristics (US national rule-of-thumb). Get contractor quotes + a written scope before underwriting a rehab budget.
Schools (NCES district)
- District
- Clark County School District
- NCES district ID
- 3200060
- Math proficiency
- 21% ▼ -13.00%
- Reading proficiency
- 39% ▼ -8.00%
- Median HH income
- $53,611
- Composite
- 26.48/100
- National rank
- #7211
- State rank
- #11 of 17 in NV
Livability — Goodsprings
- Score
- 37/100
- State rank
- #124
- US rank
- #27618
Category grades
Schools grade is shown separately in the Schools card above.
Census & demographics
- Census place
- Goodsprings, NV
- Population (ZIP)
- 2,355
Population outlook (Clark County) Hauer SSP2
- Today (2025)
- 2,504,101 people
- By 2030
- 2,693,770 · +7.6%
- By 2040
- 3,061,208 · +22.2%
- By 2050
- 3,400,072 · +35.8%
- By 2075
- 4,139,522 · +65.3%
- By 2100
- 4,596,916 · +83.6%
Race, ethnicity, and origin ACS 2023
- Neighborhood character
- Predominantly White (77%)
- Race & ethnicity
- White 77% Asian 10% Hispanic / Latino 6% Two or more races 5% Black 3%
- Hispanic origin (detail)
- Mexican 6%
- Common ancestry
- Serbian 3% Lithuanian 3% Portuguese 2%
- Foreign-born
- 14% · Canada
- Languages at home
- 83% English-only · Tagalog/Filipino 6% Spanish 5% Other Indo-European 3%
Political lean MEDSL · Clark
- 2024 margin
- Toss-up / Even · D 50.4% · R 47.8% · Other 1.7%
- 2008→2024 swing
- -16.5pp toward R · 2008: 19.1pp · 2024: 2.6pp
- All cycles
- 2024: D+2.6 2020: D+9.3 2016: D+10.7 2012: D+14.5 2008: D+19.1
Not yet ingested
- Civics
- —
Market trends
- HPI YoY
- ▲ 6.61%
- Current HPI
- 262.4
- Rent YoY
- —
- Metro
- —
- State GDP YoY
- ▲ 3.08%
- F500 in state
- 6
Industry mix (Fortune 500 HQ in NV)
| Industry | F500 HQs | Revenue |
|---|---|---|
| Hotels / Casinos | 3 | $36B |
|
||
Price history
2 events — show timeline
- 2026-06-12 Pending — GLVAR
- 2026-06-10 Listed $150,000 GLVAR
Cash-flow waterfall
monthlySold comps — $/sqft
last 12 mo · ≤1 miLoading sold comps…