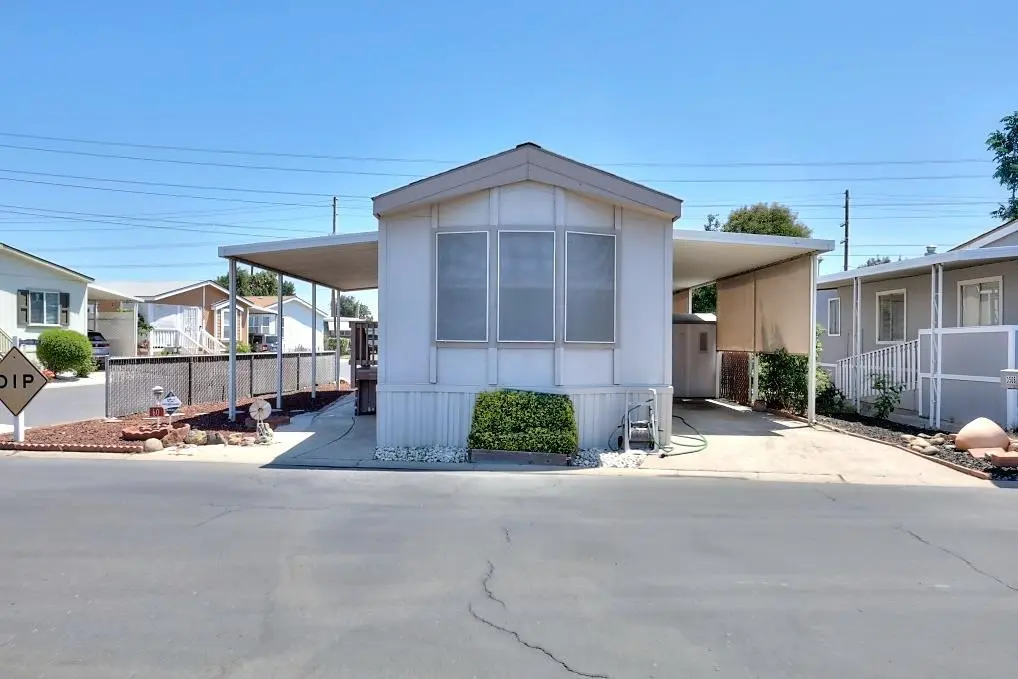
3506 Homestead Way · Ceres, CA
Flood risk No data
- FEMA flood zone
- —
- Chance of flooding over 30 yrs
- —
- Est. flood insurance / yr
- —
Fire risk No data
- Est. fire insurance / yr
- —
Heat risk No data
- Hot days now (above threshold)
- —
- Hot days in 30 yrs
- —
Wind risk No data
- Chance of severe wind over 30 yrs
- —
Air-quality risk No data
- Unhealthy air days now
- —
- Unhealthy air days in 30 yrs
- —
Risk factors via First Street. Map © Google.
Why this score? — see what drove the B grade
The composite is a weighted blend of 9 inputs, each scored 0–100. Each bar is that input's sub-score; the figure is the points it added to the 100-point composite (weight × sub-score).
- Cash flow +30.0/30.0
- ARV discount +13.2/15.0
- 1% rule +10.0/10.0
- DSCR +10.0/10.0
- Schools +2.8/10.0
- Livability +2.7/5.0
- Rent growth +2.5/5.0
- Condition / age +2.5/5.0
- Appreciation +0.0/10.0
$89,000
🖨 Deal sheet 📄 Offer letter ✓ Due diligence
Listing remarks
Charming and well-maintained 2-bedroom, 1-bath manufactured home located in a quiet and desirable senior community. Built in 2005, this home offers a comfortable and inviting layout. The kitchen features a newer gas range and ample cabinet space, while the included washer and dryer add extra convenience. Enjoy year-round comfort with the updated HVAC system. This home has been lovingly cared for and is move-in ready, making it a fantastic opportunity for anyone seeking peaceful living in a well-kept community. Come take a look!
Key facts
- Updated hvac system
- Newer gas range
- Ample cabinet space
Tags
Property features AI
Finance
- Financial info: Land lease: No (listed land lease amount present but property indicates no land lease)
- HOA & community: No homeowners association; Senior community
Exterior
- Parking: Parking information not provided
- Utilities: Public water; Sewer: other; 220 volts available in laundry
- Home design: Manufactured home located in a park; Single-wide floorplan; Built in 2005
- Construction: Aluminum skirting; Fleetwood Homes of CA manufacturer; Model/Make: EXPRESSONS
- Exterior features: Shingle roof; Located on a court
Interior
- Kitchen: Free standing gas range; Breakfast room
- Bedrooms: 2 bedrooms
- Flooring: Carpet
- Bathrooms: 1 full bathroom
- Heating & cooling: Central heating; Central air; Ceiling fan(s)
- Interior features: Ceiling fan(s) and central air for cooling; Central heating; Breakfast room off the kitchen; Dining space in the kitchen; Living room with additional features; Low-flow toilet(s)
- Laundry & utility: Washer included; Dryer included; 220-volt outlet in laundry
Neighborhood map
What this means for you Summary
Snapshot
- This is a 2-bed/1.0-bath manufactured listed at $89k.
Deal economics
- At list price, monthly cash flow is $774 ($9k/yr) — positive.
- The deal already cash-flows at list — no discount required.
- Meets the 1% rule at list price ($2k rent vs $89k).
- Recommended offer: $86k (3.0% below list) — sets the bar for market timing.
- Cap rate 16.7% vs local median 3.8% in Ceres — top-decile yield for the area; either an underpriced asset or a hidden risk that comps aren't pricing in. Stress-test before assuming the spread holds.
Location & tenants
- Location reads 54/100 on livability (#923 in CA) — a working-class tenant base; expect higher turnover. Strengths: housing A+; Watch: employment C-, crime D+, schools D-.
- Ceres Unified (suburban): math 15% / reading 50% proficiency, ranked #303 of 517 in CA (top 59%) — families likely to look elsewhere, expect single-tenant / working-renter base with shorter leases; 69% free/reduced lunch — lower-income household profile, screen leases tightly.
- Market conditions: 87 active listings in the ZIP; 10 comparable units currently listed for rent nearby; rentals at typical pace (median 24d on market — plan ~3-4 weeks tenant-placement turnaround); solid renter incomes; 923 units permitted in Stanislaus County in 2024 (63 in 5+ unit buildings).
Forward outlook
- Local home prices are declining (-3.0%/yr); year-one equity from $615 of loan paydown is wiped out by about $3k of value loss. Plan a longer hold.
- Stanislaus County population projected at +14% by 2050 — modest demand growth; plan on rents tracking national, not racing it.
- At projected returns (-3.0% appreciation + 3.0% rent growth), your $25k cash investment doubles in ~4 years — after that, you're playing with house money.
Negotiation context
- It's been on market 31 days — a 3% lower offer ($86k) is reasonable based on typical stale-listing flexibility.
Questions for the listing agent
- It's been on market 31 days. Have you received any prior offers? Is the seller open to a 3% concession, seller financing, or rate buy-down credit?
- Is there a deadline driving the sale (1031 exchange, divorce, estate, relocation)? That informs how much negotiation room exists.
- Schools are D-rated, which usually means shorter tenancies and higher turnover. Who's the typical renter profile here, and what's been the actual vacancy rate?
- Crime grade is D in this area — have there been break-ins, vandalism, or insurance claims at this property in the last 3 years? What carrier currently insures it and at what premium?
- What's the average days-on-market for RENTAL listings here right now (not sales)? A rising rental-DOM trend means longer vacancies and softer asking-rent achievability than the comps imply.
- What's the recent tenant-quality profile in this submarket — average credit score on applications, eviction rate, late-payment / NSF rate, and stable-employment percentage? A property-management company in the area should have these aggregated.
- How much new for-sale + rental construction is in the pipeline within 1–3 miles? Heavy new supply typically softens prices + rents 12–24 months out; constrained supply supports both.
Investment metrics
- 1% rule
- 1.98% ✓
- Cap rate
- 16.73%
- Cash-on-cash
- 37.28%
- DSCR
- 2.66
- GRM
- 4.2
CMA / ARV
- ARV (on-the-fly)
- $101,920
- Comps found
- 2
Show comp detail 2 sales within ~0.75 mi
| Address | Dist | Beds/Ba | Sqft | Sold | Price | $/sf | Match |
|---|---|---|---|---|---|---|---|
| 3118 Donner Dr #23 | 0.08mi | 2/2.0 | 780 (-0%) | 12mo | $50,000 | $64 | 82 |
| 3106 Donner Dr | 0.08mi | 2/1.0 | 800 (+2%) | 16mo | $104,000 | $130 | 79 |
Match score weights: distance 35% · size 25% · config 20% · recency 20%. Top-matched comps best support the ARV.
Projected returns pro-forma
-3.0% appreciation · 3.0% rent growth · sell at horizon
- IRR
- 33.2%
- Equity multiple
- 2.40×
- Total profit
- $34,910
- Equity at exit
- $13,270
- IRR
- 40.2%
- Equity multiple
- 4.77×
- Total profit
- $93,994
- Equity at exit
- $7,695
Cash invested: $24,920 (down + closing). Projections, not guarantees.
Landlord ↔ Tenant lean methodology
- Overall (STATE)
- 18 Strongly Tenant-Friendly
- State California
- 18 Strongly Tenant-Friendly · D+13
- County
- — inherits STATE
- City
- — inherits STATE
ZIP-level market 95307
- Active inventory
- 87
- Price-to-rent
- 4.2×
Monthly cashflow live
- Estimated rent
- $1,758 high interval (Pro) →
- Mortgage (P&I)
- −$467
- Tax est. 1.5%
- −$111 /mo · $1,335/yr
- Insurance
- −$37
- HOA
- −$0
- Vacancy / Maint / Mgmt
- −$369
- Net cashflow
- $774
Break-even live
UW: 25.0% down · 7.5% · 30yr · 1.5% tax · 5.0% vac · 8.0% maint · 8.0% mgmt
Financing live
Cash to close
- Down payment
- $22,250
- Closing costs
- $2,670
- Reserves months
- —
- Total cash needed
- —
Loan-product check · same deal, 3 products live
Conventional
25% down · 7.5% · 30yr
- Down + closing
- —
- Monthly P&I
- —
- Monthly cashflow
- —
- DSCR
- —
- Eligible?
- —
Personal DTI + credit; lowest rate.
DSCR
20% down · 8.5% · 30yr
- Down + closing
- —
- Monthly P&I
- —
- Monthly cashflow
- —
- DSCR
- —
- Eligible?
- —
No personal income docs; deal must DSCR.
Hard money
10% down · 12.0% · 12mo
- Down + closing
- —
- Monthly P&I
- —
- Monthly cashflow
- —
- DSCR
- —
- Eligible?
- —
Short-term bridge; refi at stabilization.
Rent comps 10 comps
| Address | Beds | Baths | Sqft | Rent | $/sqft | DOM | Units | Dist |
|---|---|---|---|---|---|---|---|---|
| 2800 Don Pedro Rd Ceres, CA | 2.0 | 1.0 | 816 | $1,695 | $2.08 | 3d | 1 | 0.36mi |
| 2717 Roeding Rd Unit 18 Ceres, CA | 2.0 | 1.0 | 850 | $1,600 | $1.88 | 13d | 1 | 0.46mi |
| 2717 Roeding Rd Unit 96 Ceres, CA | 2.0 | 1.0 | 850 | $1,650 | $1.94 | 43d | 1 | 0.46mi |
| 2717 Roeding Rd Unit 34 Ceres, CA | 2.0 | 1.0 | 850 | $1,650 | $1.94 | 13d | 1 | 0.46mi |
| 2717 Roeding Rd Apt 13 Ceres, CA | 2.0 | 1.0 | 850 | $1,850 | $2.18 | 21d | 1 | 0.46mi |
| 2717 Roeding Rd Apt 103 Ceres, CA | 2.0 | 1.0 | 850 | $1,800 | $2.12 | 21d | 1 | 0.46mi |
| 2717 Roeding Rd Apt 92 Ceres, CA | 2.0 | 1.0 | 850 | $1,750 | $2.06 | 43d | 1 | 0.46mi |
| 2714 Pyramid Ave Unit 2714 Ceres, CA | 3.0 | 2.0 | 1008 | $1,895 | $1.88 | 23d | 1 | 0.46mi |
| 2121 Moffett Rd Ceres, CA | 2.0 | 1.0 | 900 | $1,450 | $1.61 | 43d | 1 | 1.05mi |
| 2250 5th St Unit 11 Ceres, CA | 2.0 | 1.0 | 700 | $1,395 | $1.99 | 23d | 1 | 1.08mi |
Listing history 16 events
-
2026-06-18days on market $89,000 Active 31 DOM
-
2026-06-17days on market $89,000 Active 30 DOM
-
2026-06-16days on market $89,000 Active 29 DOM
-
2026-06-15days on market $89,000 Active 28 DOM
-
2026-06-14days on market $89,000 Active 26 DOM
-
2026-06-13days on market $89,000 Active 25 DOM
-
2026-06-10days on market $89,000 Active 23 DOM
-
2026-06-09days on market $89,000 Active 22 DOM
-
2026-06-08days on market $89,000 Active 21 DOM
-
2026-06-07days on market $89,000 Active 20 DOM
-
2026-06-05days on market $89,000 Active 17 DOM
-
2026-06-03days on market $89,000 Active 16 DOM
-
2026-06-02days on market $89,000 Active 15 DOM
-
2026-06-01days on market $89,000 Active 14 DOM
-
2026-05-31days on market $89,000 Active 13 DOM
-
2026-05-30days on market $89,000 Active 12 DOM
ⓘ Source: listings_history table (triggers on properties + properties_extension) + one-shot
backfill from property_details.listing_events for pre-trigger history.
Nearby sold comps map
Loading sold comps map…
Walkable amenities ~0.75 mi
Loading nearby amenities…
Taxation est. · year 1
- Rental income
- $21,102
- − Mortgage interest
- −$4,985
- − Property taxes
- −$1,335
- − Insurance
- −$445
- − Repairs & maintenance
- −$1,688
- − Management
- −$1,688
- − Depreciation
- −$2,589
- Taxable income
- $8,371
- Est. tax owed @ 24.0%
- −$2,009
- After-tax cash flow
- $7,281/yr
For passive investors: Depreciation is non-cash, so a rental often shows a tax loss while cash-flowing — sheltering income. Rental losses are passive: they offset passive income freely, and up to $25,000/yr can offset ordinary (W-2) income if you actively participate and your MAGI is under $100k (phasing out to $0 by $150k); unused losses carry forward. On sale, claimed depreciation is recaptured at up to 25%, and gains may owe capital-gains tax (a 1031 exchange can defer both). Figures are a year-1 estimate at your 24.0% rate — not tax advice; consult a CPA.
Schools (NCES district)
- District
- Ceres Unified
- NCES district ID
- 0608130
- Math proficiency
- 15% ▼ -9.00%
- Reading proficiency
- 50% ▲ 12.00%
- Median HH income
- $48,178
- Composite
- 27.96/100
- National rank
- #6858
- State rank
- #303 of 517 in CA
Livability — Ceres
- Score
- 54/100
- State rank
- #923
- US rank
- #24224
Category grades
Schools grade is shown separately in the Schools card above.
Census & demographics
- Census place
- Ceres, CA
- County
- Stanislaus County · 445,786 people
- City population
- 46,310
- Metro
- Modesto, CA
- Population (ZIP)
- 46,310
- Household income
- $80,627
- Rent vs Own
- Severe rent burden
- 1102.0
Population outlook (Stanislaus County) Hauer SSP2
- Today (2025)
- 579,493 people
- By 2030
- 598,000 · +3.2%
- By 2040
- 630,930 · +8.9%
- By 2050
- 658,300 · +13.6%
- By 2075
- 712,363 · +22.9%
- By 2100
- 719,805 · +24.2%
Race, ethnicity, and origin ACS 2023
- Neighborhood character
- Majority Hispanic (64%)
- Race & ethnicity
- Hispanic / Latino 64% Two or more races 34% White 23% Asian 8% Black 1%
- Hispanic origin (detail)
- Mexican 61%
- Common ancestry
- Russian 3% Lithuanian 1% Italian 1%
- Foreign-born
- 27% · Canada, China
- Languages at home
- 41% English-only · Spanish 49% Other Indo-European 7% Arabic 1%
Political lean MEDSL · Stanislaus
- 2024 margin
- R (+11.0) · D 43.2% · R 54.2% · Other 2.6%
- 2008→2024 swing
- -12.7pp toward R · 2008: 1.7pp · 2024: -11.0pp
- All cycles
- 2024: R+11.0 2020: D+0.8 2016: D+0.6 2012: D+0.7 2008: D+1.7
Not yet ingested
- Civics
- —
Market trends
- HPI YoY
- ▼ -362.75%
- Current HPI
- 307.5192
- Rent YoY
- —
- Metro
- Modesto, CA
- State GDP YoY
- ▲ 3.21%
- F500 in state
- 116
Industry mix (Fortune 500 HQ in CA)
| Industry | F500 HQs | Revenue |
|---|---|---|
| Technology | 27 | $1,492B |
|
||
| Financial Services | 3 | $174B |
|
||
| Retail | 3 | $44B |
|
||
| Insurance | 3 | $26B |
|
||
| Media / Entertainment | 2 | $115B |
|
||
| Pharmaceuticals / Biotech | 2 | $62B |
|
||
Cash-flow waterfall
monthlySold comps — $/sqft
last 12 mo · ≤1 miLoading sold comps…