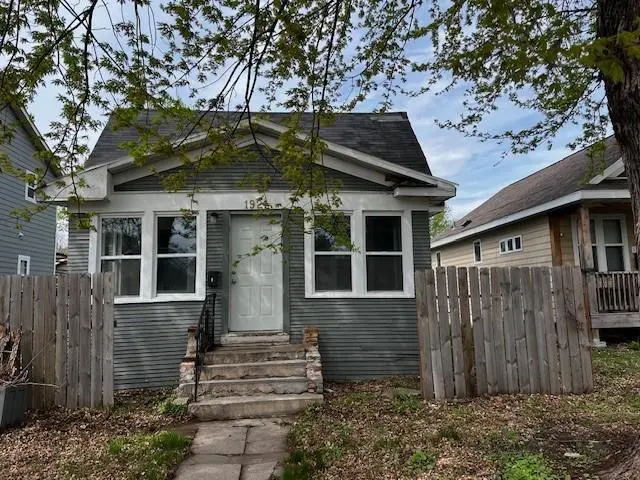
1921 Queen Ave N · Minneapolis, MN
Flood risk 1/10 · Minimal
- FEMA flood zone
- X (unshaded)
- Chance of flooding over 30 yrs
- 0.0%
- Est. flood insurance / yr
- $473 – $860
Fire risk 1/10 · Minimal
- Est. fire insurance / yr
- $888 – $1,650
Heat risk 2/10 · Minimal
- Hot days now (above 99°F)
- 7 days/yr
- Hot days in 30 yrs
- 14 days/yr
Wind risk 2/10 · Minimal
- Chance of severe wind over 30 yrs
- —
Air-quality risk 2/10 · Minimal
- Unhealthy air days now
- 1 days/yr
- Unhealthy air days in 30 yrs
- 1 days/yr
Risk factors via First Street. Map © Google.
Why this score? — see what drove the C grade
The composite is a weighted blend of 9 inputs, each scored 0–100. Each bar is that input's sub-score; the figure is the points it added to the 100-point composite (weight × sub-score).
- Cash flow +18.3/30.0
- ARV discount +15.0/15.0
- DSCR +5.7/10.0
- 1% rule +4.7/10.0
- Rent growth +4.3/5.0
- Livability +3.9/5.0
- Schools +3.5/10.0
- Condition / age +2.5/5.0
- Appreciation +0.0/10.0
$165,000
🖨 Deal sheet (PDF) 📄 Offer letter ✓ Due diligence
Key facts
- Fenced back yard
- Mature front trees
- Near parks
Tags
Property features AI
Exterior
- Parking: Gravel driveway; 1-car garage
- Utilities: City water connected; City sewer connected; Natural gas; Circuit breaker electrical
- Home design: Residential property; One-and-one-half story home; Above-grade and below-grade finished living areas
- Construction: Block construction; Block foundation
- Exterior features: Front porch (glass-enclosed, screened); Additional porch; Wood exterior; Wood fencing; Lot roughly 40 x 128 (0.12 acre)
Interior
- Kitchen: Range; Refrigerator
- Bedrooms: 3 bedrooms (one main-floor bedroom, others on upper and main levels)
- Flooring: Hardwood floors; Tile floors
- Bathrooms: Main floor full bathroom
- Heating & cooling: Forced-air heating; Window air conditioning units
- Interior features: Fireplace (1); Main floor primary bedroom; Natural woodwork; Kitchen window; Porch
- Laundry & utility: Main-level laundry (washer and dryer included); Utility/unfinished area in lower level
Neighborhood map
What this means for you Summary
Snapshot
- This is a 2-bed/1.0-bath single-family listed at $165k.
Deal economics
- At list price, monthly cash flow is $150 ($2k/yr) — positive.
- The deal already cash-flows at list — no discount required.
- To meet the 1% rule (rent ≥ 1% of price), the offer needs to be $161k (2.7% below list).
- Recommended offer: $161k (2.7% below list) — sets the bar for 1% rule.
- Cap rate 7.4% vs local median 3.1% in Minneapolis — top-decile yield for the area; either an underpriced asset or a hidden risk that comps aren't pricing in. Stress-test before assuming the spread holds.
Location & tenants
- Location reads 78/100 on livability (#110 in MN, #2,525 nationally) — a middle-class / working-renter tenant base. Strengths: amenities A+, commute A+, housing A+; Watch: cost of living C-, crime F.
- Minneapolis Public School District (urban): math 35% / reading 46% proficiency, ranked #217 of 301 in MN (top 72%) — families likely to look elsewhere, expect single-tenant / working-renter base with shorter leases.
- Market conditions: Rents rising fast (+7.3%/yr); 133 active listings in the ZIP; 39 comparable units currently listed for rent nearby; rentals leasing fast (median 9d on market — plan ~1-2 weeks tenant-placement turnaround); 4,651 units permitted in Hennepin County in 2024 (2,443 in 5+ unit buildings).
- This rent runs 32% of the median local income ($60k/yr) — at the standard rent-burdened threshold; future hikes will face affordability resistance.
Forward outlook
- Local home prices are declining (-3.0%/yr); year-one equity from $1k of loan paydown is wiped out by about $5k of value loss. Plan a longer hold.
- Hennepin County population projected at +30% by 2050 — long-run rental-demand tailwind backs the buy-and-hold thesis.
- At projected returns (-3.0% appreciation + 7.3% rent growth), your $46k cash investment doubles in ~10 years — after that, you're playing with house money.
Negotiation context
- It's been on market 17 days — a 2% lower offer ($163k) is reasonable based on typical stale-listing flexibility.
- 6 sale attempts since 34y ago with the ask held roughly flat each time — persistent listings suggest the price (not the market) is what's stuck; bring a comps-based counter.
- Current owner paid $50k; list at $165k implies a 230% gain — meaningful room to come down on a strong offer.
Risks & watch-outs
- Watch-outs: built in 1914 — expect roof / HVAC / electrical / plumbing capex.
Questions for the listing agent
- Built in 1914 — when were the roof, HVAC, electrical panel, plumbing, and water heater last replaced?
- Is there a deadline driving the sale (1031 exchange, divorce, estate, relocation)? That informs how much negotiation room exists.
- Crime grade is F in this area — have there been break-ins, vandalism, or insurance claims at this property in the last 3 years? What carrier currently insures it and at what premium?
- What's the average days-on-market for RENTAL listings here right now (not sales)? A rising rental-DOM trend means longer vacancies and softer asking-rent achievability than the comps imply.
- What's the recent tenant-quality profile in this submarket — average credit score on applications, eviction rate, late-payment / NSF rate, and stable-employment percentage? A property-management company in the area should have these aggregated.
- How much new for-sale + rental construction is in the pipeline within 1–3 miles? Heavy new supply typically softens prices + rents 12–24 months out; constrained supply supports both.
Investment metrics
- 1% rule
- 0.97% ✗
- Cap rate
- 7.38%
- Cash-on-cash
- 3.89%
- DSCR
- 1.17
- GRM
- 8.6
CMA / ARV
- ARV (median comp)
- $260,594
- List price
- $165,000
- Delta
- -36.68%
- Verdict
- UNDERPRICED
- Comps
- 8 within 1.0 mi
Projected returns pro-forma
-3.0% appreciation · 7.35% rent growth · sell at horizon
- IRR
- -5.5%
- Equity multiple
- 0.79×
- Total profit
- $-9,853
- Equity at exit
- $24,602
- IRR
- 8.7%
- Equity multiple
- 1.79×
- Total profit
- $36,683
- Equity at exit
- $14,266
Cash invested: $46,200 (down + closing). Projections, not guarantees.
Landlord ↔ Tenant lean methodology
- Overall (CITY)
- 34 Tenant-Leaning
- State Minnesota
- 46 Balanced · D+2
- County
- — inherits STATE
- City Minneapolis
- 34 Tenant-Leaning · D+50
ZIP-level market 55411
- Home prices YoY
- -8.7%
- Rents YoY
- 7.3%
- Active inventory
- 133
- Price-to-rent
- 8.6×
Monthly cashflow live
- Estimated rent
- $1,606 high interval (Pro) →
- Mortgage (P&I)
- −$865
- Tax from tax record
- −$185 /mo · $2,220/yr
- Insurance
- −$69
- HOA
- −$0
- Vacancy / Maint / Mgmt
- −$337
- Net cashflow
- $150
Break-even live
Sensitivity live
| Price | -10% $243 | -5% $196 | +0% $150 | +5% $103 | +10% $56 |
|---|---|---|---|---|---|
| Rent | -10% $23 | -5% $86 | +0% $150 | +5% $213 | +10% $277 |
| Rate | -1.0pp $233 | -0.5pp $192 | base $150 | +0.5pp $107 | +1.0pp $63 |
UW: 25.0% down · 7.5% · 30yr · 1.5% tax · 5.0% vac · 8.0% maint · 8.0% mgmt
Financing live
Cash to close
- Down payment
- $41,250
- Closing costs
- $4,950
- Reserves months
- —
- Total cash needed
- —
Loan-product check · same deal, 3 products live
Conventional
25% down · 7.5% · 30yr
- Down + closing
- —
- Monthly P&I
- —
- Monthly cashflow
- —
- DSCR
- —
- Eligible?
- —
Personal DTI + credit; lowest rate.
DSCR
20% down · 8.5% · 30yr
- Down + closing
- —
- Monthly P&I
- —
- Monthly cashflow
- —
- DSCR
- —
- Eligible?
- —
No personal income docs; deal must DSCR.
Hard money
10% down · 12.0% · 12mo
- Down + closing
- —
- Monthly P&I
- —
- Monthly cashflow
- —
- DSCR
- —
- Eligible?
- —
Short-term bridge; refi at stabilization.
Rent comps 39 comps
| Address | Beds | Baths | Sqft | Rent | $/sqft | DOM | Units | Dist |
|---|---|---|---|---|---|---|---|---|
| 1649 Russell Ave N Unit 2 Minneapolis, MN | 3.0 | 1.0 | 1011 | $1,700 | $1.68 | 0d | 1 | 0.17mi |
| 1649 Russell Ave N Unit 2 Minneapolis, MN | 3.0 | 1.0 | 1011 | $1,700 | $1.68 | 21d | 1 | 0.17mi |
| 2211 Queen Ave N Unit 1 Minneapolis, MN | 3.0 | 1.0 | 983 | $1,695 | $1.72 | 18d | 1 | 0.20mi |
| 2000 W Broadway Ave Minneapolis, MN | 2.0 | 1.0 | 952 | $1,350 | $1.42 | 8d | 4 | 0.30mi |
| 2356 N Thomas Ave Unit 2 Minneapolis, MN | 3.0 | 1.0 | 1000 | $1,800 | $1.80 | 44d | 1 | 0.38mi |
| 2323 26th Ave N Minneapolis, MN | 2.0 | 1.0 | 807 | $1,717 | $2.13 | 15d | 3 | 0.45mi |
| 1523 22nd Ave N Minneapolis, MN | 3.0 | 1.0 | 943 | $1,695 | $1.80 | 15d | 1 | 0.52mi |
| 1816 Zephyr Pl Minneapolis, MN | 3.0 | 1.0 | 1120 | $2,050 | $1.83 | 44d | 1 | 0.53mi |
| 2419 Plymouth Ave N Minneapolis, MN | 2.0–3.0 | 1.0 | 836 | $1,495 | $1.79 | 5d | 2 | 0.54mi |
| 1255 Queen Ave N Minneapolis, MN | 1.0–2.0 | 1.0 | 633 | $1,419 | $2.24 | 4d | 4 | 0.54mi |
| 1239 Sheridan Ave N Minneapolis, MN | 1.0–2.0 | 1.0 | 795 | $1,250 | $1.57 | 5d | 4 | 0.55mi |
| 1709 N 26th Ave Unit 3 Minneapolis, MN | 1.0 | 1.0 | 920 | $1,250 | $1.36 | 44d | 1 | 0.60mi |
| 1407 N 15th Ave Unit 2 Minneapolis, MN | 2.0 | 1.0 | 687 | $1,300 | $1.89 | 44d | 1 | 0.66mi |
| 2124 Fremont Ave N Minneapolis, MN | 2.0 | 1.0 | 1050 | $1,580 | $1.50 | 3d | 1 | 0.73mi |
| 1016 N Newton Ave Unit 4 Minneapolis, MN | 3.0 | 1.0 | 1009 | $1,895 | $1.88 | 44d | 1 | 0.76mi |
| 2947 Morgan Ave N Minneapolis, MN | 2.0 | 1.0 | 1106 | $1,950 | $1.76 | 0d | 1 | 0.87mi |
| 2947 Morgan Ave N Minneapolis, MN | 2.0 | 1.0 | 1106 | $1,950 | $1.76 | 15d | 1 | 0.87mi |
| 2620 Emerson Ave N Minneapolis, MN | 3.0 | 1.0 | 877 | $1,900 | $2.17 | 0d | 1 | 0.94mi |
| 835 W Broadway Ave Minneapolis, MN | 1.0–2.0 | 1.0–2.0 | 849 | $2,150 | $2.53 | 4d | 7 | 0.94mi |
| 801 N 21st Ave Unit 204 Minneapolis, MN | 1.0 | 1.0 | 750 | $875 | $1.17 | 44d | 1 | 0.99mi |
| 801 21st Ave N Minneapolis, MN | 1.0 | 1.0 | 750 | $875 | $1.17 | 5d | 2 | 0.99mi |
| 2600 France Ave N Unit 2600 Minneapolis, MN | 2.0 | 1.5 | 1100 | $1,599 | $1.45 | 5d | 1 | 1.03mi |
| 3230 N Penn Ave Unit 1 Minneapolis, MN | 1.0 | 1.0 | 765 | $895 | $1.17 | 5d | 1 | 1.06mi |
| 3255 N Logan Ave Unit 2 Minneapolis, MN | 2.0 | 1.0 | 900 | $995 | $1.11 | 18d | 1 | 1.14mi |
| 2107 N 5th Ave Unit 3 Minneapolis, MN | 1.0 | 1.0 | 687 | $900 | $1.31 | 44d | 1 | 1.15mi |
| 3322 Penn Ave N Minneapolis, MN | 1.0 | 1.0 | 660 | $1,350 | $2.05 | 15d | 1 | 1.16mi |
| 2226 Glenwood Ave Unit 1 Minneapolis, MN | 3.0 | 1.0 | 1100 | $1,399 | $1.27 | 0d | 1 | 1.25mi |
| 2212 Glenwood Ave Unit 1 Minneapolis, MN | 2.0 | 1.0 | 950 | $1,299 | $1.37 | 44d | 1 | 1.25mi |
| 1907 Glenwood Ave Minneapolis, MN | 1.0 | 1.0 | 600 | $850 | $1.42 | 0d | 1 | 1.31mi |
| 1707 Glenwood Ave Minneapolis, MN | 1.0 | 1.0 | 825 | $900 | $1.09 | 0d | 5 | 1.32mi |
| 1611 Glenwood Ave #1 Minneapolis, MN | 3.0 | 2.0 | 918 | $1,945 | $2.12 | 0d | 1 | 1.33mi |
| 3342 N Humboldt Ave Unit 2 Minneapolis, MN | 1.0 | 1.0 | 900 | $1,395 | $1.55 | 18d | 1 | 1.34mi |
| 224 Cedar Lake Rd N Unit 12 Minneapolis, MN | 2.0 | 1.0 | 750 | $1,100 | $1.47 | 44d | 1 | 1.42mi |
| 224 Cedar Lake Rd N Apt 9 Minneapolis, MN | 1.0 | 1.0 | 700 | $825 | $1.18 | 5d | 1 | 1.42mi |
| 3347 Emerson Ave N #2 Minneapolis, MN | 1.0 | 1.0 | 746 | $1,300 | $1.74 | 3d | 1 | 1.42mi |
| 222 Logan Ave N Minneapolis, MN | 1.0 | 1.0 | 989 | $1,250 | $1.26 | 18d | 1 | 1.46mi |
| 265 N Girard Ave Minneapolis, MN | 1.0–2.0 | 1.0–2.0 | 760 | $2,175 | $2.86 | 0d | 8 | 1.46mi |
| 1207 Glenwood Ave Minneapolis, MN | 1.0 | 1.0 | 593 | $1,452 | $2.45 | 0d | 6 | 1.47mi |
| 229 Irving Ave N Minneapolis, MN | 3.0 | 1.0–2.0 | 767 | $1,387 | $1.81 | 18d | 7 | 1.48mi |
Listing history 21 events
-
2026-05-18status Pending 989-char remark
-
2026-05-06historical Contingent - Inspection 989-char remark
-
2026-05-01$165,000 Active 989-char remark
-
2015-11-12historical
-
2015-11-01price $27,900
-
2015-10-28price $31,900
-
2015-10-20price $34,500
-
2015-10-12$35,990 Active
-
2015-10-07historical
-
2015-10-02price $38,999
-
2015-09-24status Active
-
2015-09-18historical
-
2015-09-11price $41,700
-
2015-08-12price $43,700
-
2015-07-31$48,200 Active
-
2007-10-01historical
-
2007-05-31$164,500
-
2004-02-06soldstatus $50,000
-
1992-07-02soldstatus $26,000
-
1992-05-26soldstatus $26,000
-
1992-01-31$27,900
ⓘ Source: listings_history table (triggers on properties + properties_extension) + one-shot
backfill from property_details.listing_events for pre-trigger history.
Tax reassessment forecast MN · Partial reset (capped growth)
- Current annual tax
- $2,220 · $185/mo
- Projected year-2 tax
- $2,220 · $185/mo
- Expected delta
- $0/yr ($0/mo · 0.0%)
ⓘ Screening estimate from a state-policy table — verify with the county assessor before closing.
Climate risk First Street
- Flood 1/10 Low FEMA zone X (unshaded) · 0% chance over 30 yrs
- Wildfire 1/10 Low
- Heat 2/10 Low 7 d/yr ≥99°F today · 14 d/yr by 30 yrs out
- Wind 2/10 Low
- Air quality 2/10 Low 1 unhealthy d/yr today · 1 by 30 yrs out
Nearby sold comps map
Loading sold comps map…
Walkable amenities ~0.75 mi
Loading nearby amenities…
Taxation est. · year 1
- Rental income
- $19,272
- − Mortgage interest
- −$9,243
- − Property taxes
- −$2,220
- − Insurance
- −$825
- − Repairs & maintenance
- −$1,542
- − Management
- −$1,542
- − Depreciation
- −$4,800
- Taxable loss
- −$899
- Est. tax savings @ 24.0%
- +$216
- After-tax cash flow
- $2,012/yr
For passive investors: Depreciation is non-cash, so a rental often shows a tax loss while cash-flowing — sheltering income. Rental losses are passive: they offset passive income freely, and up to $25,000/yr can offset ordinary (W-2) income if you actively participate and your MAGI is under $100k (phasing out to $0 by $150k); unused losses carry forward. On sale, claimed depreciation is recaptured at up to 25%, and gains may owe capital-gains tax (a 1031 exchange can defer both). Figures are a year-1 estimate at your 24.0% rate — not tax advice; consult a CPA.
Schools (NCES district)
- District
- Minneapolis Public School District
- NCES district ID
- 2721240
- Math proficiency
- 35% ▼ -7.00%
- Reading proficiency
- 46% ▼ -1.00%
- Median HH income
- $50,521
- Composite
- 34.92/100
- National rank
- #5067
- State rank
- #217 of 301 in MN
Livability — Minneapolis
- Score
- 78/100
- State rank
- #110
- US rank
- #2525
Category grades
Schools grade is shown separately in the Schools card above.
Census & demographics
- Census place
- Minneapolis, MN
- County
- Hennepin County · 1,150,272 people
- City population
- 417,555
- Metro
- Minneapolis-St. Paul-Bloomington, MN-WI
- Population (ZIP)
- 27,741
- Household income
- $60,225
- Rent vs Own
- Severe rent burden
- 1826.0
Population outlook (Hennepin County) Hauer SSP2
- Today (2025)
- 1,405,227 people
- By 2030
- 1,492,650 · +6.2%
- By 2040
- 1,660,157 · +18.1%
- By 2050
- 1,823,498 · +29.8%
- By 2075
- 2,221,283 · +58.1%
- By 2100
- 2,509,976 · +78.6%
Race, ethnicity, and origin ACS 2023
- Neighborhood character
- Diverse neighborhood (Simpson 0.68)
- Race & ethnicity
- Black 49% White 23% Two or more races 11% Hispanic / Latino 11% Asian 9%
- Hispanic origin (detail)
- Mexican 7% Puerto Rican 1%
- Common ancestry
- Portuguese 3% Lithuanian 2% Italian 1%
- Foreign-born
- 19% · Canada, Guatemala
- Languages at home
- 68% English-only · Other Asian/Pacific 8% Spanish 8%
Political lean MEDSL · Hennepin
- 2024 margin
- Solid D (+42.6) · D 70.2% · R 27.5% · Other 2.3%
- 2008→2024 swing
- +14.0pp toward D · 2008: 28.6pp · 2024: 42.6pp
- All cycles
- 2024: D+42.6 2020: D+43.2 2016: D+35.3 2012: D+27.1 2008: D+28.6
Not yet ingested
- Civics
- —
Market trends
- HPI YoY
- ▼ -33.91%
- Current HPI
- 356.6758
- Rent YoY
- ▲ 7.35%
- Metro
- Minneapolis-St. Paul-Bloomington, MN-WI
- State GDP YoY
- ▲ 2.41%
- F500 in state
- 34
Industry mix (Fortune 500 HQ in MN)
| Industry | F500 HQs | Revenue |
|---|---|---|
| Healthcare | 2 | $407B |
|
||
| Retail | 2 | $150B |
|
||
| Consumer Goods | 2 | $32B |
|
||
| Industrial Machinery | 2 | $6B |
|
||
| Agriculture | 1 | $40B |
|
||
| Healthcare / Medical Devices | 1 | $32B |
|
||
Price history
+491.4% since first listed21 events — show timeline
- 2026-05-18 Pending — NORTHSTARMLS as Distributed by MLS Grid
- 2026-05-06 Contingent — NORTHSTARMLS as Distributed by MLS Grid
- 2026-05-01 Listed $165,000 NORTHSTARMLS as Distributed by MLS Grid
- 2015-11-12 Listing Removed — NORTHSTARMLS as Distributed by MLS Grid
- 2015-11-01 Price Changed $27,900 NORTHSTARMLS as Distributed by MLS Grid
- 2015-10-28 Price Changed $31,900 NORTHSTARMLS as Distributed by MLS Grid
- 2015-10-20 Price Changed $34,500 NORTHSTARMLS as Distributed by MLS Grid
- 2015-10-12 Listed $35,990 NORTHSTARMLS as Distributed by MLS Grid
- 2015-10-07 Listing Removed — NORTHSTARMLS as Distributed by MLS Grid
- 2015-10-02 Price Changed $38,999 NORTHSTARMLS as Distributed by MLS Grid
- 2015-09-24 Relisted — NORTHSTARMLS as Distributed by MLS Grid
- 2015-09-18 Listing Removed — NORTHSTARMLS as Distributed by MLS Grid
- 2015-09-11 Price Changed $41,700 NORTHSTARMLS as Distributed by MLS Grid
- 2015-08-12 Price Changed $43,700 NORTHSTARMLS as Distributed by MLS Grid
- 2015-07-31 Listed $48,200 NORTHSTARMLS as Distributed by MLS Grid
- 2007-10-01 Listing Removed — NORTHSTARMLS as Distributed by MLS Grid
- 2007-05-31 Listed $164,500 NORTHSTARMLS as Distributed by MLS Grid
- 2004-02-06 Sold (Public Records) $50,000 Public Records
- 1992-07-02 Sold (Public Records) $26,000 Public Records
- 1992-05-26 Sold (MLS) $26,000 NORTHSTARMLS as Distributed by MLS Grid
- 1992-01-31 Listed $27,900 NORTHSTARMLS as Distributed by MLS Grid
Property tax history
+5.3%/yrLatest (2025): $2,220 · +2.1% YoY. Source: county tax records.
Cash-flow waterfall
monthlySold comps — $/sqft
last 12 mo · ≤1 miLoading sold comps…