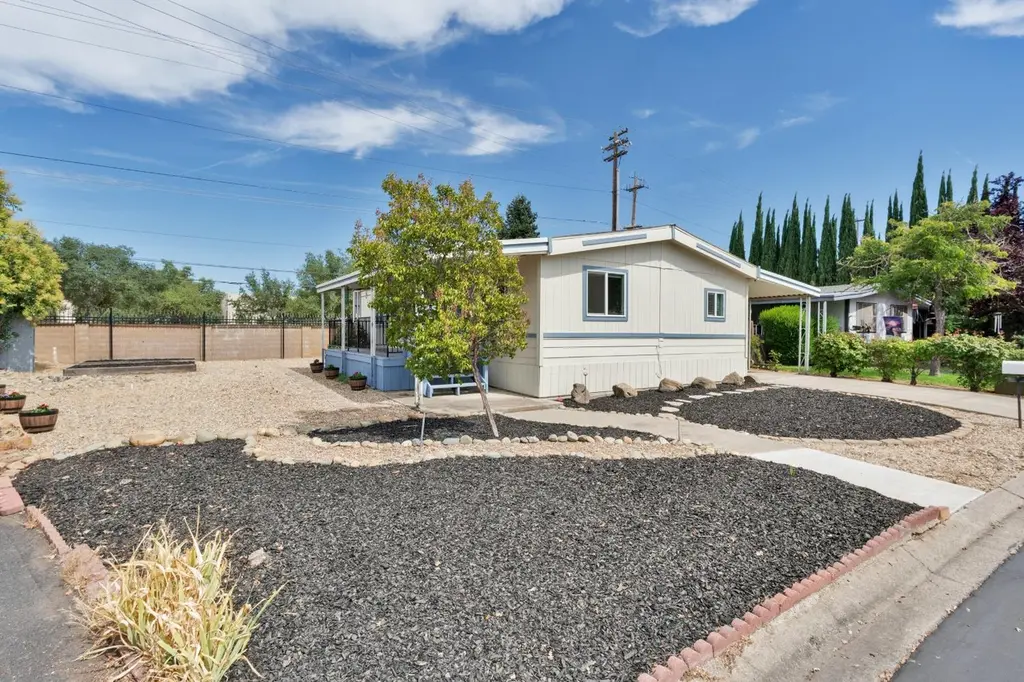
472 Oleander View Way · Rancho Cordova, CA
Flood risk 1/10 · Minimal
- FEMA flood zone
- X (unshaded)
- Chance of flooding over 30 yrs
- 0.0%
- Est. flood insurance / yr
- $507 – $1,088
Fire risk 5/10 · Moderate
- Est. fire insurance / yr
- $659 – $1,223
Heat risk 7/10 · Major
- Hot days now (above 102°F)
- 7 days/yr
- Hot days in 30 yrs
- 16 days/yr
Wind risk 1/10 · Minimal
- Chance of severe wind over 30 yrs
- —
Air-quality risk 10/10 · Severe
- Unhealthy air days now
- 33 days/yr
- Unhealthy air days in 30 yrs
- 35 days/yr
Risk factors via First Street. Map © Google.
Why this score? — see what drove the B grade
The composite is a weighted blend of 9 inputs, each scored 0–100. Each bar is that input's sub-score; the figure is the points it added to the 100-point composite (weight × sub-score).
- Cash flow +30.0/30.0
- ARV discount +10.6/15.0
- 1% rule +10.0/10.0
- DSCR +10.0/10.0
- Schools +4.4/10.0
- Livability +3.4/5.0
- Rent growth +2.7/5.0
- Condition / age +2.5/5.0
- Appreciation +0.0/10.0
$111,000
🖨 Deal sheet 📄 Offer letter ✓ Due diligence
Listing remarks
Welcome to 472 Oleander View Way a beautifully cared-for 2-bedroom, 2-bath home nestled in Rancho Cordova's highly sought-after 55+ Mobil Country Club community. This home sits on one of the largest lots in the park, offering the kind of outdoor space that's hard to find, perfect for gardening, relaxing with a good book, or letting your pets stretch their legs. The home has been thoughtfully updated for comfort and peace of mind: double-pane windows, newer flooring, a newer water heater, upgraded bathrooms, newer appliances, and modern pull-down blinds. You'll feel the pride of ownership the moment you walk in everything is ready for you to move in and start enjoying life. At Mobil Country
Key facts
- Newer flooring
- Newer appliances
- Newer water heater
Tags
Property features AI
Finance
- Other: Property address: 472 Oleander View Way, Rancho Cordova, CA 95670; Directions: From Hwy 50, take Sunrise Blvd south, turn right on Zinfandel Dr, then right at the clubhouse. Left at Heritage Glen, Right on Oleander View Way.
- Financial info: Land lease amount listed ($1,093) — not a land lease property
- HOA & community: No association; Located in a senior community; No land lease
Exterior
- Parking: Attached parking; Guest parking available
- Utilities: Cable available; Gas plumbed; 220V outlet in laundry; Public sewer; Public water
- Home design: Manufactured home in park; Double-wide; Single-story (manufactured); Built in 1981
- Construction: Composition roof; Metal skirting; Manufacturer: Champion
- Exterior features: Backyard; Irregular-shaped lot; Garden; Adjacent to greenbelt
Interior
- Kitchen: Free standing refrigerator; Built-in gas oven; Built-in gas range; Hood over range; Dishwasher; Disposal; Microwave; Pantry cabinet; Wood counters
- Bedrooms: 2 bedrooms
- Flooring: Laminate; Linoleum; Vinyl
- Bathrooms: 2 full bathrooms; Shower stall(s)
- Heating & cooling: Central air conditioning; Wall furnace heating
- Interior features: Partially furnished; Covered deck with rail and porch steps; Deck attached to living room; Pantry cabinet and wood countertops in kitchen; Dining area with skylight and space in kitchen; Pets allowed
- Laundry & utility: Washer and dryer included; Laundry inside the home in a dedicated room
Neighborhood map
What this means for you Summary
Snapshot
- This is a 2-bed/2.0-bath manufactured listed at $111k.
Deal economics
- At list price, monthly cash flow is $965 ($12k/yr) — positive.
- The deal already cash-flows at list — no discount required.
- Meets the 1% rule at list price ($2k rent vs $111k).
- Recommended offer: $109k (1.5% below list) — sets the bar for market timing.
- Cap rate 16.7% vs local median 3.0% in Rancho Cordova — top-decile yield for the area; either an underpriced asset or a hidden risk that comps aren't pricing in. Stress-test before assuming the spread holds.
Location & tenants
- Location reads 68/100 on livability (#268 in CA) — a middle-class / working-renter tenant base. Strengths: housing A+, employment B; Watch: schools C-, commute C-, crime D.
- San Juan Unified (suburban): math 40% / reading 62% proficiency, ranked #138 of 517 in CA (top 27%) — acceptable for families but not a draw, mixed tenant base, ~2y average lease.
- Market conditions: Rents flat; 223 active listings in the ZIP; 20 comparable units currently listed for rent nearby; rentals at typical pace (median 21d on market — plan ~3-4 weeks tenant-placement turnaround); solid renter incomes; 6,825 units permitted in Sacramento County in 2024 (1,752 in 5+ unit buildings).
Forward outlook
- Local home prices are declining (-3.0%/yr); year-one equity from $767 of loan paydown is wiped out by about $3k of value loss. Plan a longer hold.
- Sacramento County population projected at +17% by 2050 — long-run rental-demand tailwind backs the buy-and-hold thesis.
- At projected returns (-3.0% appreciation + 0.9% rent growth), your $31k cash investment doubles in ~4 years — after that, you're playing with house money.
Negotiation context
- It's been on market 20 days — a 2% lower offer ($109k) is reasonable based on typical stale-listing flexibility.
Risks & watch-outs
- Climate carrying-cost: moderate wildfire risk; extreme-heat days projected 7→16/yr by 2055 (HVAC capex compounding) — expect insurance premiums to compound above CPI over the hold.
Questions for the listing agent
- Is there a deadline driving the sale (1031 exchange, divorce, estate, relocation)? That informs how much negotiation room exists.
- Crime grade is D in this area — have there been break-ins, vandalism, or insurance claims at this property in the last 3 years? What carrier currently insures it and at what premium?
- What's the average days-on-market for RENTAL listings here right now (not sales)? A rising rental-DOM trend means longer vacancies and softer asking-rent achievability than the comps imply.
- What's the recent tenant-quality profile in this submarket — average credit score on applications, eviction rate, late-payment / NSF rate, and stable-employment percentage? A property-management company in the area should have these aggregated.
- How much new for-sale + rental construction is in the pipeline within 1–3 miles? Heavy new supply typically softens prices + rents 12–24 months out; constrained supply supports both.
Investment metrics
- 1% rule
- 1.84% ✓
- Cap rate
- 16.73%
- Cash-on-cash
- 37.27%
- DSCR
- 2.66
- GRM
- 4.5
CMA / ARV
- ARV (on-the-fly)
- $119,328
- Comps found
- 12
Show comp detail 12 sales within ~0.75 mi
| Address | Dist | Beds/Ba | Sqft | Sold | Price | $/sf | Match |
|---|---|---|---|---|---|---|---|
| 131 Royal Wood Ln | 0.17mi | 2/2.0 | 1,095 (+4%) | 3mo | $140,000 | $128 | 83 |
| 290 Sunny Hills Dr #290 | 0.07mi | 2/2.0 | 960 (-9%) | 0mo | $108,000 | $113 | 82 |
| 66 Pineacre Ln | 0.30mi | 2/2.0 | 1,080 (+2%) | 8mo | $126,900 | $118 | 75 |
| 27 Golden Inn Way | 0.22mi | 2/2.0 | 960 (-9%) | 1mo | $58,000 | $60 | 74 |
| 259 Rocky Hills Ln | 0.16mi | 2/1.0 | 990 (-6%) | 6mo | $94,900 | $96 | 73 |
| 146 Gumtree Dr | 0.32mi | 2/2.0 | 1,100 (+4%) | 10mo | $126,000 | $115 | 70 |
| 311 Sunny Hills Dr | 0.13mi | 2/2.0 | 1,200 (+14%) | 5mo | $99,900 | $83 | 67 |
| 86 Wilderness Rd | 0.30mi | 3/2.0 (+1) | 1,029 (-3%) | 12mo | $121,000 | $118 | 66 |
| 191 Whispering Pines Dr | 0.26mi | 2/2.0 | 1,152 (+9%) | 8mo | $65,000 | $56 | 66 |
| 1 Nobel Crest Ln | 0.22mi | 2/2.0 | 960 (-9%) | 14mo | $120,000 | $125 | 63 |
| 172 Rolling River Ln | 0.39mi | 2/2.0 | 1,160 (+10%) | 10mo | $105,000 | $91 | 57 |
| 55 Sheri Ridge Way | 0.29mi | 2/2.0 | 1,212 (+15%) | 8mo | $129,900 | $107 | 55 |
Match score weights: distance 35% · size 25% · config 20% · recency 20%. Top-matched comps best support the ARV.
Projected returns pro-forma
-3.0% appreciation · 0.9% rent growth · sell at horizon
- IRR
- 30.9%
- Equity multiple
- 2.26×
- Total profit
- $39,210
- Equity at exit
- $16,550
- IRR
- 37.0%
- Equity multiple
- 4.10×
- Total profit
- $96,469
- Equity at exit
- $9,597
Cash invested: $31,080 (down + closing). Projections, not guarantees.
Landlord ↔ Tenant lean methodology
- Overall (STATE)
- 18 Strongly Tenant-Friendly
- State California
- 18 Strongly Tenant-Friendly · D+13
- County
- — inherits STATE
- City
- — inherits STATE
ZIP-level market 95670
- Rents YoY
- 0.9%
- Active inventory
- 223
- Price-to-rent
- 4.5×
Monthly cashflow live
- Estimated rent
- $2,048 high interval (Pro) →
- Mortgage (P&I)
- −$582
- Tax from tax record
- −$24 /mo · $290/yr
- Insurance
- −$46
- HOA
- −$0
- Vacancy / Maint / Mgmt
- −$430
- Net cashflow
- $965
Break-even live
UW: 25.0% down · 7.5% · 30yr · 1.5% tax · 5.0% vac · 8.0% maint · 8.0% mgmt
Financing live
Cash to close
- Down payment
- $27,750
- Closing costs
- $3,330
- Reserves months
- —
- Total cash needed
- —
Loan-product check · same deal, 3 products live
Conventional
25% down · 7.5% · 30yr
- Down + closing
- —
- Monthly P&I
- —
- Monthly cashflow
- —
- DSCR
- —
- Eligible?
- —
Personal DTI + credit; lowest rate.
DSCR
20% down · 8.5% · 30yr
- Down + closing
- —
- Monthly P&I
- —
- Monthly cashflow
- —
- DSCR
- —
- Eligible?
- —
No personal income docs; deal must DSCR.
Hard money
10% down · 12.0% · 12mo
- Down + closing
- —
- Monthly P&I
- —
- Monthly cashflow
- —
- DSCR
- —
- Eligible?
- —
Short-term bridge; refi at stabilization.
Rent comps 20 comps
| Address | Beds | Baths | Sqft | Rent | $/sqft | DOM | Units | Dist |
|---|---|---|---|---|---|---|---|---|
| 11260 Point East Dr Rancho Cordova, CA | 1.0–2.0 | 1.0 | 615 | $1,985 | $3.23 | 2d | 29 | 0.34mi |
| 2437 Rashawn Dr Rancho Cordova, CA | 2.0 | 1.0 | 970 | $1,900 | $1.96 | 8d | 1 | 0.46mi |
| 2330 Vehicle Dr Rancho Cordova, CA | 1.0–2.0 | 1.0–2.0 | 847 | $2,225 | $2.63 | 2d | 1 | 0.48mi |
| 2330 Vehicle Dr Rancho Cordova, CA | 1.0–2.0 | 1.0–2.0 | 847 | $2,230 | $2.63 | 20d | 9 | 0.48mi |
| 2220 Cemo Cir Gold River, CA | 2.0–3.0 | 2.0 | 1203 | $2,499 | $2.08 | 2d | 7 | 0.53mi |
| 11150 Trinity River Dr Rancho Cordova, CA | 2.0–3.0 | 2.0 | 1091 | $1,850 | $1.69 | 44d | 2 | 0.54mi |
| 11070 Hirschfeld Way Rancho Cordova, CA | 1.0–2.0 | 1.0 | 800 | $1,880 | $2.35 | 3d | 4 | 0.54mi |
| 11150 Trinity River Dr #79 Rancho Cordova, CA | 2.0 | 1.0 | 941 | $1,980 | $2.10 | 24d | 1 | 0.58mi |
| 11112 Congo River Ct Rancho Cordova, CA | 3.0 | 2.0 | 1407 | $2,750 | $1.95 | 17d | 1 | 0.61mi |
| 10890 Coloma Rd Rancho Cordova, CA | 2.0 | 1.0 | 925 | $1,499 | $1.62 | 24d | 3 | 0.92mi |
| 10870 Coloma Rd Rancho Cordova, CA | 2.0 | 1.0 | 950 | $1,499 | $1.58 | 3d | 1 | 1.00mi |
| 10922 Scotsman Way Rancho Cordova, CA | 2.0 | 2.0 | 1100 | $2,050 | $1.86 | 18d | 1 | 1.01mi |
| 10918 Scotsman Way Unit 10918 Rancho Cordova, CA | 2.0 | 2.0 | 1183 | $1,795 | $1.52 | 44d | 1 | 1.02mi |
| 2253 Zinfandel Dr Rancho Cordova, CA | 3.0 | 2.0 | 1204 | $2,200 | $1.83 | 44d | 1 | 1.03mi |
| 2652 Los Nogales Way Rancho Cordova, CA | 2.0 | 2.0 | 1000 | $2,000 | $2.00 | 44d | 1 | 1.06mi |
| 2657 McGregor Dr Rancho Cordova, CA | 2.0 | 2.0 | 1012 | $1,595 | $1.58 | 44d | 1 | 1.09mi |
| 1990 Benita Dr Rancho Cordova, CA | 2.0 | 1.5 | 960 | $2,300 | $2.40 | 44d | 1 | 1.11mi |
| 10780 Coloma Rd Rancho Cordova, CA | 1.0–2.0 | 1.0 | 760 | $1,515 | $1.99 | 3d | 7 | 1.13mi |
| 10680 Coloma Rd Rancho Cordova, CA | 1.0–2.0 | 1.0 | 730 | $1,889 | $2.59 | 2d | 11 | 1.35mi |
| 2751 Don Juan Dr Apt 16 Rancho Cordova, CA | 2.0 | 1.5 | 960 | $1,875 | $1.95 | 44d | 1 | 1.44mi |
Tax reassessment forecast CA · Resets to sale price
- Current annual tax
- $290 · $24/mo
- Projected year-2 tax
- $844 · $70/mo
- Expected delta
- +$554/yr (+$46/mo · 191.3%)
ⓘ Screening estimate from a state-policy table — verify with the county assessor before closing.
Climate risk First Street
- Flood 1/10 Low FEMA zone X (unshaded) · 0% chance over 30 yrs
- Wildfire 5/10 Major
- Heat 7/10 Severe 7 d/yr ≥102°F today · 16 d/yr by 30 yrs out
- Wind 1/10 Low
- Air quality 10/10 Extreme 33 unhealthy d/yr today · 35 by 30 yrs out
Nearby sold comps map
Loading sold comps map…
Walkable amenities ~0.75 mi
Loading nearby amenities…
Taxation est. · year 1
- Rental income
- $24,573
- − Mortgage interest
- −$6,218
- − Property taxes
- −$290
- − Insurance
- −$555
- − Repairs & maintenance
- −$1,966
- − Management
- −$1,966
- − Depreciation
- −$3,229
- Taxable income
- $10,350
- Est. tax owed @ 24.0%
- −$2,484
- After-tax cash flow
- $9,099/yr
For passive investors: Depreciation is non-cash, so a rental often shows a tax loss while cash-flowing — sheltering income. Rental losses are passive: they offset passive income freely, and up to $25,000/yr can offset ordinary (W-2) income if you actively participate and your MAGI is under $100k (phasing out to $0 by $150k); unused losses carry forward. On sale, claimed depreciation is recaptured at up to 25%, and gains may owe capital-gains tax (a 1031 exchange can defer both). Figures are a year-1 estimate at your 24.0% rate — not tax advice; consult a CPA.
Schools (NCES district)
- District
- San Juan Unified
- NCES district ID
- 0634620
- Math proficiency
- 40% ▲ 3.00%
- Reading proficiency
- 62% ▲ 16.00%
- Median HH income
- $55,655
- Composite
- 44.07/100
- National rank
- #2878
- State rank
- #138 of 517 in CA
Livability — Rancho Cordova
- Score
- 68/100
- State rank
- #268
- US rank
- #9126
Category grades
Schools grade is shown separately in the Schools card above.
Census & demographics
- Census place
- Rancho Cordova, CA
- County
- Sacramento County · 1,539,646 people
- City population
- 98,329
- Metro
- Sacramento-Roseville-Folsom, CA
- Population (ZIP)
- 58,819
- Household income
- $89,484
- Rent vs Own
- Severe rent burden
- 2389.0
Population outlook (Sacramento County) Hauer SSP2
- Today (2025)
- 1,660,763 people
- By 2030
- 1,732,990 · +4.3%
- By 2040
- 1,855,755 · +11.7%
- By 2050
- 1,941,335 · +16.9%
- By 2075
- 2,046,162 · +23.2%
- By 2100
- 1,961,444 · +18.1%
Race, ethnicity, and origin ACS 2023
- Neighborhood character
- Diverse neighborhood (Simpson 0.67)
- Race & ethnicity
- White 51% Hispanic / Latino 21% Two or more races 12% Asian 12% Black 10% Native American 1%
- Hispanic origin (detail)
- Mexican 17%
- Common ancestry
- Scotch-Irish 2% Subsaharan African 2% Italian 2%
- Foreign-born
- 24% · Canada, Vietnam, South Korea
- Languages at home
- 66% English-only · Spanish 13% Other Indo-European 7% Russian/Polish/Slavic 5%
Political lean MEDSL · Sacramento
- 2024 margin
- D (+19.7) · D 58.1% · R 38.4% · Other 3.5%
- 2008→2024 swing
- +0.7pp no change · 2008: 19.0pp · 2024: 19.7pp
- All cycles
- 2024: D+19.7 2020: D+25.3 2016: D+23.7 2012: D+16.3 2008: D+19.0
Not yet ingested
- Civics
- —
Market trends
- HPI YoY
- ▼ -263.38%
- Current HPI
- 300.0788
- Rent YoY
- ▲ 0.90%
- Metro
- Sacramento-Roseville-Folsom, CA
- State GDP YoY
- ▲ 3.21%
- F500 in state
- 116
Industry mix (Fortune 500 HQ in CA)
| Industry | F500 HQs | Revenue |
|---|---|---|
| Technology | 27 | $1,492B |
|
||
| Financial Services | 3 | $174B |
|
||
| Retail | 3 | $44B |
|
||
| Insurance | 3 | $26B |
|
||
| Media / Entertainment | 2 | $115B |
|
||
| Pharmaceuticals / Biotech | 2 | $62B |
|
||
Property tax history
+3.3%/yrLatest (2025): $290 · -2.1% YoY. Source: county tax records.
Cash-flow waterfall
monthlySold comps — $/sqft
last 12 mo · ≤1 miLoading sold comps…