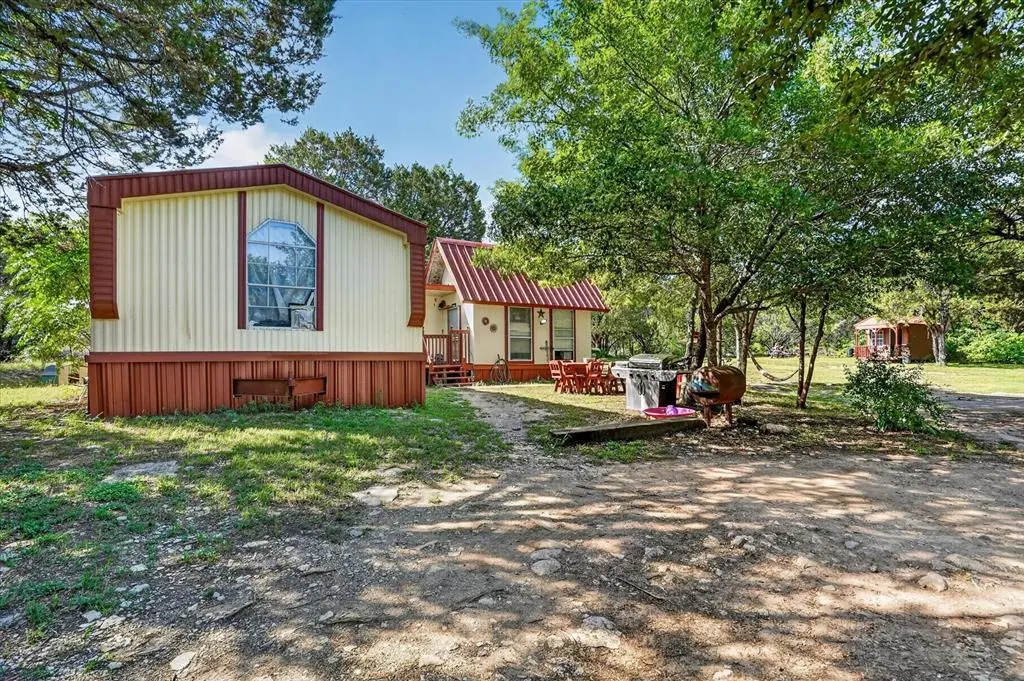
2719 River View Trl · Pecan Plantation, TX
Flood risk 1/10 · Minimal
- FEMA flood zone
- X (unshaded)
- Chance of flooding over 30 yrs
- 0.0%
- Est. flood insurance / yr
- $507 – $1,088
Fire risk 5/10 · Moderate
- Est. fire insurance / yr
- $1,222 – $2,270
Heat risk 7/10 · Major
- Hot days now (above 109°F)
- 7 days/yr
- Hot days in 30 yrs
- 24 days/yr
Wind risk 6/10 · Moderate
- Chance of severe wind over 30 yrs
- 27.0%
Air-quality risk 2/10 · Minimal
- Unhealthy air days now
- 1 days/yr
- Unhealthy air days in 30 yrs
- 2 days/yr
Risk factors via First Street. Map © Google.
Why this score? — see what drove the D grade
The composite is a weighted blend of 9 inputs, each scored 0–100. Each bar is that input's sub-score; the figure is the points it added to the 100-point composite (weight × sub-score).
- Cash flow +14.2/30.0
- ARV discount +7.6/15.0
- DSCR +4.3/10.0
- Schools +4.0/10.0
- Livability +3.5/5.0
- 1% rule +2.8/10.0
- Rent growth +2.8/5.0
- Condition / age +2.5/5.0
- Appreciation +0.0/10.0
$169,000
🖨 Deal sheet (PDF) 📄 Offer letter ✓ Due diligence
Listing remarks
Nestled on 3.15 tree-covered acres, this unique Granbury property offers privacy, versatility, and endless potential. The approximately 1,300 sqft main home is complemented by two additional cabins, creating the perfect setup for multi-generational living, guest accommodations, rental income, or hobby space. One cabin features 2 bedrooms, 1 bathroom, a kitchen, and washroom, while the second cabin provides excellent storage or workshop potential. Surrounded by mature trees and peaceful scenery, this property offers the feel of country living while remaining conveniently located near Granbury amenities. Whether you are looking for a full-time residence, weekend retreat, or investment opportu
Key facts
- Guest accommodations
- Tree-covered acres
- Excellent storage
Tags
Property features AI
Finance
- Other: Property located in River Country Acres Add subdivision; Multi-parcel property; Some personal property excluded: washer/dryer, TVs and mounts, living room speakers
- Financial info: Cash offers accepted; No second mortgage
- HOA & community: No association
Exterior
- Parking: Open outside parking (no covered or carport spaces)
- Security: Smoke detector(s); Audio and video surveillance devices present
- Utilities: City water; Septic system; No municipal utility district
- Home design: Single family residence; One story; Residential, detached property
- Construction: Metal roof; Pillar/post/pier foundation; Built in 1980; Preowned condition
- Exterior features: 3.107 acres with brush and many trees; Acreage lot
Interior
- Kitchen: Electric oven; Built-in cabinets; Solid surface (non-natural) countertops; Eat-in kitchen
- Bedrooms: Primary bedroom on main level; 3 total bedrooms
- Bathrooms: 2 full bathrooms
- Heating & cooling: Ceiling fan(s); Window unit(s)
- Interior features: Eat-in kitchen; One living area; One dining area; 3 total rooms
- Laundry & utility: Washer and dryer excluded from sale
Neighborhood map
What this means for you Summary
Snapshot
- This is a 3-bed/2.0-bath single-family listed at $169k.
Deal economics
- At list price, monthly cash flow is $28 ($330/yr) — positive.
- The deal already cash-flows at list — no discount required.
- To meet the 1% rule (rent ≥ 1% of price), the offer needs to be $132k (21.9% below list).
- Recommended offer: $132k (21.9% below list) — sets the bar for 1% rule.
- Cap rate 6.5% vs local median 2.3% in Pecan Plantation — top-decile yield for the area; either an underpriced asset or a hidden risk that comps aren't pricing in. Stress-test before assuming the spread holds.
Location & tenants
- Location reads 70/100 on livability (#362 in TX) — a middle-class / working-renter tenant base. Strengths: crime A+, employment A+, housing A+; Watch: health & safety D+, amenities F, commute F.
- Granbury ISD (town): math 46% / reading 46% proficiency, ranked #237 of 826 in TX (top 29%) — families likely to look elsewhere, expect single-tenant / working-renter base with shorter leases.
- Zoned schools: Mambrino School (math 53% / reading 48%, grade D+, #833 of 4,322 statewide, top 20%, 886 students, 53% FRL); Granbury Middle (math 35% / reading 40%, grade F, #736 of 1,662 statewide, top 45%, 846 students, 68% FRL); Granbury H S (math 38% / reading 51%, grade F, #652 of 1,632 statewide, top 43%, 2,202 students, 46% FRL).
- Market conditions: Rents rising (+1.1%/yr); 930 active listings in the ZIP; 125 units permitted in Hood County in 2024 (0 in 5+ unit buildings).
Forward outlook
- Local home prices are declining (-3.0%/yr); year-one equity from $1k of loan paydown is wiped out by about $5k of value loss. Plan a longer hold.
- Hood County population projected at +29% by 2050 — long-run rental-demand tailwind backs the buy-and-hold thesis.
Negotiation context
- It's been on market 17 days — a 2% lower offer ($166k) is reasonable based on typical stale-listing flexibility.
- 2 sale attempts with the ask held roughly flat each time — persistent listings suggest the price (not the market) is what's stuck; bring a comps-based counter.
Risks & watch-outs
- Climate carrying-cost: major wind risk, 27% chance of damaging wind over 30y; moderate wildfire risk; extreme-heat days projected 7→24/yr by 2055 (HVAC capex compounding) — expect insurance premiums to compound above CPI over the hold.
Questions for the listing agent
- Is there a deadline driving the sale (1031 exchange, divorce, estate, relocation)? That informs how much negotiation room exists.
- Schools are D-rated, which usually means shorter tenancies and higher turnover. Who's the typical renter profile here, and what's been the actual vacancy rate?
- The area grade is low — what's the realistic commute time and amenity access for the typical tenant pool here? Any planned neighborhood developments (good or bad) we should know about?
- What's the average days-on-market for RENTAL listings here right now (not sales)? A rising rental-DOM trend means longer vacancies and softer asking-rent achievability than the comps imply.
- What's the recent tenant-quality profile in this submarket — average credit score on applications, eviction rate, late-payment / NSF rate, and stable-employment percentage? A property-management company in the area should have these aggregated.
- How much new for-sale + rental construction is in the pipeline within 1–3 miles? Heavy new supply typically softens prices + rents 12–24 months out; constrained supply supports both.
Investment metrics
- 1% rule
- 0.78% ✗
- Cap rate
- 6.49%
- Cash-on-cash
- 0.70%
- DSCR
- 1.03
- GRM
- 10.7
CMA / ARV
- ARV (median comp)
- $169,243
- List price
- $169,000
- Delta
- 9.31%
- Verdict
- FAIR
- Comps
- 2 within 1.0 mi
Projected returns pro-forma
-3.0% appreciation · 1.1% rent growth · sell at horizon
- IRR
- -17.1%
- Equity multiple
- 0.40×
- Total profit
- $-28,182
- Equity at exit
- $25,198
- IRR
- -12.6%
- Equity multiple
- 0.32×
- Total profit
- $-32,365
- Equity at exit
- $14,612
Cash invested: $47,320 (down + closing). Projections, not guarantees.
Landlord ↔ Tenant lean methodology
- Overall (STATE)
- 87 Strongly Landlord-Friendly
- State Texas
- 87 Strongly Landlord-Friendly · R+5
- County
- — inherits STATE
- City
- — inherits STATE
ZIP-level market 76048
- Home prices YoY
- -23.4%
- Rents YoY
- 1.1%
- Active inventory
- 930
- Price-to-rent
- 10.7×
Monthly cashflow live
- Estimated rent
- $1,320 medium interval (Pro) →
- Mortgage (P&I)
- −$886
- Tax from tax record
- −$59 /mo · $704/yr
- Insurance
- −$70
- HOA
- −$0
- Vacancy / Maint / Mgmt
- −$277
- Net cashflow
- $28
Break-even live
Sensitivity live
| Price | -10% $123 | -5% $75 | +0% $28 | +5% $-20 | +10% $-68 |
|---|---|---|---|---|---|
| Rent | -10% $-77 | -5% $-25 | +0% $28 | +5% $80 | +10% $132 |
| Rate | -1.0pp $113 | -0.5pp $71 | base $28 | +0.5pp $-16 | +1.0pp $-61 |
UW: 25.0% down · 7.5% · 30yr · 1.5% tax · 5.0% vac · 8.0% maint · 8.0% mgmt
Financing live
Cash to close
- Down payment
- $42,250
- Closing costs
- $5,070
- Reserves months
- —
- Total cash needed
- —
Loan-product check · same deal, 3 products live
Conventional
25% down · 7.5% · 30yr
- Down + closing
- —
- Monthly P&I
- —
- Monthly cashflow
- —
- DSCR
- —
- Eligible?
- —
Personal DTI + credit; lowest rate.
DSCR
20% down · 8.5% · 30yr
- Down + closing
- —
- Monthly P&I
- —
- Monthly cashflow
- —
- DSCR
- —
- Eligible?
- —
No personal income docs; deal must DSCR.
Hard money
10% down · 12.0% · 12mo
- Down + closing
- —
- Monthly P&I
- —
- Monthly cashflow
- —
- DSCR
- —
- Eligible?
- —
Short-term bridge; refi at stabilization.
Listing history 16 events
-
2026-06-21days on market $169,000 Active 17 DOM
-
2026-06-18days on market $169,000 Active 14 DOM
-
2026-06-17days on market $169,000 Active 13 DOM
-
2026-06-16days on market $169,000 Active 12 DOM
-
2026-06-15days on market $169,000 Active 11 DOM
-
2026-06-13days on market $169,000 Active 9 DOM
-
2026-06-09days on market $169,000 Active 5 DOM
-
2026-06-08days on market $169,000 Active 4 DOM
-
2026-06-07days on market $169,000 Active 3 DOM
-
2026-06-04remarks 699-char remark
-
2026-06-04pricestatusdays on market $169,000 Active 1 DOM
-
2026-05-06historical
-
2026-04-18price $185,000
-
2026-01-07price $235,000
-
2025-09-15price $285,000
-
2025-08-28$295,000 Active
ⓘ Source: listings_history table (triggers on properties + properties_extension) + one-shot
backfill from property_details.listing_events for pre-trigger history.
Tax reassessment forecast TX · Resets to sale price
- Current annual tax
- $704 · $59/mo
- Projected year-2 tax
- $3,093 · $258/mo
- Expected delta
- +$2,389/yr (+$199/mo · 339.6%)
ⓘ Screening estimate from a state-policy table — verify with the county assessor before closing.
Climate risk First Street
- Flood 1/10 Low FEMA zone X (unshaded) · 0% chance over 30 yrs
- Wildfire 5/10 Major
- Heat 7/10 Severe 7 d/yr ≥109°F today · 24 d/yr by 30 yrs out
- Wind 6/10 Major 27% chance of damaging wind over 30 yrs
- Air quality 2/10 Low 1 unhealthy d/yr today · 2 by 30 yrs out
Nearby sold comps map
Loading sold comps map…
Walkable amenities ~0.75 mi
Loading nearby amenities…
Taxation est. · year 1
- Rental income
- $15,840
- − Mortgage interest
- −$9,467
- − Property taxes
- −$704
- − Insurance
- −$845
- − Repairs & maintenance
- −$1,267
- − Management
- −$1,267
- − Depreciation
- −$4,916
- Taxable loss
- −$2,626
- Est. tax savings @ 24.0%
- +$630
- After-tax cash flow
- $961/yr
For passive investors: Depreciation is non-cash, so a rental often shows a tax loss while cash-flowing — sheltering income. Rental losses are passive: they offset passive income freely, and up to $25,000/yr can offset ordinary (W-2) income if you actively participate and your MAGI is under $100k (phasing out to $0 by $150k); unused losses carry forward. On sale, claimed depreciation is recaptured at up to 25%, and gains may owe capital-gains tax (a 1031 exchange can defer both). Figures are a year-1 estimate at your 24.0% rate — not tax advice; consult a CPA.
Schools (NCES district)
- District
- Granbury ISD
- NCES district ID
- 4821390
- Math proficiency
- 46% ▬ 0.00%
- Reading proficiency
- 46% ▲ 4.00%
- Median HH income
- $55,856
- Composite
- 40.04/100
- National rank
- #3820
- State rank
- #237 of 826 in TX
Livability — Pecan Plantation
- Score
- 70/100
- State rank
- #362
- US rank
- #7773
Category grades
Schools grade is shown separately in the Schools card above.
Census & demographics
- County
- Hood County · 58,506 people
- Metro
- Granbury, TX
- Population (ZIP)
- 27,000
- Household income
- $70,346
- Rent vs Own
- Severe rent burden
- 612.0
Population outlook (Hood County) Hauer SSP2
- Today (2025)
- 63,502 people
- By 2030
- 67,459 · +6.2%
- By 2040
- 74,958 · +18.0%
- By 2050
- 81,922 · +29.0%
- By 2075
- 98,872 · +55.7%
- By 2100
- 107,796 · +69.8%
Race, ethnicity, and origin ACS 2023
- Neighborhood character
- Predominantly White (80%)
- Race & ethnicity
- White 80% Hispanic / Latino 14% Two or more races 11% Black 1%
- Hispanic origin (detail)
- Mexican 13%
- Common ancestry
- Italian 2% Slovak 2% Portuguese 1%
- Foreign-born
- 4% · Canada
- Languages at home
- 89% English-only · Spanish 10%
Political lean MEDSL · Hood
- 2024 margin
- Solid R (+66.0) · D 16.6% · R 82.6%
- 2008→2024 swing
- -11.9pp toward R · 2008: -54.0pp · 2024: -66.0pp
- All cycles
- 2024: R+66.0 2020: R+64.1 2016: R+66.5 2012: R+64.7 2008: R+54.0
Not yet ingested
- Civics
- —
Market trends
- HPI YoY
- ▼ -83.25%
- Current HPI
- 272.2126
- Rent YoY
- ▲ 1.10%
- Metro
- Granbury, TX
- State GDP YoY
- ▲ 3.95%
- F500 in state
- 110
Industry mix (Fortune 500 HQ in TX)
| Industry | F500 HQs | Revenue |
|---|---|---|
| Energy | 16 | $1,198B |
|
||
| Technology | 5 | $198B |
|
||
| Engineering / Construction | 4 | $72B |
|
||
| Energy Services | 3 | $60B |
|
||
| Utilities | 3 | $41B |
|
||
| Healthcare | 2 | $330B |
|
||
Price history
-42.7% since first listed6 events — show timeline
- 2026-06-04 Listed $169,000 NTREIS
- 2026-05-06 Listing Removed — NTREIS
- 2026-04-18 Price Changed $185,000 NTREIS
- 2026-01-07 Price Changed $235,000 NTREIS
- 2025-09-15 Price Changed $285,000 NTREIS
- 2025-08-28 Listed $295,000 NTREIS
Property tax history
+5.0%/yrLatest (2025): $704 · +10.9% YoY. Source: county tax records.
Cash-flow waterfall
monthlySold comps — $/sqft
last 12 mo · ≤1 miLoading sold comps…