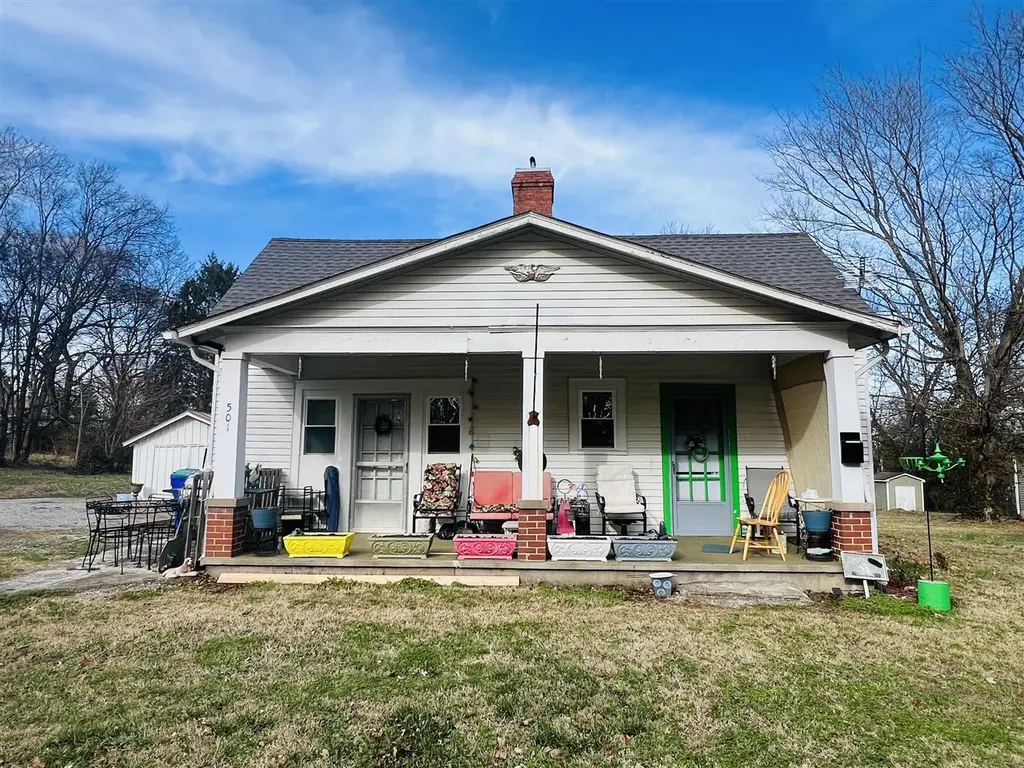
501 E Madison St · Franklin, KY
Flood risk 1/10 · Minimal
- FEMA flood zone
- X (unshaded)
- Chance of flooding over 30 yrs
- 0.0%
- Est. flood insurance / yr
- $507 – $1,088
Fire risk 1/10 · Minimal
- Est. fire insurance / yr
- $839 – $1,559
Heat risk 5/10 · Moderate
- Hot days now (above 106°F)
- 7 days/yr
- Hot days in 30 yrs
- 20 days/yr
Wind risk 3/10 · Minor
- Chance of severe wind over 30 yrs
- 8.0%
Air-quality risk 2/10 · Minimal
- Unhealthy air days now
- 0 days/yr
- Unhealthy air days in 30 yrs
- 1 days/yr
Risk factors via First Street. Map © Google.
Why this score? — see what drove the C+ grade
The composite is a weighted blend of 9 inputs, each scored 0–100. Each bar is that input's sub-score; the figure is the points it added to the 100-point composite (weight × sub-score).
- Cash flow +23.7/30.0
- ARV discount +15.0/15.0
- DSCR +7.6/10.0
- 1% rule +4.9/10.0
- Livability +3.2/5.0
- Schools +2.9/10.0
- Rent growth +2.5/5.0
- Condition / age +2.5/5.0
- Appreciation +0.0/10.0
$134,000
🖨 Deal sheet (PDF) 📄 Offer letter ✓ Due diligence
Listing remarks MLS
This charming home is rich with character and timeless appeal. Imagine the stories these walls hold. 1875 circa according to tax records. Offering 2 bedrooms and 1 bath and sits on a large level lot with space to enjoy outdoor living, gardening, etc. The detached building provides additional storage or flexible use. Recent updates include newer windows and a newer water heater. A rare opportunity to own a piece of history.
Key facts
- 0.41 acre lot
- Built 1875
- Listed 155 days
Neighborhood map
What this means for you Summary
Snapshot
- This is a 2-bed/1.0-bath single-family listed at $134k.
Deal economics
- At list price, monthly cash flow is $256 ($3k/yr) — positive.
- The deal already cash-flows at list — no discount required.
- To meet the 1% rule (rent ≥ 1% of price), the offer needs to be $133k (1.1% below list).
- Recommended offer: $118k (12.0% below list) — sets the bar for market timing.
- Cap rate 8.6% vs local median 3.9% in Franklin — top-decile yield for the area; either an underpriced asset or a hidden risk that comps aren't pricing in. Stress-test before assuming the spread holds.
Location & tenants
- Location reads 65/100 on livability (#266 in KY) — a middle-class / working-renter tenant base. Strengths: cost of living A+, housing A+, crime A; Watch: schools F, amenities F, commute F.
- Simpson County (town): math 29% / reading 39% proficiency, ranked #72 of 165 in KY (top 44%) — families likely to look elsewhere, expect single-tenant / working-renter base with shorter leases.
- Market conditions: 255 active listings in the ZIP; 15 comparable units currently listed for rent nearby; rentals lingering (median 45d on market — plan ~5-8 weeks vacancy on turnover, expect pricing pressure); 53% of comp listings sitting > 30 days — soft ceiling on asking rent; 204 units permitted in Simpson County in 2024 (31 in 5+ unit buildings).
Forward outlook
- Local home prices are declining (-3.0%/yr); year-one equity from $926 of loan paydown is wiped out by about $4k of value loss. Plan a longer hold.
- Simpson County population projected at +12% by 2050 — modest demand growth; plan on rents tracking national, not racing it.
Negotiation context
- It's been on market 156 days — a 12% lower offer ($118k) is reasonable based on typical stale-listing flexibility.
- 2 sale attempts; this cycle's ask has dropped $21k (14%) from the opening price — seller is motivated, your offer sets the floor, not the list.
- Current owner paid $28k; list at $134k implies a 370% gain — meaningful room to come down on a strong offer.
Risks & watch-outs
- Watch-outs: built in 1875 — expect roof / HVAC / electrical / plumbing capex.
- Climate carrying-cost: extreme-heat days projected 7→20/yr by 2055 (HVAC capex compounding) — expect insurance premiums to compound above CPI over the hold.
Questions for the listing agent
- It's been on market 156 days. Have you received any prior offers? Is the seller open to a 12% concession, seller financing, or rate buy-down credit?
- Built in 1875 — when were the roof, HVAC, electrical panel, plumbing, and water heater last replaced?
- Why hasn't it sold? Are there any deal-killer items the seller is aware of (foundation, flood, title, zoning, code violations)?
- Is there a deadline driving the sale (1031 exchange, divorce, estate, relocation)? That informs how much negotiation room exists.
- Schools are F-rated, which usually means shorter tenancies and higher turnover. Who's the typical renter profile here, and what's been the actual vacancy rate?
- What's the average days-on-market for RENTAL listings here right now (not sales)? A rising rental-DOM trend means longer vacancies and softer asking-rent achievability than the comps imply.
- What's the recent tenant-quality profile in this submarket — average credit score on applications, eviction rate, late-payment / NSF rate, and stable-employment percentage? A property-management company in the area should have these aggregated.
- How much new for-sale + rental construction is in the pipeline within 1–3 miles? Heavy new supply typically softens prices + rents 12–24 months out; constrained supply supports both.
Investment metrics
- 1% rule
- 0.99% ✗
- Cap rate
- 8.58%
- Cash-on-cash
- 8.17%
- DSCR
- 1.36
- GRM
- 8.4
CMA / ARV
- ARV (median comp)
- $174,468
- List price
- $134,000
- Delta
- -23.20%
- Verdict
- UNDERPRICED
- Comps
- 20 within 1.0 mi
Show comp detail 12 sales within ~0.75 mi
| Address | Dist | Beds/Ba | Sqft | Sold | Price | $/sf | Match |
|---|---|---|---|---|---|---|---|
| 424 Morris St | 0.27mi | 2/1.0 | 1,282 (-0%) | 11mo | $103,500 | $81 | 78 |
| 308 Macedonia Rd | 0.37mi | 3/2.0 (+1) | 1,299 (+1%) | 3mo | $262,000 | $202 | 69 |
| 309 Mcgoodwin Ave | 0.33mi | 3/1.0 (+1) | 1,192 (-7%) | 10mo | $113,000 | $95 | 59 |
| 401 N High St | 0.66mi | 3/1.0 (+1) | 1,248 (-3%) | 0mo | $188,500 | $151 | 59 |
| 400 Macedonia Rd | 0.41mi | 3/2.0 (+1) | 1,316 (+2%) | 11mo | $229,000 | $174 | 58 |
| 612 Merle Ave | 0.70mi | 3/2.0 (+1) | 1,296 (+1%) | 7mo | $247,325 | $191 | 51 |
| 618 Merle Ave | 0.74mi | 3/2.0 (+1) | 1,296 (+1%) | 7mo | $262,560 | $203 | 49 |
| 401 W Washington St | 0.74mi | 2/2.0 | 1,318 (+2%) | 11mo | $222,000 | $168 | 49 |
| 402 Macedonia Rd | 0.43mi | 3/2.0 (+1) | 1,187 (-8%) | 11mo | $215,000 | $181 | 48 |
| 500 Willow Ln | 0.46mi | 3/2.0 (+1) | 1,142 (-11%) | 3mo | $155,000 | $136 | 48 |
| 612 Village Dr | 0.61mi | 3/1.5 (+1) | 1,431 (+11%) | 3mo | $233,000 | $163 | 44 |
| 612 Lemon St | 0.60mi | 2/2.0 | 1,108 (-14%) | 11mo | $215,000 | $194 | 36 |
Match score weights: distance 35% · size 25% · config 20% · recency 20%. Top-matched comps best support the ARV.
Projected returns pro-forma
-3.0% appreciation · 3.0% rent growth · sell at horizon
- IRR
- -3.9%
- Equity multiple
- 0.85×
- Total profit
- $-5,500
- Equity at exit
- $19,980
- IRR
- 5.7%
- Equity multiple
- 1.42×
- Total profit
- $15,915
- Equity at exit
- $11,586
Cash invested: $37,520 (down + closing). Projections, not guarantees.
Landlord ↔ Tenant lean methodology
- Overall (STATE)
- 83 Strongly Landlord-Friendly
- State Kentucky
- 83 Strongly Landlord-Friendly · R+16
- County
- — inherits STATE
- City
- — inherits STATE
ZIP-level market 42134
- Home prices YoY
- -27.7%
- Active inventory
- 255
- Price-to-rent
- 8.4×
Monthly cashflow live
- Estimated rent
- $1,325 high interval (Pro) →
- Mortgage (P&I)
- −$703
- Tax from tax record
- −$33 /mo · $395/yr
- Insurance
- −$56
- HOA
- −$0
- Vacancy / Maint / Mgmt
- −$278
- Net cashflow
- $256
Break-even live
Sensitivity live
| Price | -10% $331 | -5% $293 | +0% $256 | +5% $218 | +10% $180 |
|---|---|---|---|---|---|
| Rent | -10% $151 | -5% $203 | +0% $256 | +5% $308 | +10% $360 |
| Rate | -1.0pp $323 | -0.5pp $290 | base $256 | +0.5pp $221 | +1.0pp $186 |
UW: 25.0% down · 7.5% · 30yr · 1.5% tax · 5.0% vac · 8.0% maint · 8.0% mgmt
Financing live
Cash to close
- Down payment
- $33,500
- Closing costs
- $4,020
- Reserves months
- —
- Total cash needed
- —
Loan-product check · same deal, 3 products live
Conventional
25% down · 7.5% · 30yr
- Down + closing
- —
- Monthly P&I
- —
- Monthly cashflow
- —
- DSCR
- —
- Eligible?
- —
Personal DTI + credit; lowest rate.
DSCR
20% down · 8.5% · 30yr
- Down + closing
- —
- Monthly P&I
- —
- Monthly cashflow
- —
- DSCR
- —
- Eligible?
- —
No personal income docs; deal must DSCR.
Hard money
10% down · 12.0% · 12mo
- Down + closing
- —
- Monthly P&I
- —
- Monthly cashflow
- —
- DSCR
- —
- Eligible?
- —
Short-term bridge; refi at stabilization.
Rent comps 15 comps
| Address | Beds | Baths | Sqft | Rent | $/sqft | DOM | Units | Dist |
|---|---|---|---|---|---|---|---|---|
| 413 E Madison St Franklin, KY | 2.0 | 1.0 | 1000 | $1,300 | $1.30 | 44d | 1 | 0.09mi |
| 205 Walker St Apt B Franklin, KY | 3.0 | 2.5 | 1150 | $1,750 | $1.52 | 44d | 1 | 0.67mi |
| 813 W Madison St Franklin, KY | 1.0–2.0 | 1.0–2.0 | 788 | $1,195 | $1.52 | 2d | 7 | 1.14mi |
| 834 N Main St Unit 27 Franklin, KY | 2.0 | 1.0 | 980 | $1,000 | $1.02 | 44d | 1 | 1.14mi |
| 834 N Main St Unit 40 Franklin, KY | 3.0 | 2.0 | 1280 | $1,295 | $1.01 | 44d | 1 | 1.16mi |
| 834 N Main St Unit 28 Franklin, KY | 3.0 | 2.0 | 1000 | $1,195 | $1.20 | 44d | 1 | 1.16mi |
| 845 W Madison St Unit 20 Franklin, KY | 2.0 | 1.0 | 900 | $999 | $1.11 | 21d | 1 | 1.27mi |
| 845 W Madison St Unit 2 Franklin, KY | 1.0 | 1.0 | 900 | $850 | $0.94 | 21d | 1 | 1.27mi |
| 845 W Madison St Franklin, KY | 1.0–2.0 | 1.0 | 900 | $999 | $1.11 | 13d | 4 | 1.27mi |
| 801 Blackjack Rd Franklin, KY | 2.0–3.0 | 2.0 | 1171 | $1,200 | $1.02 | 13d | 5 | 1.29mi |
| 801 Blackjack Rd Unit 1101 Franklin, KY | 3.0 | 2.0 | 1245 | $1,425 | $1.14 | 44d | 1 | 1.29mi |
| 801 Blackjack Rd Unit 1203 Franklin, KY | 2.0 | 2.0 | 1097 | $1,200 | $1.09 | 44d | 1 | 1.29mi |
| 1030 Brookview Dr Unit 21C Franklin, KY | 2.0 | 1.0 | 976 | $950 | $0.97 | 44d | 1 | 1.35mi |
| 811 Witt Rd Franklin, KY | 3.0 | 2.0 | 1550 | $2,195 | $1.42 | 21d | 1 | 1.35mi |
| 965 W Madison St Apt C2 Franklin, KY | 2.0 | 2.0 | 1070 | $1,025 | $0.96 | 21d | 1 | 1.49mi |
Listing history 24 events
-
2026-06-19days on market $134,000 Active 156 DOM
-
2026-06-18price $134,000 Active 155 DOM
-
2026-06-18days on market $135,000 Active 155 DOM
-
2026-06-17days on market $135,000 Active 154 DOM
-
2026-06-16days on market $135,000 Active 153 DOM
-
2026-06-15days on market $135,000 Active 152 DOM
-
2026-06-14days on market $135,000 Active 150 DOM
-
2026-06-13days on market $135,000 Active 149 DOM
-
2026-06-10pricedays on market $135,000 Active 147 DOM
-
2026-06-09days on market $137,500 Active 146 DOM
-
2026-06-08days on market $137,500 Active 145 DOM
-
2026-06-07days on market $137,500 Active 144 DOM
-
2026-06-03days on market $137,500 Active 140 DOM
-
2026-06-02days on market $137,500 Active 139 DOM
-
2026-06-01days on market $137,500 Active 138 DOM
-
2026-05-31days on market $137,500 Active 137 DOM
-
2026-05-30days on market $137,500 Active 136 DOM
-
2026-04-03price $144,900 426-char remark
Show marketing remark (426 chars)
This charming home is rich with character and timeless appeal. Imagine the stories these walls hold. 1875 circa according to tax records. Offering 2 bedrooms and 1 bath and sits on a large level lot with space to enjoy outdoor living, gardening, etc. The detached building provides additional storage or flexible use. Recent updates include newer windows and a newer water heater. A rare opportunity to own a piece of history.
-
2026-02-12price $149,900 426-char remark
Show marketing remark (426 chars)
This charming home is rich with character and timeless appeal. Imagine the stories these walls hold. 1875 circa according to tax records. Offering 2 bedrooms and 1 bath and sits on a large level lot with space to enjoy outdoor living, gardening, etc. The detached building provides additional storage or flexible use. Recent updates include newer windows and a newer water heater. A rare opportunity to own a piece of history.
-
2026-02-10historical
-
2026-01-19$155,000 Active
-
2026-01-14$155,000 Active 426-char remark
Show marketing remark (426 chars)
This charming home is rich with character and timeless appeal. Imagine the stories these walls hold. 1875 circa according to tax records. Offering 2 bedrooms and 1 bath and sits on a large level lot with space to enjoy outdoor living, gardening, etc. The detached building provides additional storage or flexible use. Recent updates include newer windows and a newer water heater. A rare opportunity to own a piece of history.
-
2026-01-13historical $155,000 426-char remark
Show marketing remark (426 chars)
This charming home is rich with character and timeless appeal. Imagine the stories these walls hold. 1875 circa according to tax records. Offering 2 bedrooms and 1 bath and sits on a large level lot with space to enjoy outdoor living, gardening, etc. The detached building provides additional storage or flexible use. Recent updates include newer windows and a newer water heater. A rare opportunity to own a piece of history.
-
2016-07-05soldstatus $28,500
ⓘ Source: listings_history table (triggers on properties + properties_extension) + one-shot
backfill from property_details.listing_events for pre-trigger history.
Tax reassessment forecast KY · Resets to sale price
- Current annual tax
- $395 · $33/mo
- Projected year-2 tax
- $1,152 · $96/mo
- Expected delta
- +$758/yr (+$63/mo · 191.8%)
ⓘ Screening estimate from a state-policy table — verify with the county assessor before closing.
Climate risk First Street
- Flood 1/10 Low FEMA zone X (unshaded) · 0% chance over 30 yrs
- Wildfire 1/10 Low
- Heat 5/10 Major 7 d/yr ≥106°F today · 20 d/yr by 30 yrs out
- Wind 3/10 Moderate 8% chance of damaging wind over 30 yrs
- Air quality 2/10 Low 0 unhealthy d/yr today · 1 by 30 yrs out
Nearby sold comps map
Loading sold comps map…
Walkable amenities ~0.75 mi
Loading nearby amenities…
Taxation est. · year 1
- Rental income
- $15,904
- − Mortgage interest
- −$7,506
- − Property taxes
- −$395
- − Insurance
- −$670
- − Repairs & maintenance
- −$1,272
- − Management
- −$1,272
- − Depreciation
- −$3,898
- Taxable income
- $890
- Est. tax owed @ 24.0%
- −$214
- After-tax cash flow
- $2,853/yr
For passive investors: Depreciation is non-cash, so a rental often shows a tax loss while cash-flowing — sheltering income. Rental losses are passive: they offset passive income freely, and up to $25,000/yr can offset ordinary (W-2) income if you actively participate and your MAGI is under $100k (phasing out to $0 by $150k); unused losses carry forward. On sale, claimed depreciation is recaptured at up to 25%, and gains may owe capital-gains tax (a 1031 exchange can defer both). Figures are a year-1 estimate at your 24.0% rate — not tax advice; consult a CPA.
Schools (NCES district)
- District
- Simpson County
- NCES district ID
- 2105400
- Math proficiency
- 29% ▼ -18.00%
- Reading proficiency
- 39% ▼ -16.00%
- Median HH income
- $41,691
- Composite
- 28.69/100
- National rank
- #6692
- State rank
- #72 of 165 in KY
Livability — Franklin
- Score
- 65/100
- State rank
- #266
- US rank
- #13010
Category grades
Schools grade is shown separately in the Schools card above.
Census & demographics
- Census place
- Franklin, KY
- County
- Simpson County · 19,380 people
- City population
- 19,380
- Metro
- nan
- Population (ZIP)
- 19,380
- Household income
- $59,113
- Rent vs Own
- Severe rent burden
- 576.0
Population outlook (Simpson County) Hauer SSP2
- Today (2025)
- 19,331 people
- By 2030
- 19,921 · +3.1%
- By 2040
- 20,975 · +8.5%
- By 2050
- 21,736 · +12.4%
- By 2075
- 23,536 · +21.8%
- By 2100
- 23,054 · +19.3%
Race, ethnicity, and origin ACS 2023
- Neighborhood character
- Predominantly White (85%)
- Race & ethnicity
- White 85% Black 7% Two or more races 6% Hispanic / Latino 3%
- Common ancestry
- Slovak 4% Italian 1% Lithuanian 1%
- Foreign-born
- 1% · Canada
- Languages at home
- 98% English-only · Spanish 1%
Political lean MEDSL · Simpson
- 2024 margin
- Solid R (+43.9) · D 27.4% · R 71.2% · Other 1.4%
- 2008→2024 swing
- -21.1pp toward R · 2008: -22.7pp · 2024: -43.9pp
- All cycles
- 2024: R+43.9 2020: R+36.7 2016: R+39.0 2012: R+24.1 2008: R+22.7
Not yet ingested
- Civics
- —
Market trends
- HPI YoY
- ▼ -84.92%
- Current HPI
- 221.6725
- Rent YoY
- —
- Metro
- nan
- State GDP YoY
- ▲ 1.81%
- F500 in state
- 4
Industry mix (Fortune 500 HQ in KY)
| Industry | F500 HQs | Revenue |
|---|---|---|
| Healthcare | 1 | $118B |
|
||
| Food / Beverage | 1 | $7B |
|
||
Price history
+408.4% since first listed7 events — show timeline
- 2026-04-03 Price Changed $144,900 RASKMLS
- 2026-02-12 Price Changed $149,900 RASKMLS
- 2026-02-10 Listing Removed — REALTRACS as Distributed by MLS Grid
- 2026-01-19 Listed $155,000 REALTRACS as Distributed by MLS Grid
- 2026-01-14 Listed $155,000 RASKMLS
- 2026-01-13 Coming Soon $155,000 RASKMLS
- 2016-07-05 Sold (Public Records) $28,500 Public Records
Property tax history
+16.2%/yrLatest (2025): $395 · -0.8% YoY. Source: county tax records.
Cash-flow waterfall
monthlySold comps — $/sqft
last 12 mo · ≤1 miLoading sold comps…