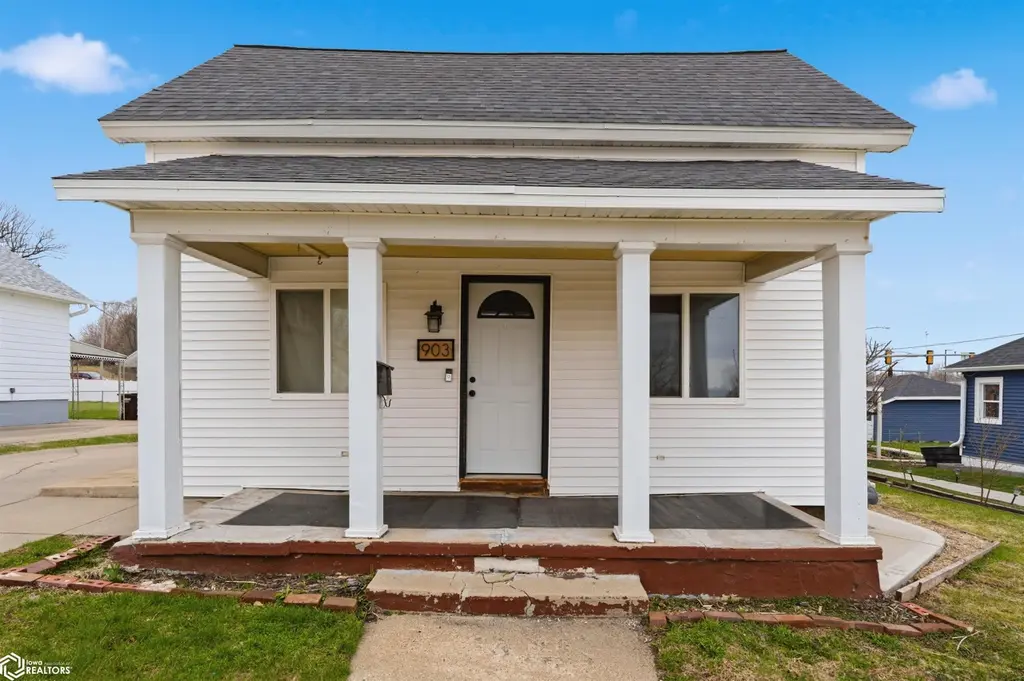
903 S 2nd Ave · Marshalltown, IA
Flood risk 1/10 · Minimal
- FEMA flood zone
- X (unshaded)
- Chance of flooding over 30 yrs
- 0.0%
- Est. flood insurance / yr
- $473 – $860
Fire risk 2/10 · Minimal
- Est. fire insurance / yr
- $902 – $1,676
Heat risk 3/10 · Minor
- Hot days now (above 102°F)
- 7 days/yr
- Hot days in 30 yrs
- 15 days/yr
Wind risk 2/10 · Minimal
- Chance of severe wind over 30 yrs
- —
Air-quality risk 1/10 · Minimal
- Unhealthy air days now
- 0 days/yr
- Unhealthy air days in 30 yrs
- 0 days/yr
Risk factors via First Street. Map © Google.
Why this score? — see what drove the B+ grade
The composite is a weighted blend of 9 inputs, each scored 0–100. Each bar is that input's sub-score; the figure is the points it added to the 100-point composite (weight × sub-score).
- Cash flow +30.0/30.0
- ARV discount +15.0/15.0
- DSCR +10.0/10.0
- 1% rule +9.4/10.0
- Schools +4.3/10.0
- Livability +3.9/5.0
- Rent growth +2.5/5.0
- Condition / age +2.5/5.0
- Appreciation +0.0/10.0
$104,000
🖨 Deal sheet 📄 Offer letter ✓ Due diligence
Listing remarks MLS
Affordable 3-4 bedroom home located in southside location close to shopping. Newer furnace, water heater and central air. All new flooring and paint on interior. Nice fenced in back yard. Eat in kitchen. 2 bedrooms do not have a closet. Won't last! Call today!
Key facts
- 7,405 sq ft lot
- Garage
- Built 1883
Neighborhood map
What this means for you Summary
Snapshot
- This is a 4-bed/1.0-bath single-family listed at $104k.
Deal economics
- At list price, monthly cash flow is $446 ($5k/yr) — positive.
- The deal already cash-flows at list — no discount required.
- Meets the 1% rule at list price ($1k rent vs $104k).
- Cap rate 11.4% vs local median 4.5% in Marshalltown — top-decile yield for the area; either an underpriced asset or a hidden risk that comps aren't pricing in. Stress-test before assuming the spread holds.
Location & tenants
- Location reads 78/100 on livability (#133 in IA, #2,464 nationally) — a middle-class / working-renter tenant base. Strengths: commute A+, cost of living A+, housing A+; Watch: employment C-, amenities F.
- Marshalltown Community School District (town): math 50% / reading 52% proficiency, ranked #278 of 289 in IA (top 96%) — acceptable for families but not a draw, mixed tenant base, ~2y average lease; 60% free/reduced lunch — lower-income household profile, screen leases tightly.
- Market conditions: 161 active listings in the ZIP; 2 comparable units currently listed for rent nearby; 35 units permitted in Marshall County in 2024 (0 in 5+ unit buildings).
Forward outlook
- Local home prices are declining (-3.0%/yr); year-one equity from $719 of loan paydown is wiped out by about $3k of value loss. Plan a longer hold.
- Marshall County population projected at +8% by 2050 — modest demand growth; plan on rents tracking national, not racing it.
- At projected returns (-3.0% appreciation + 3.0% rent growth), your $29k cash investment doubles in ~7 years — after that, you're playing with house money.
Negotiation context
- Only 4 days on market — expect competitive offers; lowballing is unlikely to land.
- 3 sale attempts since 8y ago with the ask held roughly flat each time — persistent listings suggest the price (not the market) is what's stuck; bring a comps-based counter.
- Current owner paid $65k; list at $104k implies a 60% gain — meaningful room to come down on a strong offer.
Risks & watch-outs
- Watch-outs: built in 1883 — expect roof / HVAC / electrical / plumbing capex.
Questions for the listing agent
- Built in 1883 — when were the roof, HVAC, electrical panel, plumbing, and water heater last replaced?
- Is there a deadline driving the sale (1031 exchange, divorce, estate, relocation)? That informs how much negotiation room exists.
- What's the average days-on-market for RENTAL listings here right now (not sales)? A rising rental-DOM trend means longer vacancies and softer asking-rent achievability than the comps imply.
- What's the recent tenant-quality profile in this submarket — average credit score on applications, eviction rate, late-payment / NSF rate, and stable-employment percentage? A property-management company in the area should have these aggregated.
- How much new for-sale + rental construction is in the pipeline within 1–3 miles? Heavy new supply typically softens prices + rents 12–24 months out; constrained supply supports both.
Investment metrics
- 1% rule
- 1.44% ✓
- Cap rate
- 11.44%
- Cash-on-cash
- 18.40%
- DSCR
- 1.82
- GRM
- 5.8
CMA / ARV
- ARV (on-the-fly)
- $173,900
- Comps found
- 12
Show comp detail 12 sales within ~0.75 mi
| Address | Dist | Beds/Ba | Sqft | Sold | Price | $/sf | Match |
|---|---|---|---|---|---|---|---|
| 903 S 2nd Ave | 0.00mi | 4/1.0 | 1,175 (0%) | 1mo | $96,500 | $82 | 99 |
| 805 S 5th Ave | 0.29mi | 4/2.0 | 1,200 (+2%) | 9mo | $100,000 | $83 | 71 |
| 208 Young St | 0.06mi | 3/1.0 (-1) | 1,056 (-10%) | 10mo | $134,900 | $128 | 67 |
| 214 E High St | 0.12mi | 3/1.0 (-1) | 1,008 (-14%) | 4mo | $134,900 | $134 | 62 |
| 806 Henry Dr | 0.69mi | 4/2.0 | 1,188 (+1%) | 2mo | $214,500 | $181 | 60 |
| 1025 S 8th Ave | 0.57mi | 3/2.0 (-1) | 1,184 (+1%) | 8mo | $169,900 | $143 | 56 |
| 207 S 4th St | 0.73mi | 3/1.0 (-1) | 1,212 (+3%) | 4mo | $130,000 | $107 | 52 |
| 209 W Ingledue St | 0.49mi | 3/2.0 (-1) | 1,272 (+8%) | 7mo | $219,000 | $172 | 48 |
| 213 Pine St | 0.37mi | 3/2.0 (-1) | 1,338 (+14%) | 6mo | $229,900 | $172 | 45 |
| 408 S 3rd St | 0.54mi | 5/2.0 (+1) | 1,052 (-10%) | 8mo | $177,000 | $168 | 42 |
| 1108 Steves Ct | 0.57mi | 3/2.0 (-1) | 1,056 (-10%) | 8mo | $174,900 | $166 | 40 |
| 1203 S 4th St | 0.58mi | 3/2.0 (-1) | 1,048 (-11%) | 10mo | $155,000 | $148 | 38 |
Match score weights: distance 35% · size 25% · config 20% · recency 20%. Top-matched comps best support the ARV.
Projected returns pro-forma
-3.0% appreciation · 3.0% rent growth · sell at horizon
- IRR
- 10.1%
- Equity multiple
- 1.40×
- Total profit
- $11,618
- Equity at exit
- $15,507
- IRR
- 19.2%
- Equity multiple
- 2.61×
- Total profit
- $46,868
- Equity at exit
- $8,992
Cash invested: $29,120 (down + closing). Projections, not guarantees.
Landlord ↔ Tenant lean methodology
- Overall (STATE)
- 83 Strongly Landlord-Friendly
- State Iowa
- 83 Strongly Landlord-Friendly · R+6
- County
- — inherits STATE
- City
- — inherits STATE
ZIP-level market 50158
- Active inventory
- 161
- Price-to-rent
- 5.8×
Monthly cashflow live
- Estimated rent
- $1,496 medium interval (Pro) →
- Mortgage (P&I)
- −$545
- Tax from tax record
- −$147 /mo · $1,762/yr
- Insurance
- −$43
- HOA
- −$0
- Vacancy / Maint / Mgmt
- −$314
- Net cashflow
- $446
Break-even live
UW: 25.0% down · 7.5% · 30yr · 1.5% tax · 5.0% vac · 8.0% maint · 8.0% mgmt
Financing live
Cash to close
- Down payment
- $26,000
- Closing costs
- $3,120
- Reserves months
- —
- Total cash needed
- —
Loan-product check · same deal, 3 products live
Conventional
25% down · 7.5% · 30yr
- Down + closing
- —
- Monthly P&I
- —
- Monthly cashflow
- —
- DSCR
- —
- Eligible?
- —
Personal DTI + credit; lowest rate.
DSCR
20% down · 8.5% · 30yr
- Down + closing
- —
- Monthly P&I
- —
- Monthly cashflow
- —
- DSCR
- —
- Eligible?
- —
No personal income docs; deal must DSCR.
Hard money
10% down · 12.0% · 12mo
- Down + closing
- —
- Monthly P&I
- —
- Monthly cashflow
- —
- DSCR
- —
- Eligible?
- —
Short-term bridge; refi at stabilization.
Rent comps 2 comps
| Address | Beds | Baths | Sqft | Rent | $/sqft | DOM | Units | Dist |
|---|---|---|---|---|---|---|---|---|
| 1010 Washington St Marshalltown, IA | 3.0 | 1.0–2.0 | 1098 | $1,262 | $1.15 | 43d | 3 | 0.97mi |
| 901 E Olive St Marshalltown, IA | 2.0–3.0 | 1.5 | 1200 | $1,550 | $1.29 | 43d | 4 | 1.00mi |
Listing history 8 events
-
2026-04-11status Pending
-
2026-04-07$104,000 Active
-
2021-08-30soldstatus $65,000
-
2021-08-25soldstatus $64,900 260-char remark
Show marketing remark (260 chars)
Affordable 3-4 bedroom home located in southside location close to shopping. Newer furnace, water heater and central air. All new flooring and paint on interior. Nice fenced in back yard. Eat in kitchen. 2 bedrooms do not have a closet. Won't last! Call today!
-
2021-05-12$64,900 260-char remark
Show marketing remark (260 chars)
Affordable 3-4 bedroom home located in southside location close to shopping. Newer furnace, water heater and central air. All new flooring and paint on interior. Nice fenced in back yard. Eat in kitchen. 2 bedrooms do not have a closet. Won't last! Call today!
-
2019-02-28soldstatus $30,000 251-char remark
Show marketing remark (251 chars)
Southside 3-4 bedroom family home close to schools and shopping. Open floor plan. Eat in kitchen. Open front porch. Large living room. Great affordable family home! Case# 161-299300 HUD homes sold as is. www. chronossolutions.com www. hudhomestore.com
-
2018-09-29$32,200 251-char remark
Show marketing remark (251 chars)
Southside 3-4 bedroom family home close to schools and shopping. Open floor plan. Eat in kitchen. Open front porch. Large living room. Great affordable family home! Case# 161-299300 HUD homes sold as is. www. chronossolutions.com www. hudhomestore.com
-
2007-08-17soldstatus $54,000
ⓘ Source: listings_history table (triggers on properties + properties_extension) + one-shot
backfill from property_details.listing_events for pre-trigger history.
Tax reassessment forecast IA · Partial reset (capped growth)
- Current annual tax
- $1,762 · $147/mo
- Projected year-2 tax
- $1,762 · $147/mo
- Expected delta
- $0/yr ($0/mo · 0.0%)
ⓘ Screening estimate from a state-policy table — verify with the county assessor before closing.
Climate risk First Street
- Flood 1/10 Low FEMA zone X (unshaded) · 0% chance over 30 yrs
- Wildfire 2/10 Low
- Heat 3/10 Moderate 7 d/yr ≥102°F today · 15 d/yr by 30 yrs out
- Wind 2/10 Low
- Air quality 1/10 Low 0 unhealthy d/yr today · 0 by 30 yrs out
Nearby sold comps map
Loading sold comps map…
Walkable amenities ~0.75 mi
Loading nearby amenities…
Taxation est. · year 1
- Rental income
- $17,955
- − Mortgage interest
- −$5,826
- − Property taxes
- −$1,762
- − Insurance
- −$520
- − Repairs & maintenance
- −$1,436
- − Management
- −$1,436
- − Depreciation
- −$3,025
- Taxable income
- $3,949
- Est. tax owed @ 24.0%
- −$948
- After-tax cash flow
- $4,410/yr
For passive investors: Depreciation is non-cash, so a rental often shows a tax loss while cash-flowing — sheltering income. Rental losses are passive: they offset passive income freely, and up to $25,000/yr can offset ordinary (W-2) income if you actively participate and your MAGI is under $100k (phasing out to $0 by $150k); unused losses carry forward. On sale, claimed depreciation is recaptured at up to 25%, and gains may owe capital-gains tax (a 1031 exchange can defer both). Figures are a year-1 estimate at your 24.0% rate — not tax advice; consult a CPA.
Schools (NCES district)
- District
- Marshalltown Community School District
- NCES district ID
- 1918720
- Math proficiency
- 50% ▼ -8.00%
- Reading proficiency
- 52% ▬ 0.00%
- Median HH income
- $47,877
- Composite
- 43.41/100
- National rank
- #3015
- State rank
- #278 of 289 in IA
Livability — Marshalltown
- Score
- 78/100
- State rank
- #133
- US rank
- #2464
Category grades
Schools grade is shown separately in the Schools card above.
Census & demographics
- Census place
- Marshalltown, IA
- County
- Marshall County · 31,396 people
- City population
- 31,396
- Metro
- Marshalltown, IA
- Population (ZIP)
- 31,396
- Household income
- $70,367
- Rent vs Own
- Severe rent burden
- 369.0
Population outlook (Marshall County) Hauer SSP2
- Today (2025)
- 41,166 people
- By 2030
- 41,477 · +0.8%
- By 2040
- 42,548 · +3.4%
- By 2050
- 44,472 · +8.0%
- By 2075
- 52,719 · +28.1%
- By 2100
- 60,912 · +48.0%
Race, ethnicity, and origin ACS 2023
- Neighborhood character
- Majority White (60%)
- Race & ethnicity
- White 60% Hispanic / Latino 30% Two or more races 14% Asian 5% Black 2% Native American 1%
- Hispanic origin (detail)
- Mexican 25%
- Common ancestry
- Portuguese 3% Italian 2% Iranian 1%
- Foreign-born
- 17% · Canada, Philippines, China
- Languages at home
- 71% English-only · Spanish 24% Other Asian/Pacific 4% French/Haitian/Cajun 1%
Political lean MEDSL · Marshall
- 2024 margin
- R (+15.6) · D 41.4% · R 57.0% · Other 1.6%
- 2008→2024 swing
- -24.9pp toward R · 2008: 9.3pp · 2024: -15.6pp
- All cycles
- 2024: R+15.6 2020: R+7.7 2016: R+8.5 2012: D+8.9 2008: D+9.3
Not yet ingested
- Civics
- —
Market trends
- HPI YoY
- ▼ -161.80%
- Current HPI
- 177.4692
- Rent YoY
- —
- Metro
- Marshalltown, IA
- State GDP YoY
- ▲ 2.48%
- F500 in state
- 4
Industry mix (Fortune 500 HQ in IA)
| Industry | F500 HQs | Revenue |
|---|---|---|
| Financial Services | 1 | $16B |
|
||
| Retail / Convenience | 1 | $15B |
|
||
Price history
+92.6% since first listed8 events — show timeline
- 2026-04-11 Pending — IAR
- 2026-04-07 Listed $104,000 IAR
- 2021-08-30 Sold (Public Records) $65,000 Public Records
- 2021-08-25 Sold (MLS) $64,900 IAR
- 2021-05-12 Listed $64,900 IAR
- 2019-02-28 Sold (MLS) $30,000 IAR
- 2018-09-29 Listed $32,200 IAR
- 2007-08-17 Sold (Public Records) $54,000 Public Records
Property tax history
+7.1%/yrLatest (2025): $1,762 · +5.9% YoY. Source: county tax records.
Cash-flow waterfall
monthlySold comps — $/sqft
last 12 mo · ≤1 miLoading sold comps…