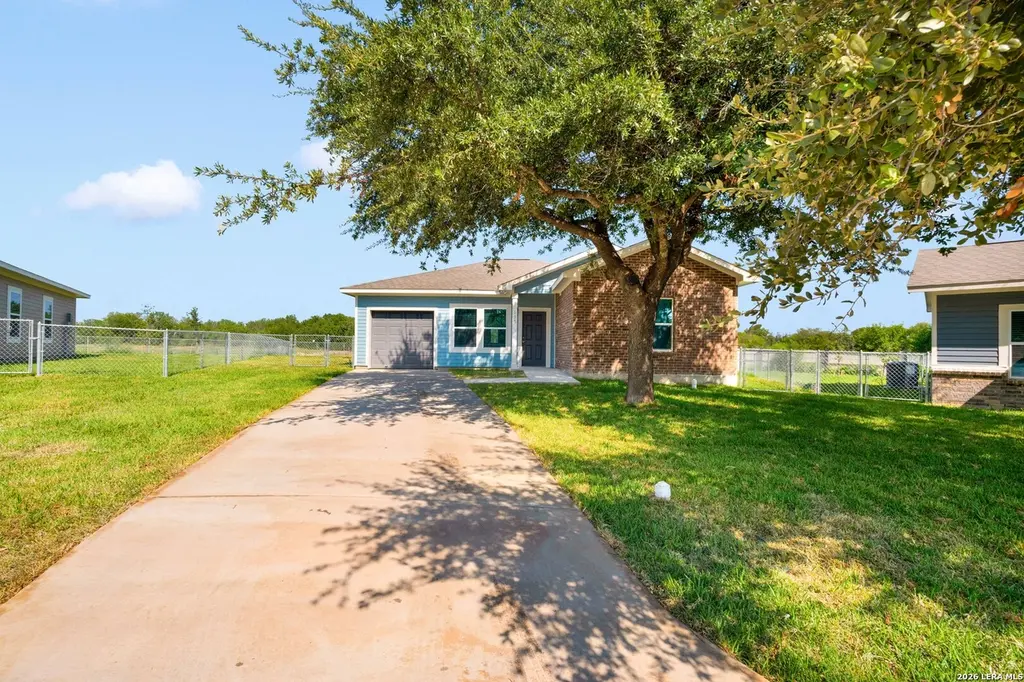
606 Villa Linda · San Antonio, TX
Flood risk 1/10 · Minimal
- FEMA flood zone
- X (unshaded)
- Chance of flooding over 30 yrs
- 0.0%
- Est. flood insurance / yr
- $507 – $1,088
Fire risk 1/10 · Minimal
- Est. fire insurance / yr
- $1,222 – $2,270
Heat risk 8/10 · Major
- Hot days now (above 108°F)
- 6 days/yr
- Hot days in 30 yrs
- 19 days/yr
Wind risk 8/10 · Major
- Chance of severe wind over 30 yrs
- 80.0%
Air-quality risk 2/10 · Minimal
- Unhealthy air days now
- 1 days/yr
- Unhealthy air days in 30 yrs
- 1 days/yr
Risk factors via First Street. Map © Google.
Why this score? — see what drove the C- grade
The composite is a weighted blend of 9 inputs, each scored 0–100. Each bar is that input's sub-score; the figure is the points it added to the 100-point composite (weight × sub-score).
- Cash flow +13.8/30.0
- Appreciation +10.0/10.0
- ARV discount +7.5/15.0
- DSCR +4.2/10.0
- Rent growth +4.0/5.0
- Livability +4.0/5.0
- 1% rule +2.9/10.0
- Condition / age +2.5/5.0
- Schools +1.3/10.0
$185,000
🖨 Deal sheet 📄 Offer letter ✓ Due diligence
Listing remarks
Charming single-story home located on a quiet street, a great opportunity for homebuyers. This property features a functional layout with spacious living areas, ample natural light, and a generously sized lot. Conveniently located near major highways, shopping, dining, and schools. Ideal opportunity to add your personal touch and make it your own. Don't miss out on this value-packed home!
Key facts
- 0.23 acre lot
- Garage
- Built 2026
Property features AI
Finance
- HOA & community: Located in LOMA AREA 2 ED subdivision
Exterior
- Parking: Attached parking
- Utilities: Water service by SAWS; Sewer provided by city; Electricity by CPS; City garbage service; Connected to water and sewer systems
- Home design: New construction by Brizo
- Construction: Slab foundation; Composition roof
- Exterior features: Brick and cement fiber exterior; Cul-de-sac/Dead-end lot; Level lot; Paved streets with curbs and streetlights
Interior
- Kitchen: Eat-in kitchen (8 x 14)
- Bedrooms: Primary bedroom with walk-in closet and full bath (14 x 15); Bedroom 2 (10 x 10); Bedroom 3 (13 x 10)
- Flooring: Ceramic tile; Linoleum
- Bathrooms: Two full bathrooms and one half bath; Primary bathroom with tub/shower combination (6 x 9)
- Heating & cooling: Central heating (electric); Central air conditioning
- Interior features: Ceiling fans; Eat-in kitchen; All window coverings remain; Washer and dryer connections
- Laundry & utility: Washer connection; Dryer connection
Neighborhood map
What this means for you Summary
Snapshot
- This is a 3-bed/2.5-bath single-family listed at $185k.
Deal economics
- At list price, monthly cash flow is $16 ($190/yr) — positive.
- The deal already cash-flows at list — no discount required.
- To meet the 1% rule (rent ≥ 1% of price), the offer needs to be $146k (20.9% below list).
- Recommended offer: $146k (20.9% below list) — sets the bar for 1% rule.
- Cap rate 6.4% vs local median 3.8% in San Antonio — top-decile yield for the area; either an underpriced asset or a hidden risk that comps aren't pricing in. Stress-test before assuming the spread holds.
Location & tenants
- Location reads 80/100 on livability (#31 in TX, #1,616 nationally) — a professional / high-income tenant draw. Strengths: amenities A+, commute A+, cost of living A+; Watch: crime F.
- Edgewood ISD (urban): math 12% / reading 21% proficiency, ranked #812 of 826 in TX (top 98%) — low school quality limits family demand, transient renter base, plan for 1-2y turnover.
- Zoned schools: Loma Park El (math 11% / reading 22%, grade F, #3,946 of 4,322 statewide, top 92%, 586 students, 98% FRL); Memorial H S (math 22% / reading 29%, grade F, #1,246 of 1,632 statewide, top 77%, 872 students, 92% FRL) — zoned schools average 95% FRL vs 24% district-wide (70 pts higher); higher-poverty schools than district average — tighter screening recommended.
- Market conditions: Rents rising fast (+6.1%/yr); 127 active listings in the ZIP; 14 comparable units currently listed for rent nearby; rentals at typical pace (median 24d on market — plan ~3-4 weeks tenant-placement turnaround); lower-income renter base — watch delinquency; 8,308 units permitted in Bexar County in 2024 (2,506 in 5+ unit buildings).
- This rent runs 41% of the median local income ($43k/yr) — at the standard rent-burdened threshold; future hikes will face affordability resistance.
Forward outlook
- In year one you build about $20k of equity ($1k loan paydown + $18k appreciation (10.0% local appreciation)).
- Bexar County population projected at +50% by 2050 — long-run rental-demand tailwind backs the buy-and-hold thesis.
- At projected returns (10.0% appreciation + 6.1% rent growth), your $52k cash investment doubles in ~3 years — after that, you're playing with house money.
- By year 2, paydown + projected appreciation supports a ~$32k cash-out refi (75% LTV) — recoverable capital for the next deal without selling this one.
Negotiation context
- It's been on market 27 days — a 2% lower offer ($182k) is reasonable based on typical stale-listing flexibility.
- 2 sale attempts since 18y ago with the ask held roughly flat each time — persistent listings suggest the price (not the market) is what's stuck; bring a comps-based counter.
Risks & watch-outs
- Climate carrying-cost: severe wind risk, 80% chance of damaging wind over 30y; extreme-heat days projected 6→19/yr by 2055 (HVAC capex compounding) — expect insurance premiums to compound above CPI over the hold.
Questions for the listing agent
- Is there a deadline driving the sale (1031 exchange, divorce, estate, relocation)? That informs how much negotiation room exists.
- Crime grade is F in this area — have there been break-ins, vandalism, or insurance claims at this property in the last 3 years? What carrier currently insures it and at what premium?
- What's the average days-on-market for RENTAL listings here right now (not sales)? A rising rental-DOM trend means longer vacancies and softer asking-rent achievability than the comps imply.
- What's the recent tenant-quality profile in this submarket — average credit score on applications, eviction rate, late-payment / NSF rate, and stable-employment percentage? A property-management company in the area should have these aggregated.
- How much new for-sale + rental construction is in the pipeline within 1–3 miles? Heavy new supply typically softens prices + rents 12–24 months out; constrained supply supports both.
Investment metrics
- 1% rule
- 0.79% ✗
- Cap rate
- 6.40%
- Cash-on-cash
- 0.37%
- DSCR
- 1.02
- GRM
- 10.5
CMA / ARV
No comps found within radius.
Projected returns pro-forma
10.0% appreciation · 6.13% rent growth · sell at horizon
- IRR
- 25.5%
- Equity multiple
- 3.06×
- Total profit
- $106,458
- Equity at exit
- $166,663
- IRR
- 23.2%
- Equity multiple
- 7.25×
- Total profit
- $323,533
- Equity at exit
- $359,414
Cash invested: $51,800 (down + closing). Projections, not guarantees.
Landlord ↔ Tenant lean methodology
- Overall (STATE)
- 87 Strongly Landlord-Friendly
- State Texas
- 87 Strongly Landlord-Friendly · R+5
- County
- — inherits STATE
- City
- — inherits STATE
ZIP-level market 78237
- Home prices YoY
- 14.1%
- Rents YoY
- 6.1%
- Active inventory
- 127
- Price-to-rent
- 10.5×
Monthly cashflow live
- Estimated rent
- $1,464 high interval (Pro) →
- Mortgage (P&I)
- −$970
- Tax from tax record
- −$94 /mo · $1,124/yr
- Insurance
- −$77
- HOA
- −$0
- Vacancy / Maint / Mgmt
- −$307
- Net cashflow
- $16
Break-even live
UW: 25.0% down · 7.5% · 30yr · 1.5% tax · 5.0% vac · 8.0% maint · 8.0% mgmt
Financing live
Cash to close
- Down payment
- $46,250
- Closing costs
- $5,550
- Reserves months
- —
- Total cash needed
- —
Loan-product check · same deal, 3 products live
Conventional
25% down · 7.5% · 30yr
- Down + closing
- —
- Monthly P&I
- —
- Monthly cashflow
- —
- DSCR
- —
- Eligible?
- —
Personal DTI + credit; lowest rate.
DSCR
20% down · 8.5% · 30yr
- Down + closing
- —
- Monthly P&I
- —
- Monthly cashflow
- —
- DSCR
- —
- Eligible?
- —
No personal income docs; deal must DSCR.
Hard money
10% down · 12.0% · 12mo
- Down + closing
- —
- Monthly P&I
- —
- Monthly cashflow
- —
- DSCR
- —
- Eligible?
- —
Short-term bridge; refi at stabilization.
Rent comps 14 comps
| Address | Beds | Baths | Sqft | Rent | $/sqft | DOM | Units | Dist |
|---|---|---|---|---|---|---|---|---|
| 4535 Lark San Antonio, TX | 4.0 | 2.0 | 1514 | $1,750 | $1.16 | 24d | 1 | 1.05mi |
| 707 Tulane Dr San Antonio, TX | 2.0 | 1.5 | 1500 | $1,550 | $1.03 | 43d | 1 | 1.16mi |
| 127 Riverdale Dr San Antonio, TX | 3.0 | 1.0 | 1032 | $1,100 | $1.07 | 12d | 1 | 1.22mi |
| 314 Globe Ave San Antonio, TX | 3.0 | 2.0 | 936 | $1,600 | $1.71 | 2d | 1 | 1.24mi |
| 2313 Texas Ave San Antonio, TX | 3.0 | 1.0 | 1309 | $1,400 | $1.07 | 44d | 1 | 1.25mi |
| 4767 Lark San Antonio, TX | 3.0 | 1.0 | 1248 | $1,475 | $1.18 | 11d | 1 | 1.29mi |
| 306 Overhill Dr San Antonio, TX | 2.0 | 1.0 | 1009 | $1,200 | $1.19 | 4d | 1 | 1.31mi |
| 351 Overhill Dr Unit MH San Antonio, TX | 3.0 | 1.0 | 1647 | $1,550 | $0.94 | 24d | 1 | 1.32mi |
| 224 Marquette Dr San Antonio, TX | 2.0 | 1.0 | 984 | $1,350 | $1.37 | 24d | 1 | 1.38mi |
| 2148 Texas Ave San Antonio, TX | 3.0 | 1.0 | 1131 | $1,375 | $1.22 | 24d | 1 | 1.41mi |
| 2331 Cincinnati Ave Unit 2345 03 San Antonio, TX | 3.0 | 1.0 | 950 | $1,300 | $1.37 | 3d | 1 | 1.42mi |
| 2331 Cincinnati Ave San Antonio, TX | 1.0–3.0 | 1.0 | 850 | $1,300 | $1.53 | 12d | 3 | 1.42mi |
| 3301 W Woodlawn Ave San Antonio, TX | 1.0–2.0 | 1.0 | 825 | $881 | $1.07 | 24d | 3 | 1.43mi |
| 1046 Hillcrest Dr San Antonio, TX | 4.0 | 2.0 | 1546 | $1,650 | $1.07 | 43d | 1 | 1.46mi |
Listing history 15 events
-
2026-06-18days on market $185,000 Active 27 DOM
-
2026-06-17days on market $185,000 Active 26 DOM
-
2026-06-16days on market $185,000 Active 25 DOM
-
2026-06-15days on market $185,000 Active 24 DOM
-
2026-06-13days on market $185,000 Active 22 DOM
-
2026-06-12days on market $185,000 Active 21 DOM
-
2026-06-09days on market $185,000 Active 18 DOM
-
2026-06-08days on market $185,000 Active 17 DOM
-
2026-06-08days on market $185,000 Active 16 DOM
-
2026-06-07days on market $185,000 Active 15 DOM
-
2026-06-03days on market $185,000 Active 12 DOM
-
2026-06-02statusdays on market $185,000 Active 11 DOM
-
2026-06-01days on market $185,000 New 10 DOM
-
2026-05-31remarks 391-char remark
-
2026-05-31$185,000 New 9 DOM
ⓘ Source: listings_history table (triggers on properties + properties_extension) + one-shot
backfill from property_details.listing_events for pre-trigger history.
Tax reassessment forecast TX · Resets to sale price
- Current annual tax
- $1,124 · $94/mo
- Projected year-2 tax
- $3,386 · $282/mo
- Expected delta
- +$2,261/yr (+$188/mo · 201.2%)
ⓘ Screening estimate from a state-policy table — verify with the county assessor before closing.
Climate risk First Street
- Flood 1/10 Low FEMA zone X (unshaded) · 0% chance over 30 yrs
- Wildfire 1/10 Low
- Heat 8/10 Severe 6 d/yr ≥108°F today · 19 d/yr by 30 yrs out
- Wind 8/10 Severe 80% chance of damaging wind over 30 yrs
- Air quality 2/10 Low 1 unhealthy d/yr today · 1 by 30 yrs out
Nearby sold comps map
Loading sold comps map…
Walkable amenities ~0.75 mi
Loading nearby amenities…
Taxation est. · year 1
- Rental income
- $17,571
- − Mortgage interest
- −$10,363
- − Property taxes
- −$1,124
- − Insurance
- −$925
- − Repairs & maintenance
- −$1,406
- − Management
- −$1,406
- − Depreciation
- −$5,382
- Taxable loss
- −$3,034
- Est. tax savings @ 24.0%
- +$728
- After-tax cash flow
- $918/yr
For passive investors: Depreciation is non-cash, so a rental often shows a tax loss while cash-flowing — sheltering income. Rental losses are passive: they offset passive income freely, and up to $25,000/yr can offset ordinary (W-2) income if you actively participate and your MAGI is under $100k (phasing out to $0 by $150k); unused losses carry forward. On sale, claimed depreciation is recaptured at up to 25%, and gains may owe capital-gains tax (a 1031 exchange can defer both). Figures are a year-1 estimate at your 24.0% rate — not tax advice; consult a CPA.
Schools (NCES district)
- District
- Edgewood ISD
- NCES district ID
- 4818150
- Math proficiency
- 12% ▼ -18.00%
- Reading proficiency
- 21% ▼ -5.00%
- Median HH income
- $27,419
- Composite
- 12.82/100
- National rank
- #9597
- State rank
- #812 of 826 in TX
Livability — San Antonio
- Score
- 80/100
- State rank
- #31
- US rank
- #1616
Category grades
Schools grade is shown separately in the Schools card above.
Census & demographics
- Census place
- San Antonio, TX
- County
- Bexar County · 1,990,555 people
- City population
- 1,806,925
- Metro
- San Antonio-New Braunfels, TX
- Population (ZIP)
- 37,379
- Household income
- $42,772
- Rent vs Own
- Severe rent burden
- 1185.0
Population outlook (Bexar County) Hauer SSP2
- Today (2025)
- 2,336,851 people
- By 2030
- 2,560,728 · +9.6%
- By 2040
- 3,020,569 · +29.3%
- By 2050
- 3,493,522 · +49.5%
- By 2075
- 4,668,459 · +99.8%
- By 2100
- 5,533,242 · +136.8%
Race, ethnicity, and origin ACS 2023
- Neighborhood character
- Predominantly Hispanic (95%)
- Race & ethnicity
- Hispanic / Latino 95% Two or more races 50% White 3% Native American 2% Black 2%
- Hispanic origin (detail)
- Mexican 84%
- Foreign-born
- 18% · Canada
- Languages at home
- 34% English-only · Spanish 66%
Political lean MEDSL · Bexar
- 2024 margin
- Lean D (+9.8) · D 54.3% · R 44.6% · Other 1.1%
- 2008→2024 swing
- +4.2pp toward D · 2008: 5.6pp · 2024: 9.8pp
- All cycles
- 2024: D+9.8 2020: D+18.2 2016: D+13.5 2012: D+4.6 2008: D+5.6
Not yet ingested
- Civics
- —
Market trends
- HPI YoY
- ▲ 30.52%
- Current HPI
- 247.7257
- Rent YoY
- ▲ 6.13%
- Metro
- San Antonio-New Braunfels, TX
- State GDP YoY
- ▲ 3.95%
- F500 in state
- 110
Industry mix (Fortune 500 HQ in TX)
| Industry | F500 HQs | Revenue |
|---|---|---|
| Energy | 16 | $1,198B |
|
||
| Technology | 5 | $198B |
|
||
| Engineering / Construction | 4 | $72B |
|
||
| Energy Services | 3 | $60B |
|
||
| Utilities | 3 | $41B |
|
||
| Healthcare | 2 | $330B |
|
||
Price history
+134.2% since first listed5 events — show timeline
- 2026-05-22 Listed $185,000 LERA
- 2008-10-08 Listing Removed — LERA
- 2008-02-27 Listed $79,000 LERA
- 2007-12-26 Sold (Public Records) — Public Records
- 2006-05-09 Sold (Public Records) — Public Records
Property tax history
-3.4%/yrLatest (2025): $1,124 · -0.0% YoY. Source: county tax records.
Cash-flow waterfall
monthlySold comps — $/sqft
last 12 mo · ≤1 miLoading sold comps…