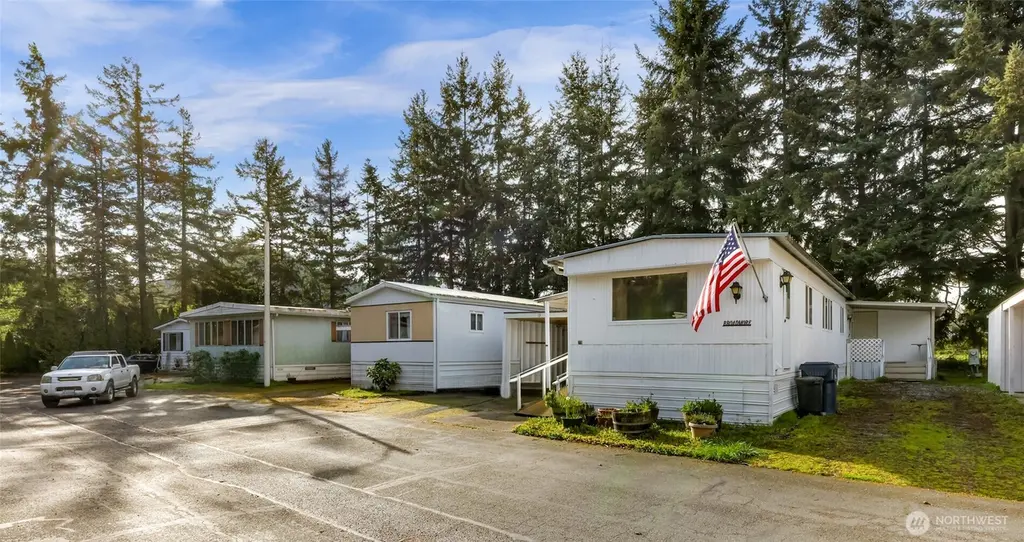
2210 Old Hwy 99 Rd #15 · Mount Vernon, WA
Flood risk 4/10 · Minor
- FEMA flood zone
- AO
- Chance of flooding over 30 yrs
- 0.22%
- Est. flood insurance / yr
- $848 – $2,087
Fire risk 3/10 · Minor
- Est. fire insurance / yr
- $604 – $1,122
Heat risk 2/10 · Minimal
- Hot days now (above 81°F)
- 7 days/yr
- Hot days in 30 yrs
- 18 days/yr
Wind risk 1/10 · Minimal
- Chance of severe wind over 30 yrs
- —
Air-quality risk 5/10 · Moderate
- Unhealthy air days now
- 7 days/yr
- Unhealthy air days in 30 yrs
- 7 days/yr
Risk factors via First Street. Map © Google.
Why this score? — see what drove the C grade
The composite is a weighted blend of 9 inputs, each scored 0–100. Each bar is that input's sub-score; the figure is the points it added to the 100-point composite (weight × sub-score).
- Cash flow +15.0/30.0
- Appreciation +10.0/10.0
- ARV discount +7.5/15.0
- 1% rule +5.0/10.0
- DSCR +5.0/10.0
- Schools +4.0/10.0
- Livability +4.0/5.0
- Rent growth +2.5/5.0
- Condition / age +2.5/5.0
$20,500
🖨 Deal sheet (PDF) 📄 Offer letter ✓ Due diligence
Listing remarks
Charming and cozy, 2 bedroom, 1 bath home nestled in a quiet, established 55+, mobile home park community. This vintage single-wide offers a large living area, functional kitchen with a small dining area as well as a comfortable primary bedroom with adjoining bathroom. All appliances included. Enjoy affordable living with low maintenance featuring a covered porch, carport and lots of storage with convenient access to local amenities and I-5. "Sold As Is".
Key facts
- Functional kitchen
- Covered porch
- Large living area
Tags
Neighborhood map
What this means for you Summary
Snapshot
- This is a 2-bed/1.5-bath manufactured listed at $20k.
Deal economics
- At list price, monthly cash flow is $1k ($17k/yr) — positive.
- The deal already cash-flows at list — no discount required.
- Meets the 1% rule at list price ($2k rent vs $20k).
- Recommended offer: $20k (3.0% below list) — sets the bar for market timing.
- Cap rate 94.7% vs local median 2.4% in Mount Vernon — top-decile yield for the area; either an underpriced asset or a hidden risk that comps aren't pricing in. Stress-test before assuming the spread holds.
Location & tenants
- Location reads 79/100 on livability (#106 in WA, #2,120 nationally) — a middle-class / working-renter tenant base. Strengths: commute A+, housing A+, health & safety A+; Watch: cost of living D+.
- Mount Vernon School District (urban): math 41% / reading 47% proficiency, ranked #189 of 291 in WA (top 65%) — families likely to look elsewhere, expect single-tenant / working-renter base with shorter leases.
- Market conditions: 96 active listings in the ZIP; 5 comparable units currently listed for rent nearby; rentals lingering (median 44d on market — plan ~5-8 weeks vacancy on turnover, expect pricing pressure); 80% of comp listings sitting > 30 days — soft ceiling on asking rent; 561 units permitted in Skagit County in 2024 (270 in 5+ unit buildings).
Forward outlook
- In year one you build about $2k of equity ($142 loan paydown + $2k appreciation (10.0% local appreciation)).
- Skagit County population projected at +11% by 2050 — modest demand growth; plan on rents tracking national, not racing it.
- At projected returns (10.0% appreciation + 3.0% rent growth), your $6k cash investment doubles in ~1 year — after that, you're playing with house money.
Negotiation context
- It's been on market 43 days — a 3% lower offer ($20k) is reasonable based on typical stale-listing flexibility.
Risks & watch-outs
- Watch-outs: flood insurance adds $122/mo.
- Climate carrying-cost: in FEMA flood zone AO (mandatory federal flood insurance) — expect insurance premiums to compound above CPI over the hold.
Questions for the listing agent
- It's been on market 43 days. Have you received any prior offers? Is the seller open to a 3% concession, seller financing, or rate buy-down credit?
- Built in 1977 — when were the roof, HVAC, electrical panel, plumbing, and water heater last replaced?
- What's the actual annual flood-insurance premium (NFIP or private), and is the property in a SFHA with mandatory coverage?
- Is there a deadline driving the sale (1031 exchange, divorce, estate, relocation)? That informs how much negotiation room exists.
- What's the average days-on-market for RENTAL listings here right now (not sales)? A rising rental-DOM trend means longer vacancies and softer asking-rent achievability than the comps imply.
- What's the recent tenant-quality profile in this submarket — average credit score on applications, eviction rate, late-payment / NSF rate, and stable-employment percentage? A property-management company in the area should have these aggregated.
- How much new for-sale + rental construction is in the pipeline within 1–3 miles? Heavy new supply typically softens prices + rents 12–24 months out; constrained supply supports both.
Investment metrics
- 1% rule
- 10.13% ✓
- Cap rate
- 94.70%
- Cash-on-cash
- 315.74%
- DSCR
- 15.05
- GRM
- 0.8
CMA / ARV
- ARV (median comp)
- $46,849
- List price
- $20,500
- Delta
- -56.24%
- Verdict
- UNDERPRICED
- Comps
- 4 within 1.0 mi
Show comp detail 5 sales within ~0.75 mi
| Address | Dist | Beds/Ba | Sqft | Sold | Price | $/sf | Match |
|---|---|---|---|---|---|---|---|
| 2210 Old Highway 99 South Rd #31 | 0.00mi | 2/1.0 | 938 (+2%) | 1mo | $45,000 | $48 | 95 |
| 2210 Old Highway 99 S #12 | 0.06mi | 2/1.0 | 924 (0%) | 6mo | $20,000 | $22 | 90 |
| 2210 Old Hwy 99 St | 0.06mi | 2/2.0 | 924 (0%) | 15mo | $30,000 | $32 | 83 |
| 2522 Old Highway 99 Rd S #6 | 0.21mi | 2/1.0 | 980 (+6%) | 1mo | $60,000 | $61 | 77 |
| 1009 Parkside Ter | 0.23mi | 2/1.0 | 800 (-13%) | 24mo | $61,000 | $76 | 45 |
Match score weights: distance 35% · size 25% · config 20% · recency 20%. Top-matched comps best support the ARV.
Projected returns pro-forma
10.0% appreciation · 3.0% rent growth · sell at horizon
- IRR
- —
- Equity multiple
- 18.36×
- Total profit
- $99,666
- Equity at exit
- $18,468
- IRR
- —
- Equity multiple
- 40.06×
- Total profit
- $224,180
- Equity at exit
- $39,827
Cash invested: $5,740 (down + closing). Projections, not guarantees.
Landlord ↔ Tenant lean methodology
- Overall (STATE)
- 28 Tenant-Leaning
- State Washington
- 28 Tenant-Leaning · D+8
- County
- — inherits STATE
- City
- — inherits STATE
ZIP-level market 98237
- Home prices YoY
- 18.6%
- Active inventory
- 96
- Price-to-rent
- 0.8×
Monthly cashflow live
- Estimated rent
- $2,077 high interval (Pro) →
- Mortgage (P&I)
- −$108
- Tax from tax record
- −$15 /mo · $178/yr
- Insurance
- −$9
- Flood insurance flood zone
- −$122 /mo · $1,468/yr
- HOA
- −$0
- Vacancy / Maint / Mgmt
- −$436
- Net cashflow
- $1,388
Break-even live
Sensitivity live
| Price | -10% $1,400 | -5% $1,394 | +0% $1,388 | +5% $1,382 | +10% $1,376 |
|---|---|---|---|---|---|
| Rent | -10% $1,224 | -5% $1,306 | +0% $1,388 | +5% $1,470 | +10% $1,552 |
| Rate | -1.0pp $1,398 | -0.5pp $1,393 | base $1,388 | +0.5pp $1,383 | +1.0pp $1,377 |
UW: 25.0% down · 7.5% · 30yr · 1.5% tax · 5.0% vac · 8.0% maint · 8.0% mgmt
Financing live
Cash to close
- Down payment
- $5,125
- Closing costs
- $615
- Reserves months
- —
- Total cash needed
- —
Loan-product check · same deal, 3 products live
Conventional
25% down · 7.5% · 30yr
- Down + closing
- —
- Monthly P&I
- —
- Monthly cashflow
- —
- DSCR
- —
- Eligible?
- —
Personal DTI + credit; lowest rate.
DSCR
20% down · 8.5% · 30yr
- Down + closing
- —
- Monthly P&I
- —
- Monthly cashflow
- —
- DSCR
- —
- Eligible?
- —
No personal income docs; deal must DSCR.
Hard money
10% down · 12.0% · 12mo
- Down + closing
- —
- Monthly P&I
- —
- Monthly cashflow
- —
- DSCR
- —
- Eligible?
- —
Short-term bridge; refi at stabilization.
Rent comps 5 comps
| Address | Beds | Baths | Sqft | Rent | $/sqft | DOM | Units | Dist |
|---|---|---|---|---|---|---|---|---|
| 1221 S 12th St Mount Vernon, WA | 2.0 | 1.0 | 833 | $2,195 | $2.64 | 44d | 1 | 0.69mi |
| 1511 Shirley Pl Mount Vernon, WA | 2.0 | 1.0 | 936 | $2,250 | $2.40 | 44d | 1 | 0.81mi |
| 1002 S 12th St Mount Vernon, WA | 2.0 | 1.0 | 1052 | $2,575 | $2.45 | 21d | 1 | 0.85mi |
| 1011 E Division St Unit 103 Mount Vernon, WA | 1.0 | 1.0 | 800 | $1,250 | $1.56 | 44d | 1 | 1.22mi |
| 130 Stanford Dr Unit C Mount Vernon, WA | 2.0 | 1.0 | 800 | $1,595 | $1.99 | 44d | 1 | 1.45mi |
Listing history 15 events
-
2026-06-19days on market $20,500 Active 43 DOM
-
2026-06-18days on market $20,500 Active 42 DOM
-
2026-06-17days on market $20,500 Active 41 DOM
-
2026-06-16days on market $20,500 Active 40 DOM
-
2026-06-15days on market $20,500 Active 39 DOM
-
2026-06-14days on market $20,500 Active 37 DOM
-
2026-06-13days on market $20,500 Active 36 DOM
-
2026-06-10days on market $20,500 Active 34 DOM
-
2026-06-09days on market $20,500 Active 33 DOM
-
2026-06-08days on market $20,500 Active 32 DOM
-
2026-06-07days on market $20,500 Active 31 DOM
-
2026-06-03days on market $20,500 Active 27 DOM
-
2026-06-03pricestatus $20,500 Active 26 DOM
-
2026-05-13status Pending
-
2026-04-17$22,500 Active
ⓘ Source: listings_history table (triggers on properties + properties_extension) + one-shot
backfill from property_details.listing_events for pre-trigger history.
Tax reassessment forecast WA · Resets to sale price
- Current annual tax
- $178 · $15/mo
- Projected year-2 tax
- $201 · $17/mo
- Expected delta
- +$23/yr (+$2/mo · 13.1%)
ⓘ Screening estimate from a state-policy table — verify with the county assessor before closing.
Climate risk First Street
- Flood 4/10 Moderate FEMA zone AO · 22% chance over 30 yrs
- Wildfire 3/10 Moderate
- Heat 2/10 Low 7 d/yr ≥81°F today · 18 d/yr by 30 yrs out
- Wind 1/10 Low
- Air quality 5/10 Major 7 unhealthy d/yr today · 7 by 30 yrs out
Nearby sold comps map
Loading sold comps map…
Walkable amenities ~0.75 mi
Loading nearby amenities…
Taxation est. · year 1
- Rental income
- $24,928
- − Mortgage interest
- −$1,148
- − Property taxes
- −$178
- − Insurance
- −$1,570
- − Repairs & maintenance
- −$1,994
- − Management
- −$1,994
- − Depreciation
- −$596
- Taxable income
- $17,448
- Est. tax owed @ 24.0%
- −$4,187
- After-tax cash flow
- $12,468/yr
For passive investors: Depreciation is non-cash, so a rental often shows a tax loss while cash-flowing — sheltering income. Rental losses are passive: they offset passive income freely, and up to $25,000/yr can offset ordinary (W-2) income if you actively participate and your MAGI is under $100k (phasing out to $0 by $150k); unused losses carry forward. On sale, claimed depreciation is recaptured at up to 25%, and gains may owe capital-gains tax (a 1031 exchange can defer both). Figures are a year-1 estimate at your 24.0% rate — not tax advice; consult a CPA.
Schools (NCES district)
- District
- Mount Vernon School District
- NCES district ID
- 5305400
- Math proficiency
- 41% ▼ -1.00%
- Reading proficiency
- 47% ▲ 1.00%
- Median HH income
- $50,829
- Composite
- 40.14/100
- National rank
- #7848
- State rank
- #189 of 291 in WA
Livability — Mount Vernon
- Score
- 79/100
- State rank
- #106
- US rank
- #2120
Category grades
Schools grade is shown separately in the Schools card above.
Census & demographics
- Census place
- Mount Vernon, WA
- City population
- 48,861
- Population (ZIP)
- 5,110
Population outlook (Skagit County) Hauer SSP2
- Today (2025)
- 131,498 people
- By 2030
- 135,556 · +3.1%
- By 2040
- 141,717 · +7.8%
- By 2050
- 145,714 · +10.8%
- By 2075
- 152,201 · +15.7%
- By 2100
- 147,980 · +12.5%
Race, ethnicity, and origin ACS 2023
- Neighborhood character
- Predominantly White (79%)
- Race & ethnicity
- White 79% Hispanic / Latino 12% Two or more races 8% Native American 1%
- Hispanic origin (detail)
- Mexican 3% Puerto Rican 2%
- Common ancestry
- Portuguese 5% Iranian 4% Slovak 3%
- Foreign-born
- 3% · Canada
- Languages at home
- 94% English-only · Spanish 4% French/Haitian/Cajun 1% Russian/Polish/Slavic 1%
Political lean MEDSL · Skagit
- 2024 margin
- Lean D (+8.9) · D 52.9% · R 44.0% · Other 3.0%
- 2008→2024 swing
- -0.7pp no change · 2008: 9.6pp · 2024: 8.9pp
- All cycles
- 2024: D+8.9 2020: D+7.5 2016: D+3.2 2012: D+5.8 2008: D+9.6
Not yet ingested
- Civics
- —
Market trends
- HPI YoY
- ▲ 83.52%
- Current HPI
- 533.5113
- Rent YoY
- —
- Metro
- —
- State GDP YoY
- ▲ 4.65%
- F500 in state
- 22
Industry mix (Fortune 500 HQ in WA)
| Industry | F500 HQs | Revenue |
|---|---|---|
| Retail | 2 | $269B |
|
||
| Technology / Retail | 1 | $638B |
|
||
| Technology | 1 | $245B |
|
||
| Telecommunications | 1 | $38B |
|
||
| Food / Beverage | 1 | $36B |
|
||
| Automotive / Trucks | 1 | $34B |
|
||
Price history
2 events — show timeline
- 2026-05-13 Pending — NWMLS as Distributed by MLS Grid
- 2026-04-17 Listed $22,500 NWMLS as Distributed by MLS Grid
Property tax history
+1.3%/yrLatest (2026): $178 · +14.8% YoY. Source: county tax records.
Cash-flow waterfall
monthlySold comps — $/sqft
last 12 mo · ≤1 miLoading sold comps…