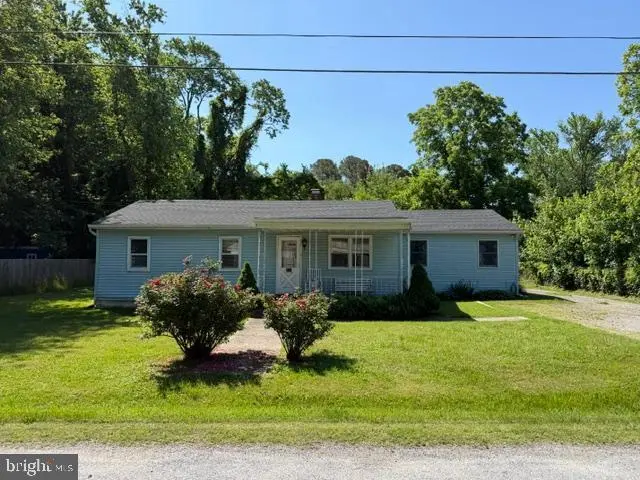
106 Fischer Rd · Grasonville, MD
Flood risk 4/10 · Minor
- FEMA flood zone
- X (unshaded)
- Chance of flooding over 30 yrs
- 0.13%
- Est. flood insurance / yr
- $507 – $1,088
Fire risk 3/10 · Minor
- Est. fire insurance / yr
- $755 – $1,403
Heat risk 8/10 · Major
- Hot days now (above 104°F)
- 7 days/yr
- Hot days in 30 yrs
- 16 days/yr
Wind risk 6/10 · Moderate
- Chance of severe wind over 30 yrs
- 71.0%
Air-quality risk 4/10 · Minor
- Unhealthy air days now
- 4 days/yr
- Unhealthy air days in 30 yrs
- 6 days/yr
Risk factors via First Street. Map © Google.
Why this score? — see what drove the C+ grade
The composite is a weighted blend of 9 inputs, each scored 0–100. Each bar is that input's sub-score; the figure is the points it added to the 100-point composite (weight × sub-score).
- Cash flow +22.0/30.0
- ARV discount +15.0/15.0
- DSCR +7.0/10.0
- 1% rule +5.1/10.0
- Livability +3.7/5.0
- Schools +3.0/10.0
- Rent growth +2.5/5.0
- Condition / age +2.5/5.0
- Appreciation +0.0/10.0
$240,000
🖨 Deal sheet 📄 Offer letter ✓ Due diligence
Listing remarks
Estate Sale Opportunity in Grasonville, MD! 3 Bedrooms |2 Full Bathrooms | Private Well & Public Septic . SOLD AS-IS, SELLER WILL MAKE NO REPAIRS. Don't miss this opportunity to purchase a single-family home tucked away on a quiet street in sought-after Grasonville, Queen Anne's County. This home sits on a spacious flat lot and has a detached 2 car garage. Buyer is responsible for all due diligence. Home will require major renovation to the floor structure of the home to include among other things floor joist, bandboard and sub flooring. !!! Inspection recommended !!!! Inspection for informational purposes Only. THERE ARE TWO SPOTS IN THE HOME THAT ARE MARKED WHERE THE FLOOR IS REALLY
Key facts
- Spacious flat lot
- Private well
- Major renovation
Tags
Property features AI
Finance
- Other: Fee simple ownership
Exterior
- Parking: Detached garage with 2 spaces; Side-entry garage with additional storage area; Off-street parking and driveway
- Utilities: Well water; Public septic; Hot water supplied by oil, propane, and electric
- Home design: Detached structure
- Construction: Concrete and frame construction with vinyl siding; Casement windows; Other foundation type
- Exterior features: Partially fenced yard; Cleared lot; Rear yard; Deck(s); Porch(es)
Interior
- Kitchen: Gas oven/range; Stove
- Bedrooms: 3 bedrooms on the main level
- Flooring: Carpet
- Bathrooms: 2 full bathrooms (both on the main level)
- Heating & cooling: Electric baseboard heating; Window air conditioning units; Oil heating fuel
- Interior features: Attic; Carpeted areas; Dining area; Family room off the kitchen; Traditional floor plan; Kitchen efficiency layout; Stall shower; Insulated doors; Sliding glass door; Storm door
- Laundry & utility: No basement
Neighborhood map
What this means for you Summary
Snapshot
- This is a 3-bed/2.0-bath single-family listed at $240k.
Deal economics
- At list price, monthly cash flow is $380 ($5k/yr) — positive.
- The deal already cash-flows at list — no discount required.
- Meets the 1% rule at list price ($2k rent vs $240k).
- Recommended offer: $236k (1.5% below list) — sets the bar for market timing.
- Cap rate 8.2% vs local median 1.6% in Grasonville — top-decile yield for the area; either an underpriced asset or a hidden risk that comps aren't pricing in. Stress-test before assuming the spread holds.
Location & tenants
- Location reads 74/100 on livability (#116 in MD, #4,789 nationally) — a middle-class / working-renter tenant base. Strengths: employment A+, housing A+, crime A; Watch: amenities F, commute F, cost of living F.
- Queen Anne'S County Public Schools (rural): math 22% / reading 39% proficiency, ranked #7 of 24 in MD (top 29%) — families likely to look elsewhere, expect single-tenant / working-renter base with shorter leases.
- Market conditions: 52 active listings in the ZIP; 3 comparable units currently listed for rent nearby; rentals at typical pace (median 17d on market — plan ~3-4 weeks tenant-placement turnaround); 320 units permitted in Queen Anne's County in 2024 (56 in 5+ unit buildings).
Forward outlook
- Local home prices are declining (-3.0%/yr); year-one equity from $2k of loan paydown is wiped out by about $7k of value loss. Plan a longer hold.
Negotiation context
- It's been on market 21 days — a 2% lower offer ($236k) is reasonable based on typical stale-listing flexibility.
Risks & watch-outs
- Climate carrying-cost: major wind risk, 71% chance of damaging wind over 30y; extreme-heat days projected 7→16/yr by 2055 (HVAC capex compounding) — expect insurance premiums to compound above CPI over the hold.
Questions for the listing agent
- Built in 1963 — when were the roof, HVAC, electrical panel, plumbing, and water heater last replaced?
- Is there a deadline driving the sale (1031 exchange, divorce, estate, relocation)? That informs how much negotiation room exists.
- What's the average days-on-market for RENTAL listings here right now (not sales)? A rising rental-DOM trend means longer vacancies and softer asking-rent achievability than the comps imply.
- What's the recent tenant-quality profile in this submarket — average credit score on applications, eviction rate, late-payment / NSF rate, and stable-employment percentage? A property-management company in the area should have these aggregated.
- How much new for-sale + rental construction is in the pipeline within 1–3 miles? Heavy new supply typically softens prices + rents 12–24 months out; constrained supply supports both.
Investment metrics
- 1% rule
- 1.01% ✓
- Cap rate
- 8.19%
- Cash-on-cash
- 6.79%
- DSCR
- 1.30
- GRM
- 8.3
CMA / ARV
- ARV (on-the-fly)
- $360,360
- Comps found
- 12
Show comp detail 12 sales within ~0.75 mi
| Address | Dist | Beds/Ba | Sqft | Sold | Price | $/sf | Match |
|---|---|---|---|---|---|---|---|
| 4604 Main St | 0.10mi | 3/2.5 | 1,344 (+7%) | 0mo | $400,000 | $298 | 82 |
| 4606 Main St | 0.11mi | 3/2.5 | 1,344 (+7%) | 0mo | $399,900 | $298 | 81 |
| 114 Fischer Rd | 0.03mi | 3/2.0 | 1,144 (-9%) | 6mo | $314,000 | $274 | 78 |
| 113 Collier Rd | 0.35mi | 3/2.0 | 1,287 (+2%) | 4mo | $390,000 | $303 | 77 |
| 113 Moes Ln | 0.18mi | 3/2.0 | 1,152 (-9%) | 6mo | $330,000 | $286 | 72 |
| 116 Pine | 0.42mi | 3/2.0 | 1,232 (-2%) | 6mo | $320,000 | $260 | 71 |
| 112 Melvin Ave | 0.09mi | 3/1.0 | 1,120 (-11%) | 15mo | $175,000 | $156 | 61 |
| 109/107 Winchester Ave | 0.51mi | 3/2.0 | 1,316 (+4%) | 12mo | $440,000 | $334 | 58 |
| 110 Stewart Ln | 0.37mi | 3/2.5 | 1,420 (+13%) | 5mo | $395,000 | $278 | 56 |
| 604 Perrys Corner Rd | 0.61mi | 2/1.5 (-1) | 1,336 (+6%) | 1mo | $365,000 | $273 | 54 |
| 117 Rebel Rd | 0.66mi | 3/2.0 | 1,432 (+14%) | 1mo | $352,500 | $246 | 46 |
| 321 Timber Ln | 0.51mi | 4/3.0 (+1) | 1,128 (-10%) | 8mo | $420,000 | $372 | 43 |
Match score weights: distance 35% · size 25% · config 20% · recency 20%. Top-matched comps best support the ARV.
Projected returns pro-forma
-3.0% appreciation · 3.0% rent growth · sell at horizon
- IRR
- -5.9%
- Equity multiple
- 0.78×
- Total profit
- $-14,712
- Equity at exit
- $35,785
- IRR
- 3.7%
- Equity multiple
- 1.27×
- Total profit
- $18,201
- Equity at exit
- $20,751
Cash invested: $67,200 (down + closing). Projections, not guarantees.
Landlord ↔ Tenant lean methodology
- Overall (STATE)
- 27 Tenant-Leaning
- State Maryland
- 27 Tenant-Leaning · D+14
- County
- — inherits STATE
- City
- — inherits STATE
ZIP-level market 21638
- Home prices YoY
- -4.7%
- Active inventory
- 52
- Price-to-rent
- 8.3×
Monthly cashflow live
- Estimated rent
- $2,416 medium interval (Pro) →
- Mortgage (P&I)
- −$1,259
- Tax from tax record
- −$170 /mo · $2,036/yr
- Insurance
- −$100
- HOA
- −$0
- Vacancy / Maint / Mgmt
- −$507
- Net cashflow
- $380
Break-even live
UW: 25.0% down · 7.5% · 30yr · 1.5% tax · 5.0% vac · 8.0% maint · 8.0% mgmt
Financing live
Cash to close
- Down payment
- $60,000
- Closing costs
- $7,200
- Reserves months
- —
- Total cash needed
- —
Loan-product check · same deal, 3 products live
Conventional
25% down · 7.5% · 30yr
- Down + closing
- —
- Monthly P&I
- —
- Monthly cashflow
- —
- DSCR
- —
- Eligible?
- —
Personal DTI + credit; lowest rate.
DSCR
20% down · 8.5% · 30yr
- Down + closing
- —
- Monthly P&I
- —
- Monthly cashflow
- —
- DSCR
- —
- Eligible?
- —
No personal income docs; deal must DSCR.
Hard money
10% down · 12.0% · 12mo
- Down + closing
- —
- Monthly P&I
- —
- Monthly cashflow
- —
- DSCR
- —
- Eligible?
- —
Short-term bridge; refi at stabilization.
Rent comps 3 comps
| Address | Beds | Baths | Sqft | Rent | $/sqft | DOM | Units | Dist |
|---|---|---|---|---|---|---|---|---|
| 305 Fox Run Grasonville, MD | 3.0 | 1.5 | 1220 | $2,100 | $1.72 | 16d | 1 | 0.67mi |
| 3809 Main St Grasonville, MD | 2.0 | 2.0 | 1280 | $2,800 | $2.19 | 2d | 1 | 0.94mi |
| 421 Sawmill Ln Grasonville, MD | 4.0 | 2.0 | 1536 | $2,500 | $1.63 | 24d | 1 | 1.20mi |
Listing history 14 events
-
2026-06-18days on market $240,000 Active 21 DOM
-
2026-06-17days on market $240,000 Active 20 DOM
-
2026-06-16days on market $240,000 Active 19 DOM
-
2026-06-15days on market $240,000 Active 18 DOM
-
2026-06-13days on market $240,000 Active 16 DOM
-
2026-06-09days on market $240,000 Active 12 DOM
-
2026-06-08days on market $240,000 Active 11 DOM
-
2026-06-07days on market $240,000 Active 10 DOM
-
2026-06-04days on market $240,000 Active 7 DOM
-
2026-06-03days on market $240,000 Active 6 DOM
-
2026-06-02days on market $240,000 Active 5 DOM
-
2026-06-01days on market $240,000 Active 4 DOM
-
2026-05-31days on market $240,000 Active 3 DOM
-
2026-05-28$240,000 Active
ⓘ Source: listings_history table (triggers on properties + properties_extension) + one-shot
backfill from property_details.listing_events for pre-trigger history.
Tax reassessment forecast MD · Partial reset (capped growth)
- Current annual tax
- $2,036 · $170/mo
- Projected year-2 tax
- $2,326 · $194/mo
- Expected delta
- +$290/yr (+$24/mo · 14.2%)
ⓘ Screening estimate from a state-policy table — verify with the county assessor before closing.
Climate risk First Street
- Flood 4/10 Moderate FEMA zone X (unshaded) · 13% chance over 30 yrs
- Wildfire 3/10 Moderate
- Heat 8/10 Severe 7 d/yr ≥104°F today · 16 d/yr by 30 yrs out
- Wind 6/10 Major 71% chance of damaging wind over 30 yrs
- Air quality 4/10 Moderate 4 unhealthy d/yr today · 6 by 30 yrs out
Nearby sold comps map
Loading sold comps map…
Walkable amenities ~0.75 mi
Loading nearby amenities…
Taxation est. · year 1
- Rental income
- $28,991
- − Mortgage interest
- −$13,444
- − Property taxes
- −$2,036
- − Insurance
- −$1,200
- − Repairs & maintenance
- −$2,319
- − Management
- −$2,319
- − Depreciation
- −$6,982
- Taxable income
- $691
- Est. tax owed @ 24.0%
- −$166
- After-tax cash flow
- $4,398/yr
For passive investors: Depreciation is non-cash, so a rental often shows a tax loss while cash-flowing — sheltering income. Rental losses are passive: they offset passive income freely, and up to $25,000/yr can offset ordinary (W-2) income if you actively participate and your MAGI is under $100k (phasing out to $0 by $150k); unused losses carry forward. On sale, claimed depreciation is recaptured at up to 25%, and gains may owe capital-gains tax (a 1031 exchange can defer both). Figures are a year-1 estimate at your 24.0% rate — not tax advice; consult a CPA.
Schools (NCES district)
- District
- Queen Anne'S County Public Schools
- NCES district ID
- 2400540
- Math proficiency
- 22% ▼ -30.00%
- Reading proficiency
- 39% ▼ -22.00%
- Median HH income
- $84,577
- Composite
- 29.86/100
- National rank
- #6406
- State rank
- #7 of 24 in MD
Livability — Grasonville
- Score
- 74/100
- State rank
- #116
- US rank
- #4789
Category grades
Schools grade is shown separately in the Schools card above.
Census & demographics
- Census place
- Grasonville, MD
- Population (ZIP)
- 5,068
Population outlook (Queen Anne's County) Hauer SSP2
- Today (2025)
- 51,149 people
- By 2030
- 51,979 · +1.6%
- By 2040
- 52,728 · +3.1%
- By 2050
- 51,828 · +1.3%
- By 2075
- 50,169 · -1.9%
- By 2100
- 44,442 · -13.1%
Race, ethnicity, and origin ACS 2023
- Neighborhood character
- Predominantly White (80%)
- Race & ethnicity
- White 80% Two or more races 10% Hispanic / Latino 5% Black 5%
- Hispanic origin (detail)
- Common ancestry
- Slovak 4% Italian 3% Romanian 3%
- Foreign-born
- 4% · Canada, South Korea, Dominican Republic
- Languages at home
- 95% English-only · Spanish 3% Other Indo-European 1%
Political lean MEDSL · Queen Anne's
- 2024 margin
- Strong R (+27.8) · D 35.1% · R 62.9% · Other 2.1%
- 2008→2024 swing
- -0.7pp no change · 2008: -27.1pp · 2024: -27.8pp
- All cycles
- 2024: R+27.8 2020: R+26.5 2016: R+36.1 2012: R+30.1 2008: R+27.1
Not yet ingested
- Civics
- —
Market trends
- HPI YoY
- ▼ -12.55%
- Current HPI
- 256.8252
- Rent YoY
- —
- Metro
- —
- State GDP YoY
- ▲ 2.97%
- F500 in state
- 12
Industry mix (Fortune 500 HQ in MD)
| Industry | F500 HQs | Revenue |
|---|---|---|
| Aerospace / Defense | 1 | $71B |
|
||
| Utilities | 1 | $25B |
|
||
| Hotels | 1 | $24B |
|
||
| Consumer Goods | 1 | $7B |
|
||
| Real Estate | 1 | $6B |
|
||
| Chemicals | 1 | $2B |
|
||
Price history
1 event — show timeline
- 2026-05-28 Listed $240,000 BRIGHT MLS
Property tax history
+4.0%/yrLatest (2025): $2,036 · +5.4% YoY. Source: county tax records.
Cash-flow waterfall
monthlySold comps — $/sqft
last 12 mo · ≤1 miLoading sold comps…