11-2792 Ohia Ave · Eden Roc, HI
Flood risk 8/10 · Major
- FEMA flood zone
- X (unshaded)
- Chance of flooding over 30 yrs
- 0.99%
- Est. flood insurance / yr
- $473 – $860
Fire risk No data
- Est. fire insurance / yr
- —
Heat risk No data
- Hot days now (above threshold)
- —
- Hot days in 30 yrs
- —
Wind risk No data
- Chance of severe wind over 30 yrs
- —
Air-quality risk 1/10 · Minimal
- Unhealthy air days now
- —
- Unhealthy air days in 30 yrs
- —
Risk factors via First Street. Map © Google.
Why this score? — see what drove the D grade
The composite is a weighted blend of 9 inputs, each scored 0–100. Each bar is that input's sub-score; the figure is the points it added to the 100-point composite (weight × sub-score).
- Cash flow +10.8/30.0
- ARV discount +7.5/15.0
- Appreciation +5.4/10.0
- Schools +3.7/10.0
- 1% rule +3.2/10.0
- DSCR +3.1/10.0
- Livability +2.6/5.0
- Rent growth +2.5/5.0
- Condition / age +2.5/5.0
$295,000
🖨 Deal sheet 📄 Offer letter ✓ Due diligence
Listing remarks MLS
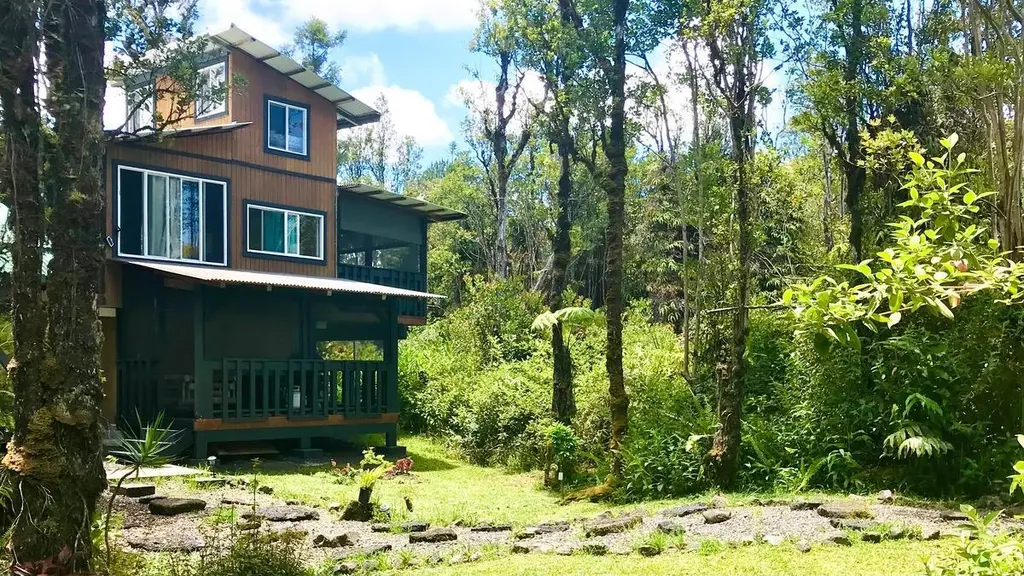
Move-in ready one-acre property in Eden Roc Estates, located on paved main road with easy access. This unique compound (approx. 167.3′ × 260.4') features three fully furnished cabins, sustainable infrastructure, and room to expand gardens or add to existing buildings. The property offers income potential and instant equity from day one. Ideal for multi-generational living, vacation rental, or a personal rainforest retreat. Cabin 1-Plantation-Style Cottage (2020): Bright and inviting with high ceilings, covered lanai, and two entrances, including direct kitchen access—perfect as a full-time residence or caretaker suite. Cabin 2-Multi-Level Treehouse (updated 2019): A guest favorite with a bedroom, flexible loft space, two showers, full kitchen, utility storage, and lanai—ideal for visitors or rental use. Cabin 3-Modern Open-Concept Cabin (2021): Thoughtfully designed with an open kitchen, built-in bar/dining area, spacious loft and bedroom, ample storage, a wrap-around lanai for relaxing or entertaining. Each cabin operates on solar power, rainwater catchment, and biogas systems, keeping utilities minimal and your lifestyle green. High-speed fiber-optic internet is already connected, and overhead power is available as an option. Two gated entrances and a private drive enhance security and accessibility. Complete 24-Volt Solar Systems Included: Cabins 1 & 3: 4 panels each, 2×12V 200Ah lithium batteries, 2000W & 3000W pure sine inverters, Outback FM60 charge controllers. Cabin 2: 3 panels, 1500W pure sine inverter, Epever 5415 charge controller.
Key facts
- Income potential
- Vacation rental
- One acre property
Tags
Neighborhood map
What this means for you Summary
Snapshot
- This is a 4-bed/3.5-bath single-family listed at $295k.
Deal economics
- At list price, monthly cash flow is $-192 ($-2k/yr) — negative.
- To cash-flow at today's rent, offer at most $267k (9.4% below list).
- To meet the 1% rule (rent ≥ 1% of price), the offer needs to be $241k (18.4% below list).
- Recommended offer: $241k (18.4% below list) — sets the bar for 1% rule.
Location & tenants
- Location reads 52/100 on livability (#145 in HI) — a working-class tenant base; expect higher turnover. Strengths: housing B+, cost of living B; Watch: health & safety C-, schools F, crime D-.
- Hawaii Department Of Education (suburban): math 32% / reading 50% proficiency, ranked #1 of 1 in HI (top 100%) — families likely to look elsewhere, expect single-tenant / working-renter base with shorter leases.
- Market conditions: 129 active listings in the ZIP; 982 units permitted in Hawaii County in 2024 (0 in 5+ unit buildings).
Forward outlook
- In year one you build about $4k of equity ($2k loan paydown + $2k appreciation (0.7% local appreciation)).
- Hawaii County population projected at +24% by 2050 — long-run rental-demand tailwind backs the buy-and-hold thesis.
- By year 8, paydown + projected appreciation supports a ~$35k cash-out refi (75% LTV) — recoverable capital for the next deal without selling this one.
Negotiation context
- It's been on market 220 days — a 12% lower offer ($260k) is reasonable based on typical stale-listing flexibility.
- 8 sale attempts since 14y ago with the ask held roughly flat each time — persistent listings suggest the price (not the market) is what's stuck; bring a comps-based counter.
- Current owner paid $60k; list at $295k implies a 392% gain — meaningful room to come down on a strong offer.
Risks & watch-outs
- Watch-outs: flood insurance adds $56/mo.
- Climate carrying-cost: severe flood risk — expect insurance premiums to compound above CPI over the hold.
Questions for the listing agent
- What do current leases actually rent for vs. the listed asking? Can we see a recent rent roll and the last 12 months of T-12 income?
- It's been on market 220 days. Have you received any prior offers? Is the seller open to a 18% concession, seller financing, or rate buy-down credit?
- What's the actual annual flood-insurance premium (NFIP or private), and is the property in a SFHA with mandatory coverage?
- Why hasn't it sold? Are there any deal-killer items the seller is aware of (foundation, flood, title, zoning, code violations)?
- Is there a deadline driving the sale (1031 exchange, divorce, estate, relocation)? That informs how much negotiation room exists.
- Schools are F-rated, which usually means shorter tenancies and higher turnover. Who's the typical renter profile here, and what's been the actual vacancy rate?
- Crime grade is D in this area — have there been break-ins, vandalism, or insurance claims at this property in the last 3 years? What carrier currently insures it and at what premium?
- The area grade is low — what's the realistic commute time and amenity access for the typical tenant pool here? Any planned neighborhood developments (good or bad) we should know about?
- What's the average days-on-market for RENTAL listings here right now (not sales)? A rising rental-DOM trend means longer vacancies and softer asking-rent achievability than the comps imply.
- What's the recent tenant-quality profile in this submarket — average credit score on applications, eviction rate, late-payment / NSF rate, and stable-employment percentage? A property-management company in the area should have these aggregated.
- How much new for-sale + rental construction is in the pipeline within 1–3 miles? Heavy new supply typically softens prices + rents 12–24 months out; constrained supply supports both.
Investment metrics
- 1% rule
- 0.82% ✗
- Cap rate
- 5.74%
- Cash-on-cash
- -1.98%
- DSCR
- 0.91
- GRM
- 10.2
CMA / ARV
No comps found within radius.
Projected returns pro-forma
0.74% appreciation · 3.0% rent growth · sell at horizon
- IRR
- -2.5%
- Equity multiple
- 0.87×
- Total profit
- $-10,433
- Equity at exit
- $96,680
- IRR
- 2.7%
- Equity multiple
- 1.32×
- Total profit
- $26,235
- Equity at exit
- $125,421
Cash invested: $82,600 (down + closing). Projections, not guarantees.
Landlord ↔ Tenant lean methodology
- Overall (STATE)
- 37 Tenant-Leaning
- State Hawaii
- 37 Tenant-Leaning · D+13
- County
- — inherits STATE
- City
- — inherits STATE
ZIP-level market 96771
- Home prices YoY
- 0.4%
- Active inventory
- 129
- Price-to-rent
- 10.2×
Monthly cashflow live
- Estimated rent
- $2,408 medium interval (Pro) →
- Mortgage (P&I)
- −$1,547
- Tax est. 1.5%
- −$369 /mo · $4,425/yr
- Insurance
- −$123
- Flood insurance flood zone
- −$56 /mo · $666/yr
- HOA
- −$0
- Vacancy / Maint / Mgmt
- −$506
- Net cashflow
- $-192
Break-even live
UW: 25.0% down · 7.5% · 30yr · 1.5% tax · 5.0% vac · 8.0% maint · 8.0% mgmt
Financing live
Cash to close
- Down payment
- $73,750
- Closing costs
- $8,850
- Reserves months
- —
- Total cash needed
- —
Loan-product check · same deal, 3 products live
Conventional
25% down · 7.5% · 30yr
- Down + closing
- —
- Monthly P&I
- —
- Monthly cashflow
- —
- DSCR
- —
- Eligible?
- —
Personal DTI + credit; lowest rate.
DSCR
20% down · 8.5% · 30yr
- Down + closing
- —
- Monthly P&I
- —
- Monthly cashflow
- —
- DSCR
- —
- Eligible?
- —
No personal income docs; deal must DSCR.
Hard money
10% down · 12.0% · 12mo
- Down + closing
- —
- Monthly P&I
- —
- Monthly cashflow
- —
- DSCR
- —
- Eligible?
- —
Short-term bridge; refi at stabilization.
Listing history 31 events
-
2026-06-18days on market $295,000 Active 220 DOM
-
2026-06-17days on market $295,000 Active 219 DOM
-
2026-06-15days on market $295,000 Active 217 DOM
-
2026-06-13days on market $295,000 Active 215 DOM
-
2026-06-13days on market $295,000 Active 214 DOM
-
2026-06-10days on market $295,000 Active 212 DOM
-
2026-06-09days on market $295,000 Active 211 DOM
-
2026-06-08days on market $295,000 Active 210 DOM
-
2026-06-07days on market $295,000 Active 209 DOM
-
2026-06-05days on market $295,000 Active 206 DOM
-
2026-06-03days on market $295,000 Active 205 DOM
-
2026-06-02days on market $295,000 Active 204 DOM
-
2026-06-01days on market $295,000 Active 203 DOM
-
2026-05-31days on market $295,000 Active 202 DOM
-
2025-11-05$295,000 Active 1610-char remark
Show marketing remark (1610 chars)
Move-in ready one-acre property in Eden Roc Estates, located on paved main road with easy access. This unique compound (approx. 167.3′ × 260.4') features three fully furnished cabins, sustainable infrastructure, and room to expand gardens or add to existing buildings. The property offers income potential and instant equity from day one. Ideal for multi-generational living, vacation rental, or a personal rainforest retreat. Cabin 1-Plantation-Style Cottage (2020): Bright and inviting with high ceilings, covered lanai, and two entrances, including direct kitchen access—perfect as a full-time residence or caretaker suite. Cabin 2-Multi-Level Treehouse (updated 2019): A guest favorite with a bedroom, flexible loft space, two showers, full kitchen, utility storage, and lanai—ideal for visitors or rental use. Cabin 3-Modern Open-Concept Cabin (2021): Thoughtfully designed with an open kitchen, built-in bar/dining area, spacious loft and bedroom, ample storage, a wrap-around lanai for relaxing or entertaining. Each cabin operates on solar power, rainwater catchment, and biogas systems, keeping utilities minimal and your lifestyle green. High-speed fiber-optic internet is already connected, and overhead power is available as an option. Two gated entrances and a private drive enhance security and accessibility. Complete 24-Volt Solar Systems Included: Cabins 1 & 3: 4 panels each, 2×12V 200Ah lithium batteries, 2000W & 3000W pure sine inverters, Outback FM60 charge controllers. Cabin 2: 3 panels, 1500W pure sine inverter, Epever 5415 charge controller.
-
2025-06-29historical
-
2024-07-01$325,000 Active
-
2023-10-04historical
-
2023-04-11$325,000 Active
-
2019-07-05soldstatus $60,000 Sold
-
2019-06-05historical Contingent
-
2019-05-27$60,000 Active
-
2018-12-20soldstatus $52,000 Sold
-
2018-12-02historical Contingent
-
2018-11-30status Active
-
2018-11-25historical Contingent
-
2018-11-16status Active
-
2018-10-25historical
-
2018-10-17$50,000 Active
-
2012-12-14soldstatus $13,000
-
2012-09-18$14,000
ⓘ Source: listings_history table (triggers on properties + properties_extension) + one-shot
backfill from property_details.listing_events for pre-trigger history.
Climate risk First Street
- Flood 8/10 Severe FEMA zone X (unshaded) · 99% chance over 30 yrs
- Air quality 1/10 Low
Nearby sold comps map
Loading sold comps map…
Walkable amenities ~0.75 mi
Loading nearby amenities…
Taxation est. · year 1
- Rental income
- $28,893
- − Mortgage interest
- −$16,525
- − Property taxes
- −$4,425
- − Insurance
- −$2,142
- − Repairs & maintenance
- −$2,311
- − Management
- −$2,311
- − Depreciation
- −$8,582
- Taxable loss
- −$7,403
- Est. tax savings @ 24.0%
- +$1,777
- After-tax cash flow
- $-528/yr
For passive investors: Depreciation is non-cash, so a rental often shows a tax loss while cash-flowing — sheltering income. Rental losses are passive: they offset passive income freely, and up to $25,000/yr can offset ordinary (W-2) income if you actively participate and your MAGI is under $100k (phasing out to $0 by $150k); unused losses carry forward. On sale, claimed depreciation is recaptured at up to 25%, and gains may owe capital-gains tax (a 1031 exchange can defer both). Figures are a year-1 estimate at your 24.0% rate — not tax advice; consult a CPA.
Schools (NCES district)
- District
- Hawaii Department Of Education
- NCES district ID
- 1500030
- Math proficiency
- 32% ▼ -10.00%
- Reading proficiency
- 50% ▼ -3.00%
- Median HH income
- $69,005
- Composite
- 37.07/100
- National rank
- #4504
- State rank
- #1 of 1 in HI
Livability — Eden Roc
- Score
- 52/100
- State rank
- #145
- US rank
- #25131
Category grades
Schools grade is shown separately in the Schools card above.
Census & demographics
- Census place
- Eden Roc, HI
- Population (ZIP)
- 7,736
Population outlook (Hawaii County) Hauer SSP2
- Today (2025)
- 220,733 people
- By 2030
- 232,156 · +5.2%
- By 2040
- 252,486 · +14.4%
- By 2050
- 272,703 · +23.5%
- By 2075
- 332,113 · +50.5%
- By 2100
- 398,342 · +80.5%
Race, ethnicity, and origin ACS 2023
- Neighborhood character
- Highly diverse neighborhood (Simpson 0.87)
- Race & ethnicity
- Two or more races 41% White 33% Pacific Islander 16% Hispanic / Latino 14% Asian 6%
- Hispanic origin (detail)
- Mexican 1% Puerto Rican 9%
- Common ancestry
- Russian 10% Lithuanian 3% Slovak 3%
- Foreign-born
- 5% · Canada
- Languages at home
- 80% English-only · Other Asian/Pacific 7% Spanish 1% German/W. Germanic 1%
Political lean MEDSL · Hawaii
- 2024 margin
- Strong D (+28.3) · D 63.0% · R 34.7% · Other 2.3%
- 2008→2024 swing
- -25.4pp toward R · 2008: 53.7pp · 2024: 28.3pp
- All cycles
- 2024: D+28.3 2020: D+36.2 2016: D+36.6 2012: D+51.3 2008: D+53.7
Not yet ingested
- Civics
- —
Market trends
- HPI YoY
- ▲ 0.74%
- Current HPI
- 169.8292
- Rent YoY
- —
- Metro
- —
- State GDP YoY
- —
- F500 in state
- 0
Price history
+2007.1% since first listed17 events — show timeline
- 2025-11-05 Listed $295,000 HI Information Service
- 2025-06-29 Listing Removed — HI Information Service
- 2024-07-01 Listed $325,000 HI Information Service
- 2023-10-04 Listing Removed — HI Information Service
- 2023-04-11 Listed $325,000 HI Information Service
- 2019-07-05 Sold (MLS) $60,000 HI Information Service
- 2019-06-05 Contingent — HI Information Service
- 2019-05-27 Listed $60,000 HI Information Service
- 2018-12-20 Sold (MLS) $52,000 HI Information Service
- 2018-12-02 Contingent — HI Information Service
- 2018-11-30 Relisted — HI Information Service
- 2018-11-25 Contingent — HI Information Service
- 2018-11-16 Relisted — HI Information Service
- 2018-10-25 Listing Removed — HI Information Service
- 2018-10-17 Listed $50,000 HI Information Service
- 2012-12-14 Sold (MLS) $13,000 HI Information Service
- 2012-09-18 Listed $14,000 HI Information Service
Cash-flow waterfall
monthlySold comps — $/sqft
last 12 mo · ≤1 miLoading sold comps…