98 Newbury Unit 2B · Danvers, MA
Flood risk 1/10 · Minimal
- FEMA flood zone
- X (unshaded)
- Chance of flooding over 30 yrs
- 0.0%
- Est. flood insurance / yr
- $473 – $860
Fire risk 2/10 · Minimal
- Est. fire insurance / yr
- $915 – $1,699
Heat risk 5/10 · Moderate
- Hot days now (above 97°F)
- 7 days/yr
- Hot days in 30 yrs
- 15 days/yr
Wind risk 6/10 · Moderate
- Chance of severe wind over 30 yrs
- 64.0%
Air-quality risk 3/10 · Minor
- Unhealthy air days now
- 3 days/yr
- Unhealthy air days in 30 yrs
- 3 days/yr
Risk factors via First Street. Map © Google.
Why this score? — see what drove the D+ grade
The composite is a weighted blend of 9 inputs, each scored 0–100. Each bar is that input's sub-score; the figure is the points it added to the 100-point composite (weight × sub-score).
- Cash flow +21.8/30.0
- DSCR +6.9/10.0
- 1% rule +5.7/10.0
- Schools +4.1/10.0
- Condition / age +4.0/5.0
- Livability +3.7/5.0
- Rent growth +2.4/5.0
- ARV discount +0.0/15.0
- Appreciation +0.0/10.0
$205,000
🖨 Deal sheet 📄 Offer letter ✓ Due diligence
Listing remarks MLS
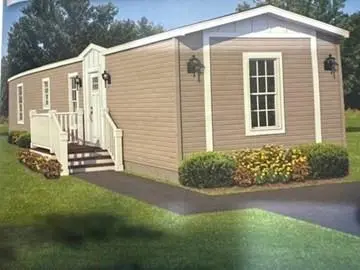
ABSOLUTELY BEAUTIFUL AND AVAIILABLE SOON BRAND NEW MANUFUACTURED HOME LOCATED IN DESIRABLE DANVERS MOBILE PARK . TOP QUALITY AND CONVENENT . NEW LARGE SCREEN TV IN LIVING ROOMM INCLUDED.. LOTS OF QUALITY FEATURES AND UPGRADES THROUOUT. PIGGY BANK LAUNDRY ,2 CAR PARKING PROPANE HEAT NICE YARD, . AFFORDABLE LUXURY. CLOSE TO EVERYTHING. PARK RENT ONLY 460 A MONTH INCLUDES TAXES, WATER AND SEWER, RVBBISH REMOVAL, SNOW PLOWING AND COMON AREA MAINTENANCE.... 2026 TITAN ASCEND MODEL BASE HOME 48X14 MUST BE SEEN SOME PHOTOS ARE NOT OF THE ACTUAL UNIT...FINANCING AVAILABLE
Key facts
- 2 car parking
- Propane heat
- Nice yard
Tags
Neighborhood map
What this means for you Summary
Snapshot
- This is a 1-bed/1.0-bath manufactured listed at $205k. Condition is rated good.
Deal economics
- At list price, monthly cash flow is $317 ($4k/yr) — positive.
- The deal already cash-flows at list — no discount required.
- Meets the 1% rule at list price ($2k rent vs $205k).
- Recommended offer: $193k (6.0% below list) — sets the bar for market timing.
- Cap rate 8.1% vs local median 3.0% in Danvers — top-decile yield for the area; either an underpriced asset or a hidden risk that comps aren't pricing in. Stress-test before assuming the spread holds.
Location & tenants
- Location reads 74/100 on livability (#84 in MA, #4,339 nationally) — a middle-class / working-renter tenant base. Strengths: employment A+, housing A+, health & safety A+; Watch: commute C-, amenities F, cost of living F.
- Danvers (suburban): math 38% / reading 51% proficiency, ranked #157 of 302 in MA (top 52%) — families likely to look elsewhere, expect single-tenant / working-renter base with shorter leases; only 17% free/reduced lunch — higher-income household profile.
- Market conditions: Rents soft (-0.6%/yr); 22 active listings in the ZIP; 1 comparable units currently listed for rent nearby; high-income renter base; 1,032 units permitted in Essex County in 2024 (590 in 5+ unit buildings).
Forward outlook
- Local home prices are declining (-3.0%/yr); year-one equity from $1k of loan paydown is wiped out by about $6k of value loss. Plan a longer hold.
- Essex County population projected at +15% by 2050 — long-run rental-demand tailwind backs the buy-and-hold thesis.
Negotiation context
- It's been on market 64 days — a 6% lower offer ($193k) is reasonable based on typical stale-listing flexibility.
Risks & watch-outs
- Climate carrying-cost: major wind risk, 64% chance of damaging wind over 30y; extreme-heat days projected 7→15/yr by 2055 (HVAC capex compounding) — expect insurance premiums to compound above CPI over the hold.
Questions for the listing agent
- It's been on market 64 days. Have you received any prior offers? Is the seller open to a 6% concession, seller financing, or rate buy-down credit?
- Why hasn't it sold? Are there any deal-killer items the seller is aware of (foundation, flood, title, zoning, code violations)?
- Is there a deadline driving the sale (1031 exchange, divorce, estate, relocation)? That informs how much negotiation room exists.
- Schools are B-rated — typically a magnet for longer-tenancy family renters. What's the average tenant stay here, and is there a school-zone premium baked into asking?
- The area grade is low — what's the realistic commute time and amenity access for the typical tenant pool here? Any planned neighborhood developments (good or bad) we should know about?
- What's the average days-on-market for RENTAL listings here right now (not sales)? A rising rental-DOM trend means longer vacancies and softer asking-rent achievability than the comps imply.
- What's the recent tenant-quality profile in this submarket — average credit score on applications, eviction rate, late-payment / NSF rate, and stable-employment percentage? A property-management company in the area should have these aggregated.
- How much new for-sale + rental construction is in the pipeline within 1–3 miles? Heavy new supply typically softens prices + rents 12–24 months out; constrained supply supports both.
Investment metrics
- 1% rule
- 1.07% ✓
- Cap rate
- 8.15%
- Cash-on-cash
- 6.63%
- DSCR
- 1.29
- GRM
- 7.8
CMA / ARV
- ARV (median comp)
- $157,872
- List price
- $205,000
- Delta
- 29.85%
- Verdict
- OVERPRICED
- Comps
- 10 within 1.0 mi
Show comp detail 5 sales within ~0.75 mi
| Address | Dist | Beds/Ba | Sqft | Sold | Price | $/sf | Match |
|---|---|---|---|---|---|---|---|
| 98 Newbury Unit 4A | 0.00mi | 1/1.0 | 600 (0%) | 10mo | $180,000 | $300 | 92 |
| 103 Newbury #11 | 0.08mi | 1/1.0 | 600 (0%) | 17mo | $170,000 | $283 | 82 |
| 103 Newbury #37 | 0.08mi | 1/1.0 | 600 (0%) | 19mo | $175,000 | $292 | 80 |
| 103 Newbury #20 | 0.08mi | 1/1.0 | 600 (0%) | 23mo | $159,900 | $267 | 77 |
| 98 Newbury Unit 30A | 0.00mi | 1/1.0 | 670 (+12%) | 11mo | $40,000 | $60 | 72 |
Match score weights: distance 35% · size 25% · config 20% · recency 20%. Top-matched comps best support the ARV.
Projected returns pro-forma
-3.0% appreciation · 0.0% rent growth · sell at horizon
- IRR
- -9.5%
- Equity multiple
- 0.66×
- Total profit
- $-19,420
- Equity at exit
- $30,566
- IRR
- -4.8%
- Equity multiple
- 0.73×
- Total profit
- $-15,624
- Equity at exit
- $17,725
Cash invested: $57,400 (down + closing). Projections, not guarantees.
Landlord ↔ Tenant lean methodology
- Overall (STATE)
- 20 Strongly Tenant-Friendly
- State Massachusetts
- 20 Strongly Tenant-Friendly · D+15
- County
- — inherits STATE
- City
- — inherits STATE
ZIP-level market 01923
- Rents YoY
- -0.6%
- Active inventory
- 22
- Price-to-rent
- 7.8×
Monthly cashflow live
- Estimated rent
- $2,195 medium interval (Pro) →
- Mortgage (P&I)
- −$1,075
- Tax est. 1.5%
- −$256 /mo · $3,075/yr
- Insurance
- −$85
- HOA
- −$0
- Vacancy / Maint / Mgmt
- −$461
- Net cashflow
- $317
Break-even live
UW: 25.0% down · 7.5% · 30yr · 1.5% tax · 5.0% vac · 8.0% maint · 8.0% mgmt
Financing live
Cash to close
- Down payment
- $51,250
- Closing costs
- $6,150
- Reserves months
- —
- Total cash needed
- —
Loan-product check · same deal, 3 products live
Conventional
25% down · 7.5% · 30yr
- Down + closing
- —
- Monthly P&I
- —
- Monthly cashflow
- —
- DSCR
- —
- Eligible?
- —
Personal DTI + credit; lowest rate.
DSCR
20% down · 8.5% · 30yr
- Down + closing
- —
- Monthly P&I
- —
- Monthly cashflow
- —
- DSCR
- —
- Eligible?
- —
No personal income docs; deal must DSCR.
Hard money
10% down · 12.0% · 12mo
- Down + closing
- —
- Monthly P&I
- —
- Monthly cashflow
- —
- DSCR
- —
- Eligible?
- —
Short-term bridge; refi at stabilization.
Rent comps 1 comps
| Address | Beds | Baths | Sqft | Rent | $/sqft | DOM | Units | Dist |
|---|---|---|---|---|---|---|---|---|
| 1000 Crane Brook Way Peabody, MA | 1.0–3.0 | 1.0–2.0 | 1137 | $2,364 | $2.08 | 1d | 24 | 0.73mi |
Listing history 14 events
-
2026-06-18days on market $205,000 Active 64 DOM
-
2026-06-17days on market $205,000 Active 63 DOM
-
2026-06-16days on market $205,000 Active 62 DOM
-
2026-06-15days on market $205,000 Active 61 DOM
-
2026-06-13days on market $205,000 Active 59 DOM
-
2026-06-09days on market $205,000 Active 55 DOM
-
2026-06-08days on market $205,000 Active 54 DOM
-
2026-06-07days on market $205,000 Active 53 DOM
-
2026-06-04days on market $205,000 Active 50 DOM
-
2026-06-03days on market $205,000 Active 49 DOM
-
2026-06-02days on market $205,000 Active 48 DOM
-
2026-06-01days on market $205,000 Active 47 DOM
-
2026-05-31days on market $205,000 Active 46 DOM
-
2026-04-14$205,000 New 594-char remark
Show marketing remark (594 chars)
ABSOLUTELY BEAUTIFUL AND AVAIILABLE SOON BRAND NEW MANUFUACTURED HOME LOCATED IN DESIRABLE DANVERS MOBILE PARK . TOP QUALITY AND CONVENENT . NEW LARGE SCREEN TV IN LIVING ROOMM INCLUDED.. LOTS OF QUALITY FEATURES AND UPGRADES THROUOUT. PIGGY BANK LAUNDRY ,2 CAR PARKING PROPANE HEAT NICE YARD, . AFFORDABLE LUXURY. CLOSE TO EVERYTHING. PARK RENT ONLY 460 A MONTH INCLUDES TAXES, WATER AND SEWER, RVBBISH REMOVAL, SNOW PLOWING AND COMON AREA MAINTENANCE.... 2026 TITAN ASCEND MODEL BASE HOME 48X14 MUST BE SEEN SOME PHOTOS ARE NOT OF THE ACTUAL UNIT...FINANCING AVAILABLE
ⓘ Source: listings_history table (triggers on properties + properties_extension) + one-shot
backfill from property_details.listing_events for pre-trigger history.
Climate risk First Street
- Flood 1/10 Low FEMA zone X (unshaded) · 0% chance over 30 yrs
- Wildfire 2/10 Low
- Heat 5/10 Major 7 d/yr ≥97°F today · 15 d/yr by 30 yrs out
- Wind 6/10 Major 64% chance of damaging wind over 30 yrs
- Air quality 3/10 Moderate 3 unhealthy d/yr today · 3 by 30 yrs out
Nearby sold comps map
Loading sold comps map…
Walkable amenities ~0.75 mi
Loading nearby amenities…
Taxation est. · year 1
- Rental income
- $26,337
- − Mortgage interest
- −$11,483
- − Property taxes
- −$3,075
- − Insurance
- −$1,025
- − Repairs & maintenance
- −$2,107
- − Management
- −$2,107
- − Depreciation
- −$5,964
- Taxable income
- $576
- Est. tax owed @ 24.0%
- −$138
- After-tax cash flow
- $3,667/yr
For passive investors: Depreciation is non-cash, so a rental often shows a tax loss while cash-flowing — sheltering income. Rental losses are passive: they offset passive income freely, and up to $25,000/yr can offset ordinary (W-2) income if you actively participate and your MAGI is under $100k (phasing out to $0 by $150k); unused losses carry forward. On sale, claimed depreciation is recaptured at up to 25%, and gains may owe capital-gains tax (a 1031 exchange can defer both). Figures are a year-1 estimate at your 24.0% rate — not tax advice; consult a CPA.
Condition & rehab AI · 12 photos
This manufactured home is in excellent condition with modern updates and a well-maintained exterior. It is move-in ready and would benefit from minor exterior enhancements to further increase its value.
Value-add opportunities
- Both Painting exterior siding — Enhances curb appeal and value.
- Both Landscaping improvements — Enhances curb appeal and value.
- Both Addition of outdoor lighting — Enhances safety and curb appeal.
Renovation cost estimate screening
Value-add ROI direction
- Both Painting exterior siding — Enhances curb appeal and value. ↑
- Both Landscaping improvements — Enhances curb appeal and value. ↑
- Both Addition of outdoor lighting — Enhances safety and curb appeal. ↑
ⓘ Cost ranges are severity-bucket heuristics (US national rule-of-thumb). Get contractor quotes + a written scope before underwriting a rehab budget.
Schools (NCES district)
- District
- Danvers
- NCES district ID
- 2503990
- Math proficiency
- 38% ▼ -10.00%
- Reading proficiency
- 51% ▼ -1.00%
- Median HH income
- $77,753
- Composite
- 40.83/100
- National rank
- #3631
- State rank
- #157 of 302 in MA
Livability — Danvers
- Score
- 74/100
- State rank
- #84
- US rank
- #4339
Category grades
Schools grade is shown separately in the Schools card above.
Census & demographics
- Census place
- Danvers, MA
- County
- Essex County · 632,995 people
- City population
- 27,991
- Metro
- Boston-Cambridge-Newton, MA-NH
- Population (ZIP)
- 27,991
- Household income
- $125,395
- Rent vs Own
- Severe rent burden
- 719.0
Population outlook (Essex County) Hauer SSP2
- Today (2025)
- 840,920 people
- By 2030
- 872,201 · +3.7%
- By 2040
- 927,918 · +10.3%
- By 2050
- 970,206 · +15.4%
- By 2075
- 1,077,993 · +28.2%
- By 2100
- 1,103,053 · +31.2%
Race, ethnicity, and origin ACS 2023
- Neighborhood character
- Predominantly White (88%)
- Race & ethnicity
- White 88% Hispanic / Latino 5% Two or more races 3% Black 3% Asian 2%
- Common ancestry
- Lithuanian 6% Romanian 3% Serbian 2%
- Foreign-born
- 9% · Canada, Jamaica, China
- Languages at home
- 89% English-only · Other Indo-European 4% Spanish 3% French/Haitian/Cajun 1%
Political lean MEDSL · Essex
- 2024 margin
- Strong D (+20.3) · D 59.2% · R 38.9% · Other 1.9%
- 2008→2024 swing
- 0.0pp no change · 2008: 20.3pp · 2024: 20.3pp
- All cycles
- 2024: D+20.3 2020: D+29.1 2016: D+22.5 2012: D+16.2 2008: D+20.3
Not yet ingested
- Civics
- —
Market trends
- HPI YoY
- ▼ -418.87%
- Current HPI
- 280.6942
- Rent YoY
- ▼ -0.57%
- Metro
- Boston-Cambridge-Newton, MA-NH
- State GDP YoY
- ▲ 2.28%
- F500 in state
- 38
Industry mix (Fortune 500 HQ in MA)
| Industry | F500 HQs | Revenue |
|---|---|---|
| Technology | 3 | $17B |
|
||
| Insurance | 2 | $84B |
|
||
| Retail | 2 | $76B |
|
||
| Life Sciences | 1 | $43B |
|
||
| Energy Technology | 1 | $31B |
|
||
| Aerospace / Defense | 1 | $18B |
|
||
Price history
1 event — show timeline
- 2026-04-14 Listed $205,000 MLS PIN
Cash-flow waterfall
monthlySold comps — $/sqft
last 12 mo · ≤1 miLoading sold comps…