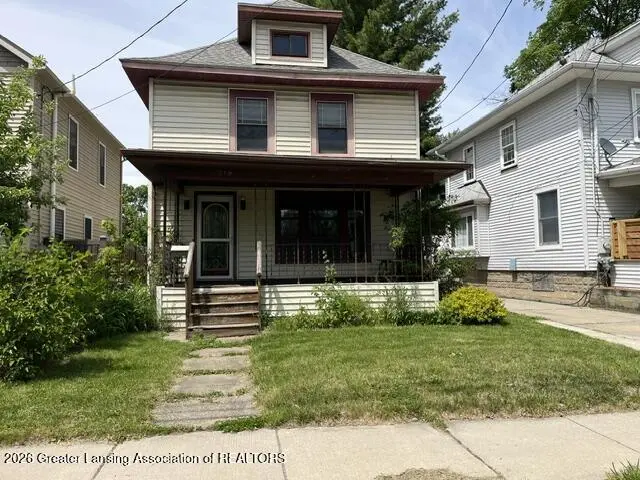
219 E Mount Hope Ave · Lansing, MI
Flood risk 1/10 · Minimal
- FEMA flood zone
- X (unshaded)
- Chance of flooding over 30 yrs
- 0.0%
- Est. flood insurance / yr
- $473 – $860
Fire risk 1/10 · Minimal
- Est. fire insurance / yr
- $784 – $1,456
Heat risk 3/10 · Minor
- Hot days now (above 96°F)
- 7 days/yr
- Hot days in 30 yrs
- 16 days/yr
Wind risk 2/10 · Minimal
- Chance of severe wind over 30 yrs
- —
Air-quality risk 2/10 · Minimal
- Unhealthy air days now
- 1 days/yr
- Unhealthy air days in 30 yrs
- 2 days/yr
Risk factors via First Street. Map © Google.
Why this score? — see what drove the C grade
The composite is a weighted blend of 9 inputs, each scored 0–100. Each bar is that input's sub-score; the figure is the points it added to the 100-point composite (weight × sub-score).
- Cash flow +24.5/30.0
- ARV discount +8.4/15.0
- DSCR +7.9/10.0
- 1% rule +7.1/10.0
- Livability +4.0/5.0
- Rent growth +3.7/5.0
- Condition / age +2.5/5.0
- Schools +1.9/10.0
- Appreciation +0.0/10.0
$149,900
🖨 Deal sheet 📄 Offer letter ✓ Due diligence
Listing remarks MLS
Welcome to 219 E Mt Hope, Laning Mi. Close to new Walter French building, highways, downtown and more. This large 4-bedroom home is full of character and charm. There is beautiful molding, trim, doors with lead glass, floors and more. This home has a gorgeous built-in buffet, original wood banister and beams. There is a formal dining room and an office on the first floor. Updated kitchen is complete with all stainless-steel appliances. There is a full bath and washer/dryer on the main floor. Off the kitchen is a huge deck and nice back yard is fenced and full of perennials. There is a separate back entrance to the basement that has lots of great storage. There is also parking in the rear off the alley. There is also a nice, covered porch for relaxing. This home is absolutely beautiful. The second floor has 3-4 additional bedrooms and a full bath. Home currently has a rental license. This home is full of updates. Plus, central air for hot nights. Parking in the alley out back or across the street in Walter French parking lot for showings.
Key facts
- Built-in buffet
- Formal dining room
- Updated kitchen
Tags
Property features AI
Finance
- HOA & community: Community amenities include curbs, sidewalks, street lights, park, playground and fishing
Exterior
- Parking: Driveway parking; No attached garage
- Utilities: 100 Amp electric service; Public sewer
- Home design: Two and one-half story home; Built in 1916; Updated/remodeled condition
- Construction: Vinyl siding exterior; Block foundation; Shingle roof
- Exterior features: Covered front and rear porches; Deck; Private yard; Exterior lighting; Split rail and wood fencing in the backyard; Landscaped front and back yards; Near public transit; City street frontage; Curbs, sidewalks and street lights; Nearby park, playground and fishing
Interior
- Kitchen: Dishwasher; Microwave; Refrigerator; Granite counters
- Bedrooms: 4 bedrooms (including a primary bedroom); Office space that can serve as an additional room
- Flooring: Carpet; Hardwood
- Bathrooms: 2 full bathrooms
- Heating & cooling: Forced air heating; Central air conditioning
- Interior features: Ceiling fans; Double closets; Granite counters; Natural woodwork; Primary bedroom on the main level; Updated/remodeled interior
- Laundry & utility: Washer; Dryer; Main-level laundry room; Multiple laundry locations
Neighborhood map
What this means for you Summary
Snapshot
- This is a 5-bed/1.5-bath single-family listed at $150k.
Deal economics
- At list price, monthly cash flow is $307 ($4k/yr) — positive.
- The deal already cash-flows at list — no discount required.
- Meets the 1% rule at list price ($2k rent vs $150k).
- Recommended offer: $148k (1.5% below list) — sets the bar for market timing.
- Cap rate 8.7% vs local median 6.0% in Lansing — top-decile yield for the area; either an underpriced asset or a hidden risk that comps aren't pricing in. Stress-test before assuming the spread holds.
Location & tenants
- Location reads 79/100 on livability (#94 in MI, #2,182 nationally) — a middle-class / working-renter tenant base. Strengths: amenities A+, commute A+, cost of living A+; Watch: employment D, schools F, crime F.
- Lansing Public School District (urban): math 14% / reading 23% proficiency, ranked #650 of 760 in MI (top 86%) — low school quality limits family demand, transient renter base, plan for 1-2y turnover; 68% free/reduced lunch — lower-income household profile, screen leases tightly.
- Market conditions: Rents rising fast (+4.7%/yr); 177 active listings in the ZIP; 350 units permitted in Ingham County in 2024 (186 in 5+ unit buildings).
- This rent runs 40% of the median local income ($55k/yr) — at the standard rent-burdened threshold; future hikes will face affordability resistance.
Forward outlook
- Local home prices are declining (-3.0%/yr); year-one equity from $1k of loan paydown is wiped out by about $4k of value loss. Plan a longer hold.
- Ingham County population projected at +11% by 2050 — modest demand growth; plan on rents tracking national, not racing it.
- At projected returns (-3.0% appreciation + 4.7% rent growth), your $42k cash investment doubles in ~10 years — after that, you're playing with house money.
Negotiation context
- It's been on market 16 days — a 2% lower offer ($148k) is reasonable based on typical stale-listing flexibility.
- 5 sale attempts since 9y ago with the ask held roughly flat each time — persistent listings suggest the price (not the market) is what's stuck; bring a comps-based counter.
- Current owner paid $36k; list at $150k implies a 315% gain — meaningful room to come down on a strong offer.
Risks & watch-outs
- Watch-outs: built in 1916 — expect roof / HVAC / electrical / plumbing capex.
Questions for the listing agent
- Built in 1916 — when were the roof, HVAC, electrical panel, plumbing, and water heater last replaced?
- Is there a deadline driving the sale (1031 exchange, divorce, estate, relocation)? That informs how much negotiation room exists.
- Schools are F-rated, which usually means shorter tenancies and higher turnover. Who's the typical renter profile here, and what's been the actual vacancy rate?
- Crime grade is F in this area — have there been break-ins, vandalism, or insurance claims at this property in the last 3 years? What carrier currently insures it and at what premium?
- What's the average days-on-market for RENTAL listings here right now (not sales)? A rising rental-DOM trend means longer vacancies and softer asking-rent achievability than the comps imply.
- What's the recent tenant-quality profile in this submarket — average credit score on applications, eviction rate, late-payment / NSF rate, and stable-employment percentage? A property-management company in the area should have these aggregated.
- How much new for-sale + rental construction is in the pipeline within 1–3 miles? Heavy new supply typically softens prices + rents 12–24 months out; constrained supply supports both.
Investment metrics
- 1% rule
- 1.21% ✓
- Cap rate
- 8.75%
- Cash-on-cash
- 8.77%
- DSCR
- 1.39
- GRM
- 6.9
CMA / ARV
- ARV (on-the-fly)
- $153,120
- Comps found
- 12
Show comp detail 12 sales within ~0.75 mi
| Address | Dist | Beds/Ba | Sqft | Sold | Price | $/sf | Match |
|---|---|---|---|---|---|---|---|
| 605 Baker St | 0.45mi | 5/2.0 | 1,764 (+0%) | 18mo | $129,000 | $73 | 61 |
| 1711 Osband Ave | 0.51mi | 4/2.0 (-1) | 1,762 (+0%) | 19mo | $152,000 | $86 | 53 |
| 225 Strathmore Rd | 0.50mi | 4/2.0 (-1) | 1,831 (+4%) | 14mo | $170,500 | $93 | 51 |
| 408 Smith Ave | 0.40mi | 4/2.0 (-1) | 1,564 (-11%) | 7mo | $190,000 | $121 | 50 |
| 1823 Bradley Ave | 0.41mi | 4/2.0 (-1) | 1,898 (+8%) | 13mo | $187,000 | $99 | 50 |
| 127 E Mt. Hope Ave | 0.05mi | 4/2.0 (-1) | 1,496 (-15%) | 20mo | $130,000 | $87 | 49 |
| 1134 Platt St | 0.59mi | 4/2.0 (-1) | 1,724 (-2%) | 18mo | $130,000 | $75 | 47 |
| 1706 Maplewood Ave | 0.12mi | 4/2.0 (-1) | 1,496 (-15%) | 20mo | $91,000 | $61 | 46 |
| 2004 Roberts Ln | 0.34mi | 4/1.5 (-1) | 1,512 (-14%) | 14mo | $169,900 | $112 | 44 |
| 819 W Mt Hope Ave | 0.70mi | 4/1.5 (-1) | 1,679 (-5%) | 18mo | $145,000 | $86 | 39 |
| 720 W Mount Hope Ave | 0.63mi | 4/1.5 (-1) | 1,904 (+8%) | 15mo | $179,000 | $94 | 39 |
| 616 Park Blvd | 0.64mi | 4/2.5 (-1) | 1,939 (+10%) | 20mo | $138,000 | $71 | 27 |
Match score weights: distance 35% · size 25% · config 20% · recency 20%. Top-matched comps best support the ARV.
Projected returns pro-forma
-3.0% appreciation · 4.71% rent growth · sell at horizon
- IRR
- -0.9%
- Equity multiple
- 0.96×
- Total profit
- $-1,506
- Equity at exit
- $22,351
- IRR
- 10.6%
- Equity multiple
- 1.90×
- Total profit
- $37,609
- Equity at exit
- $12,961
Cash invested: $41,972 (down + closing). Projections, not guarantees.
Landlord ↔ Tenant lean methodology
- Overall (STATE)
- 62 Landlord-Friendly
- State Michigan
- 62 Landlord-Friendly · EVEN
- County
- — inherits STATE
- City
- — inherits STATE
ZIP-level market 48910
- Rents YoY
- 4.7%
- Active inventory
- 177
- Price-to-rent
- 6.9×
Monthly cashflow live
- Estimated rent
- $1,807 medium interval (Pro) →
- Mortgage (P&I)
- −$786
- Tax from tax record
- −$272 /mo · $3,263/yr
- Insurance
- −$62
- HOA
- −$0
- Vacancy / Maint / Mgmt
- −$379
- Net cashflow
- $307
Break-even live
UW: 25.0% down · 7.5% · 30yr · 1.5% tax · 5.0% vac · 8.0% maint · 8.0% mgmt
Financing live
Cash to close
- Down payment
- $37,475
- Closing costs
- $4,497
- Reserves months
- —
- Total cash needed
- —
Loan-product check · same deal, 3 products live
Conventional
25% down · 7.5% · 30yr
- Down + closing
- —
- Monthly P&I
- —
- Monthly cashflow
- —
- DSCR
- —
- Eligible?
- —
Personal DTI + credit; lowest rate.
DSCR
20% down · 8.5% · 30yr
- Down + closing
- —
- Monthly P&I
- —
- Monthly cashflow
- —
- DSCR
- —
- Eligible?
- —
No personal income docs; deal must DSCR.
Hard money
10% down · 12.0% · 12mo
- Down + closing
- —
- Monthly P&I
- —
- Monthly cashflow
- —
- DSCR
- —
- Eligible?
- —
Short-term bridge; refi at stabilization.
Listing history 16 events
-
2026-06-07statusdays on market $149,900 Pending 16 DOM
-
2026-06-05days on market $149,900 Active Under Contract 15 DOM
-
2026-06-03days on market $149,900 Active Under Contract 14 DOM
-
2026-06-02days on market $149,900 Active Under Contract 13 DOM
-
2026-06-01days on market $149,900 Active Under Contract 12 DOM
-
2026-05-31days on market $149,900 Active Under Contract 11 DOM
-
2026-05-30days on market $149,900 Active Under Contract 10 DOM
-
2026-05-20$149,900 Active
Show marketing remark (1053 chars)
Welcome to 219 E Mt Hope, Laning Mi. Close to new Walter French building, highways, downtown and more. This large 4-bedroom home is full of character and charm. There is beautiful molding, trim, doors with lead glass, floors and more. This home has a gorgeous built-in buffet, original wood banister and beams. There is a formal dining room and an office on the first floor. Updated kitchen is complete with all stainless-steel appliances. There is a full bath and washer/dryer on the main floor. Off the kitchen is a huge deck and nice back yard is fenced and full of perennials. There is a separate back entrance to the basement that has lots of great storage. There is also parking in the rear off the alley. There is also a nice, covered porch for relaxing. This home is absolutely beautiful. The second floor has 3-4 additional bedrooms and a full bath. Home currently has a rental license. This home is full of updates. Plus, central air for hot nights. Parking in the alley out back or across the street in Walter French parking lot for showings.
-
2026-05-20$149,900 Active 1053-char remark
Show marketing remark (1053 chars)
Welcome to 219 E Mt Hope, Laning Mi. Close to new Walter French building, highways, downtown and more. This large 4-bedroom home is full of character and charm. There is beautiful molding, trim, doors with lead glass, floors and more. This home has a gorgeous built-in buffet, original wood banister and beams. There is a formal dining room and an office on the first floor. Updated kitchen is complete with all stainless-steel appliances. There is a full bath and washer/dryer on the main floor. Off the kitchen is a huge deck and nice back yard is fenced and full of perennials. There is a separate back entrance to the basement that has lots of great storage. There is also parking in the rear off the alley. There is also a nice, covered porch for relaxing. This home is absolutely beautiful. The second floor has 3-4 additional bedrooms and a full bath. Home currently has a rental license. This home is full of updates. Plus, central air for hot nights. Parking in the alley out back or across the street in Walter French parking lot for showings.
-
2026-05-17historical $1,750
-
2026-03-28$1,750
-
2018-04-27soldstatus $36,100 237-char remark
Show marketing remark (237 chars)
Step back in time, wonderful home in the city of Lansing. Hardwood floors with beautiful tile inlays in the living room and dining room. 4 bedrooms, 2 bathrooms and an office. Ready for your special touches. This is a Fannie Mae Property
-
2018-04-27soldstatus $36,100
Show marketing remark (237 chars)
Step back in time, wonderful home in the city of Lansing. Hardwood floors with beautiful tile inlays in the living room and dining room. 4 bedrooms, 2 bathrooms and an office. Ready for your special touches. This is a Fannie Mae Property
-
2017-11-22$34,900 237-char remark
Show marketing remark (237 chars)
Step back in time, wonderful home in the city of Lansing. Hardwood floors with beautiful tile inlays in the living room and dining room. 4 bedrooms, 2 bathrooms and an office. Ready for your special touches. This is a Fannie Mae Property
-
2017-11-22$34,900
Show marketing remark (237 chars)
Step back in time, wonderful home in the city of Lansing. Hardwood floors with beautiful tile inlays in the living room and dining room. 4 bedrooms, 2 bathrooms and an office. Ready for your special touches. This is a Fannie Mae Property
-
2000-02-10soldstatus $65,000
ⓘ Source: listings_history table (triggers on properties + properties_extension) + one-shot
backfill from property_details.listing_events for pre-trigger history.
Tax reassessment forecast MI · Partial reset (capped growth)
- Current annual tax
- $3,263 · $272/mo
- Projected year-2 tax
- $3,263 · $272/mo
- Expected delta
- $0/yr ($0/mo · 0.0%)
ⓘ Screening estimate from a state-policy table — verify with the county assessor before closing.
Climate risk First Street
- Flood 1/10 Low FEMA zone X (unshaded) · 0% chance over 30 yrs
- Wildfire 1/10 Low
- Heat 3/10 Moderate 7 d/yr ≥96°F today · 16 d/yr by 30 yrs out
- Wind 2/10 Low
- Air quality 2/10 Low 1 unhealthy d/yr today · 2 by 30 yrs out
Nearby sold comps map
Loading sold comps map…
Walkable amenities ~0.75 mi
Loading nearby amenities…
Taxation est. · year 1
- Rental income
- $21,680
- − Mortgage interest
- −$8,397
- − Property taxes
- −$3,263
- − Insurance
- −$750
- − Repairs & maintenance
- −$1,734
- − Management
- −$1,734
- − Depreciation
- −$4,361
- Taxable income
- $1,442
- Est. tax owed @ 24.0%
- −$346
- After-tax cash flow
- $3,336/yr
For passive investors: Depreciation is non-cash, so a rental often shows a tax loss while cash-flowing — sheltering income. Rental losses are passive: they offset passive income freely, and up to $25,000/yr can offset ordinary (W-2) income if you actively participate and your MAGI is under $100k (phasing out to $0 by $150k); unused losses carry forward. On sale, claimed depreciation is recaptured at up to 25%, and gains may owe capital-gains tax (a 1031 exchange can defer both). Figures are a year-1 estimate at your 24.0% rate — not tax advice; consult a CPA.
Schools (NCES district)
- District
- Lansing Public School District
- NCES district ID
- 2621150
- Math proficiency
- 14% ▲ 1.00%
- Reading proficiency
- 23% ▲ 3.00%
- Median HH income
- $37,453
- Composite
- 18.76/100
- National rank
- #14002
- State rank
- #650 of 760 in MI
Livability — Lansing
- Score
- 79/100
- State rank
- #94
- US rank
- #2182
Category grades
Schools grade is shown separately in the Schools card above.
Census & demographics
- Census place
- Lansing, MI
- County
- Ingham County · 237,052 people
- City population
- 161,269
- Metro
- Lansing-East Lansing, MI
- Population (ZIP)
- 32,800
- Household income
- $54,712
- Rent vs Own
- Severe rent burden
- 1305.0
Population outlook (Ingham County) Hauer SSP2
- Today (2025)
- 300,362 people
- By 2030
- 307,808 · +2.5%
- By 2040
- 320,492 · +6.7%
- By 2050
- 333,223 · +10.9%
- By 2075
- 373,693 · +24.4%
- By 2100
- 392,021 · +30.5%
Race, ethnicity, and origin ACS 2023
- Neighborhood character
- Diverse neighborhood (Simpson 0.62)
- Race & ethnicity
- White 58% Black 16% Hispanic / Latino 12% Two or more races 12% Asian 4% Native American 1%
- Hispanic origin (detail)
- Mexican 9% Cuban 2%
- Common ancestry
- Romanian 5% Lithuanian 3% Slovak 2%
- Foreign-born
- 9% · Canada, China, Vietnam
- Languages at home
- 87% English-only · Spanish 6% Chinese 1% Other Indo-European 1%
Political lean MEDSL · Ingham
- 2024 margin
- Strong D (+29.7) · D 63.9% · R 34.2% · Other 2.0%
- 2008→2024 swing
- -3.6pp toward R · 2008: 33.3pp · 2024: 29.7pp
- All cycles
- 2024: D+29.7 2020: D+32.2 2016: D+27.6 2012: D+27.9 2008: D+33.3
Not yet ingested
- Civics
- —
Market trends
- HPI YoY
- ▼ -211.82%
- Current HPI
- 196.8087
- Rent YoY
- ▲ 4.71%
- Metro
- Lansing-East Lansing, MI
- State GDP YoY
- ▲ 1.37%
- F500 in state
- 28
Industry mix (Fortune 500 HQ in MI)
| Industry | F500 HQs | Revenue |
|---|---|---|
| Automotive Parts | 3 | $48B |
|
||
| Automotive | 2 | $372B |
|
||
| Chemicals | 1 | $45B |
|
||
| Automotive Retail | 1 | $29B |
|
||
| Healthcare / Medical Devices | 1 | $23B |
|
||
| Automotive Technology | 1 | $20B |
|
||
Price history
+130.6% since first listed9 events — show timeline
- 2026-05-20 Listed $149,900 REALCOMP
- 2026-05-20 Listed $149,900 Greater Lansing AoR
- 2026-05-17 Rental Removed $1,750 Avail
- 2026-03-28 Listed for Rent $1,750 Avail
- 2018-04-27 Sold (MLS) $36,100 Greater Lansing AoR
- 2018-04-27 Sold (MLS) $36,100 REALCOMP
- 2017-11-22 Listed $34,900 Greater Lansing AoR
- 2017-11-22 Listed $34,900 REALCOMP
- 2000-02-10 Sold (Public Records) $65,000 Public Records
Property tax history
+6.9%/yrLatest (2025): $3,263 · +3.0% YoY. Source: county tax records.
Cash-flow waterfall
monthlySold comps — $/sqft
last 12 mo · ≤1 miLoading sold comps…