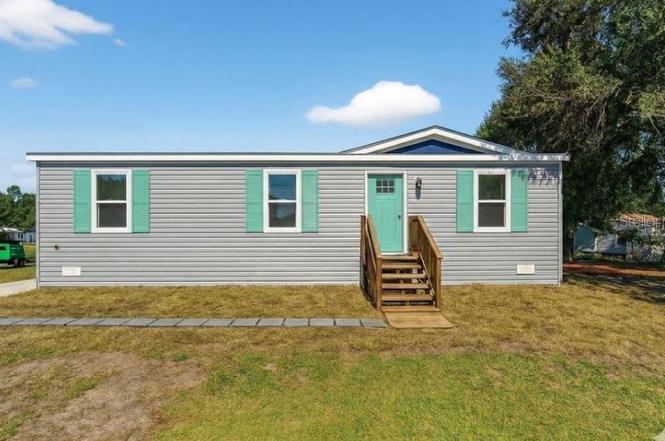
24116 Armadillo Rd · Astor, FL
Flood risk 1/10 · Minimal
- FEMA flood zone
- X (unshaded)
- Chance of flooding over 30 yrs
- 0.0%
- Est. flood insurance / yr
- $507 – $1,088
Fire risk 3/10 · Minor
- Est. fire insurance / yr
- $947 – $1,759
Heat risk 9/10 · Severe
- Hot days now (above 107°F)
- 7 days/yr
- Hot days in 30 yrs
- 22 days/yr
Wind risk 9/10 · Severe
- Chance of severe wind over 30 yrs
- 99.0%
Air-quality risk 3/10 · Minor
- Unhealthy air days now
- 2 days/yr
- Unhealthy air days in 30 yrs
- 3 days/yr
Risk factors via First Street. Map © Google.
Why this score? — see what drove the B grade
The composite is a weighted blend of 9 inputs, each scored 0–100. Each bar is that input's sub-score; the figure is the points it added to the 100-point composite (weight × sub-score).
- Cash flow +25.6/30.0
- ARV discount +15.0/15.0
- DSCR +8.5/10.0
- 1% rule +6.7/10.0
- Appreciation +6.0/10.0
- Schools +4.2/10.0
- Livability +3.3/5.0
- Rent growth +2.5/5.0
- Condition / age +2.5/5.0
$199,891
🖨 Deal sheet 📄 Offer letter ✓ Due diligence
Listing remarks
HIGHEST AND BEST. Own your own land with city sewer and city water! Experience the perfect blend of modern living and natural beauty with this BRAND-NEW manufactured home, situated on a lot that you own! Offering 3 bedrooms, 2 bathrooms, and over 1,400 square feet of thoughtfully designed living space. From the moment you arrive, you'll be charmed by the recessed dormer over the front door with vertical vinyl accent, and vinyl door and window trim. Step inside and immediately appreciate the high-quality finishes and attention to detail, from the 4-panel board and batten accent wall or the luxury linoleum flooring throughout, to the open- concept layout that effortlessly connects the living,
Key facts
- Owned lot
- Vinyl window trim
- City water
Tags
Property features AI
Finance
- Other: Home warranty included; Unfurnished; Living area approximately 1,440 square feet; Lot about 0.19 acres (75 x 110); Insulation, efficient lighting, and efficient windows noted (green energy features)
- HOA & community: No association; Pets allowed
Exterior
- Utilities: Public water; Public sewer; Broadband/high-speed internet available; Cable available
- Home design: Manufactured double wide home; Single-story; North-facing; Projected completion October 30, 2025; Completed condition; Make: Cavco Select, Model: 340CK30483A
- Construction: Vinyl siding; Shingle roof; Block foundation with crawlspace; New construction
- Exterior features: Private mailbox; Asphalt road access
Interior
- Kitchen: Dishwasher; Range; Range hood; Refrigerator
- Bedrooms: 3 bedrooms
- Flooring: Linoleum
- Bathrooms: 2 full bathrooms
- Heating & cooling: Central heating (electric, heat pump); Central air conditioning
- Interior features: Eat-in kitchen; Living room / dining room combo; Open floorplan; Thermostat; Walk-in closet(s); Blinds; Smoke detector(s)
- Laundry & utility: Inside laundry room; Electric water heater
Neighborhood map
What this means for you Summary
Snapshot
- This is a 3-bed/2.0-bath manufactured listed at $200k.
Deal economics
- At list price, monthly cash flow is $470 ($6k/yr) — positive.
- The deal already cash-flows at list — no discount required.
- Meets the 1% rule at list price ($2k rent vs $200k).
- Recommended offer: $176k (12.0% below list) — sets the bar for market timing.
Location & tenants
- Location reads 66/100 on livability (#613 in FL) — a middle-class / working-renter tenant base. Strengths: crime A+, cost of living A+, housing A+; Watch: amenities F, commute F, health & safety D-.
- Lake (suburban): math 49% / reading 50% proficiency, ranked #37 of 73 in FL (top 51%) — families likely to look elsewhere, expect single-tenant / working-renter base with shorter leases.
- Zoned schools: Umatilla Elementary School (math 59% / reading 56%, grade C+, #764 of 2,144 statewide, top 36%, 660 students, 55% FRL); Umatilla High School (math 24% / reading 29%, grade F, #489 of 667 statewide, top 74%, 861 students, 51% FRL) — zoned schools at 53% FRL track the district average.
- Market conditions: 77 active listings in the ZIP; 2 comparable units currently listed for rent nearby; 4,799 units permitted in Lake County in 2024 (814 in 5+ unit buildings).
Forward outlook
- In year one you build about $5k of equity ($1k loan paydown + $4k appreciation (1.9% local appreciation)).
- Lake County population projected at +37% by 2050 — long-run rental-demand tailwind backs the buy-and-hold thesis.
- At projected returns (1.9% appreciation + 3.0% rent growth), your $56k cash investment doubles in ~5 years — after that, you're playing with house money.
- By year 7, paydown + projected appreciation supports a ~$34k cash-out refi (75% LTV) — recoverable capital for the next deal without selling this one.
Negotiation context
- It's been on market 261 days — a 12% lower offer ($176k) is reasonable based on typical stale-listing flexibility.
Risks & watch-outs
- Climate carrying-cost: severe wind risk, 99% chance of damaging wind over 30y; extreme-heat days projected 7→22/yr by 2055 (HVAC capex compounding) — expect insurance premiums to compound above CPI over the hold.
Questions for the listing agent
- It's been on market 261 days. Have you received any prior offers? Is the seller open to a 12% concession, seller financing, or rate buy-down credit?
- Why hasn't it sold? Are there any deal-killer items the seller is aware of (foundation, flood, title, zoning, code violations)?
- Is there a deadline driving the sale (1031 exchange, divorce, estate, relocation)? That informs how much negotiation room exists.
- Schools are F-rated, which usually means shorter tenancies and higher turnover. Who's the typical renter profile here, and what's been the actual vacancy rate?
- What's the average days-on-market for RENTAL listings here right now (not sales)? A rising rental-DOM trend means longer vacancies and softer asking-rent achievability than the comps imply.
- What's the recent tenant-quality profile in this submarket — average credit score on applications, eviction rate, late-payment / NSF rate, and stable-employment percentage? A property-management company in the area should have these aggregated.
- How much new for-sale + rental construction is in the pipeline within 1–3 miles? Heavy new supply typically softens prices + rents 12–24 months out; constrained supply supports both.
Investment metrics
- 1% rule
- 1.17% ✓
- Cap rate
- 9.12%
- Cash-on-cash
- 10.08%
- DSCR
- 1.45
- GRM
- 7.1
CMA / ARV
- ARV (on-the-fly)
- $250,560
- Comps found
- 3
Show comp detail 3 sales within ~0.75 mi
| Address | Dist | Beds/Ba | Sqft | Sold | Price | $/sf | Match |
|---|---|---|---|---|---|---|---|
| 24045 Fox Rd | 0.27mi | 3/2.0 | 1,394 (-3%) | 6mo | $270,000 | $194 | 77 |
| 23909 Deer Rd | 0.27mi | 3/2.0 | 1,248 (-13%) | 11mo | $201,500 | $161 | 56 |
| 55705 Keith St | 0.52mi | 2/2.5 (-1) | 1,636 (+14%) | 10mo | $285,000 | $174 | 38 |
Match score weights: distance 35% · size 25% · config 20% · recency 20%. Top-matched comps best support the ARV.
Projected returns pro-forma
1.95% appreciation · 3.0% rent growth · sell at horizon
- IRR
- 14.3%
- Equity multiple
- 1.77×
- Total profit
- $43,194
- Equity at exit
- $78,313
- IRR
- 17.0%
- Equity multiple
- 3.25×
- Total profit
- $125,996
- Equity at exit
- $112,367
Cash invested: $55,969 (down + closing). Projections, not guarantees.
Landlord ↔ Tenant lean methodology
- Overall (STATE)
- 87 Strongly Landlord-Friendly
- State Florida
- 87 Strongly Landlord-Friendly · R+3
- County
- — inherits STATE
- City
- — inherits STATE
ZIP-level market 32102
- Home prices YoY
- 0.8%
- Active inventory
- 77
- Price-to-rent
- 7.1×
Monthly cashflow live
- Estimated rent
- $2,344 medium interval (Pro) →
- Mortgage (P&I)
- −$1,048
- Tax est. 1.5%
- −$250 /mo · $2,998/yr
- Insurance
- −$83
- HOA
- −$0
- Vacancy / Maint / Mgmt
- −$492
- Net cashflow
- $470
Break-even live
UW: 25.0% down · 7.5% · 30yr · 1.5% tax · 5.0% vac · 8.0% maint · 8.0% mgmt
Financing live
Cash to close
- Down payment
- $49,973
- Closing costs
- $5,997
- Reserves months
- —
- Total cash needed
- —
Loan-product check · same deal, 3 products live
Conventional
25% down · 7.5% · 30yr
- Down + closing
- —
- Monthly P&I
- —
- Monthly cashflow
- —
- DSCR
- —
- Eligible?
- —
Personal DTI + credit; lowest rate.
DSCR
20% down · 8.5% · 30yr
- Down + closing
- —
- Monthly P&I
- —
- Monthly cashflow
- —
- DSCR
- —
- Eligible?
- —
No personal income docs; deal must DSCR.
Hard money
10% down · 12.0% · 12mo
- Down + closing
- —
- Monthly P&I
- —
- Monthly cashflow
- —
- DSCR
- —
- Eligible?
- —
Short-term bridge; refi at stabilization.
Rent comps 2 comps
| Address | Beds | Baths | Sqft | Rent | $/sqft | DOM | Units | Dist |
|---|---|---|---|---|---|---|---|---|
| 55624 Sam St Astor, FL | 2.0 | 2.0 | 1792 | $2,225 | $1.24 | 10d | 1 | 0.50mi |
| 56314 Blue Creek Rd Astor, FL | 3.0 | 2.0 | 1248 | $2,500 | $2.00 | 17d | 1 | 0.71mi |
Listing history 50 events
-
2026-06-19price $199,891 Active 261 DOM
-
2026-06-18days on market $199,892 Active 261 DOM
-
2026-06-17price $199,892 Active 260 DOM
-
2026-06-17days on market $199,893 Active 260 DOM
-
2026-06-16days on market $199,893 Active 259 DOM
-
2026-06-15price $199,893 Active 258 DOM
-
2026-06-15pricedays on market $199,894 Active 258 DOM
-
2026-06-13pricedays on market $199,994 Active 256 DOM
-
2026-06-10price $199,997 Active 252 DOM
-
2026-06-09days on market $199,998 Active 252 DOM
-
2026-06-08days on market $199,998 Active 251 DOM
-
2026-06-07days on market $199,998 Active 250 DOM
-
2026-06-04days on market $199,998 Active 247 DOM
-
2026-06-03days on market $199,998 Active 246 DOM
-
2026-06-02days on market $199,998 Active 245 DOM
-
2026-06-02days on market $199,998 Active 244 DOM
-
2026-05-31days on market $199,998 Active 243 DOM
-
2026-05-13price $199,999
-
2026-05-12price $243,688
-
2026-05-11price $243,788
-
2026-05-07price $243,888
-
2026-05-06price $243,988
-
2026-05-05price $244,088
-
2026-05-04price $244,188
-
2026-05-01price $244,288
-
2026-04-30price $244,388
-
2026-04-29price $244,488
-
2026-04-28price $244,588
-
2026-04-27price $244,688
-
2026-04-24price $244,788
-
2026-04-23price $244,888
-
2026-04-22price $244,988
-
2026-04-21price $245,088
-
2026-04-20price $245,188
-
2026-04-17price $245,288
-
2026-04-16price $245,388
-
2026-04-14price $245,488
-
2026-04-13price $245,988
-
2026-04-10price $246,488
-
2026-04-09price $246,988
-
2026-04-08price $247,488
-
2026-04-07price $247,988
-
2026-04-06price $248,488
-
2026-04-03price $248,988
-
2026-04-02price $248,989
-
2026-04-01price $248,990
-
2026-03-31price $248,991
-
2026-03-30price $248,992
-
2026-03-27price $248,993
-
2026-03-26price $248,994
ⓘ Source: listings_history table (triggers on properties + properties_extension) + one-shot
backfill from property_details.listing_events for pre-trigger history.
Climate risk First Street
- Flood 1/10 Low FEMA zone X (unshaded) · 0% chance over 30 yrs
- Wildfire 3/10 Moderate
- Heat 9/10 Extreme 7 d/yr ≥107°F today · 22 d/yr by 30 yrs out
- Wind 9/10 Extreme 99% chance of damaging wind over 30 yrs
- Air quality 3/10 Moderate 2 unhealthy d/yr today · 3 by 30 yrs out
Nearby sold comps map
Loading sold comps map…
Walkable amenities ~0.75 mi
Loading nearby amenities…
Taxation est. · year 1
- Rental income
- $28,127
- − Mortgage interest
- −$11,197
- − Property taxes
- −$2,998
- − Insurance
- −$999
- − Repairs & maintenance
- −$2,250
- − Management
- −$2,250
- − Depreciation
- −$5,815
- Taxable income
- $2,616
- Est. tax owed @ 24.0%
- −$628
- After-tax cash flow
- $5,015/yr
For passive investors: Depreciation is non-cash, so a rental often shows a tax loss while cash-flowing — sheltering income. Rental losses are passive: they offset passive income freely, and up to $25,000/yr can offset ordinary (W-2) income if you actively participate and your MAGI is under $100k (phasing out to $0 by $150k); unused losses carry forward. On sale, claimed depreciation is recaptured at up to 25%, and gains may owe capital-gains tax (a 1031 exchange can defer both). Figures are a year-1 estimate at your 24.0% rate — not tax advice; consult a CPA.
Schools (NCES district)
- District
- Lake
- NCES district ID
- 1201050
- Math proficiency
- 49% ▼ -7.00%
- Reading proficiency
- 50% ▼ -4.00%
- Median HH income
- $46,632
- Composite
- 42.05/100
- National rank
- #3327
- State rank
- #37 of 73 in FL
Livability — Astor
- Score
- 66/100
- State rank
- #613
- US rank
- #11822
Category grades
Schools grade is shown separately in the Schools card above.
Census & demographics
- Census place
- Astor, FL
- Population (ZIP)
- 2,401
Population outlook (Lake County) Hauer SSP2
- Today (2025)
- 386,640 people
- By 2030
- 417,107 · +7.9%
- By 2040
- 476,676 · +23.3%
- By 2050
- 531,296 · +37.4%
- By 2075
- 648,303 · +67.7%
- By 2100
- 698,530 · +80.7%
Race, ethnicity, and origin ACS 2023
- Neighborhood character
- Predominantly White (89%)
- Race & ethnicity
- White 89% Two or more races 7% Hispanic / Latino 3%
- Common ancestry
- Lithuanian 9% Portuguese 8% Slovak 2%
- Foreign-born
- 2% · Canada
- Languages at home
- 95% English-only · Spanish 3% German/W. Germanic 1% Russian/Polish/Slavic 1%
Political lean MEDSL · Lake
- 2024 margin
- Strong R (+24.7) · D 37.3% · R 62.0%
- 2008→2024 swing
- -11.2pp toward R · 2008: -13.5pp · 2024: -24.7pp
- All cycles
- 2024: R+24.7 2020: R+20.0 2016: R+23.1 2012: R+17.1 2008: R+13.5
Not yet ingested
- Civics
- —
Market trends
- HPI YoY
- ▲ 1.95%
- Current HPI
- 232.7974
- Rent YoY
- —
- Metro
- —
- State GDP YoY
- ▲ 3.28%
- F500 in state
- 36
Industry mix (Fortune 500 HQ in FL)
| Industry | F500 HQs | Revenue |
|---|---|---|
| Industrial Technology | 2 | $29B |
|
||
| Insurance | 2 | $17B |
|
||
| Retail | 1 | $60B |
|
||
| Technology Distribution | 1 | $58B |
|
||
| Homebuilding | 1 | $35B |
|
||
| Technology Manufacturing | 1 | $35B |
|
||
Price history
-24.5% since first listed84 events — show timeline
- 2026-05-13 Price Changed $199,999 Stellar MLS as Distributed by MLS Grid
- 2026-05-12 Price Changed $243,688 Stellar MLS as Distributed by MLS Grid
- 2026-05-11 Price Changed $243,788 Stellar MLS as Distributed by MLS Grid
- 2026-05-07 Price Changed $243,888 Stellar MLS as Distributed by MLS Grid
- 2026-05-06 Price Changed $243,988 Stellar MLS as Distributed by MLS Grid
- 2026-05-05 Price Changed $244,088 Stellar MLS as Distributed by MLS Grid
- 2026-05-04 Price Changed $244,188 Stellar MLS as Distributed by MLS Grid
- 2026-05-01 Price Changed $244,288 Stellar MLS as Distributed by MLS Grid
- 2026-04-30 Price Changed $244,388 Stellar MLS as Distributed by MLS Grid
- 2026-04-29 Price Changed $244,488 Stellar MLS as Distributed by MLS Grid
- 2026-04-28 Price Changed $244,588 Stellar MLS as Distributed by MLS Grid
- 2026-04-27 Price Changed $244,688 Stellar MLS as Distributed by MLS Grid
- 2026-04-24 Price Changed $244,788 Stellar MLS as Distributed by MLS Grid
- 2026-04-23 Price Changed $244,888 Stellar MLS as Distributed by MLS Grid
- 2026-04-22 Price Changed $244,988 Stellar MLS as Distributed by MLS Grid
- 2026-04-21 Price Changed $245,088 Stellar MLS as Distributed by MLS Grid
- 2026-04-20 Price Changed $245,188 Stellar MLS as Distributed by MLS Grid
- 2026-04-17 Price Changed $245,288 Stellar MLS as Distributed by MLS Grid
- 2026-04-16 Price Changed $245,388 Stellar MLS as Distributed by MLS Grid
- 2026-04-14 Price Changed $245,488 Stellar MLS as Distributed by MLS Grid
- 2026-04-13 Price Changed $245,988 Stellar MLS as Distributed by MLS Grid
- 2026-04-10 Price Changed $246,488 Stellar MLS as Distributed by MLS Grid
- 2026-04-09 Price Changed $246,988 Stellar MLS as Distributed by MLS Grid
- 2026-04-08 Price Changed $247,488 Stellar MLS as Distributed by MLS Grid
- 2026-04-07 Price Changed $247,988 Stellar MLS as Distributed by MLS Grid
- 2026-04-06 Price Changed $248,488 Stellar MLS as Distributed by MLS Grid
- 2026-04-03 Price Changed $248,988 Stellar MLS as Distributed by MLS Grid
- 2026-04-02 Price Changed $248,989 Stellar MLS as Distributed by MLS Grid
- 2026-04-01 Price Changed $248,990 Stellar MLS as Distributed by MLS Grid
- 2026-03-31 Price Changed $248,991 Stellar MLS as Distributed by MLS Grid
- 2026-03-30 Price Changed $248,992 Stellar MLS as Distributed by MLS Grid
- 2026-03-27 Price Changed $248,993 Stellar MLS as Distributed by MLS Grid
- 2026-03-26 Price Changed $248,994 Stellar MLS as Distributed by MLS Grid
- 2026-03-25 Price Changed $248,995 Stellar MLS as Distributed by MLS Grid
- 2026-03-24 Price Changed $248,996 Stellar MLS as Distributed by MLS Grid
- 2026-03-23 Price Changed $248,997 Stellar MLS as Distributed by MLS Grid
- 2026-03-20 Price Changed $248,998 Stellar MLS as Distributed by MLS Grid
- 2026-03-19 Price Changed $248,999 Stellar MLS as Distributed by MLS Grid
- 2026-03-18 Price Changed $249,000 Stellar MLS as Distributed by MLS Grid
- 2026-03-16 Price Changed $249,781 Stellar MLS as Distributed by MLS Grid
- 2026-03-13 Price Changed $250,281 Stellar MLS as Distributed by MLS Grid
- 2026-03-12 Price Changed $250,781 Stellar MLS as Distributed by MLS Grid
- 2026-03-11 Price Changed $251,281 Stellar MLS as Distributed by MLS Grid
- 2026-03-10 Price Changed $251,781 Stellar MLS as Distributed by MLS Grid
- 2026-03-09 Price Changed $252,281 Stellar MLS as Distributed by MLS Grid
- 2026-03-07 Price Changed $252,780 Stellar MLS as Distributed by MLS Grid
- 2026-03-06 Price Changed $252,781 Stellar MLS as Distributed by MLS Grid
- 2026-03-05 Price Changed $253,281 Stellar MLS as Distributed by MLS Grid
- 2026-03-04 Price Changed $253,781 Stellar MLS as Distributed by MLS Grid
- 2026-03-03 Price Changed $254,281 Stellar MLS as Distributed by MLS Grid
- 2026-03-02 Price Changed $254,781 Stellar MLS as Distributed by MLS Grid
- 2026-02-27 Price Changed $255,281 Stellar MLS as Distributed by MLS Grid
- 2026-02-26 Price Changed $255,282 Stellar MLS as Distributed by MLS Grid
- 2026-02-25 Price Changed $255,283 Stellar MLS as Distributed by MLS Grid
- 2026-02-24 Price Changed $255,284 Stellar MLS as Distributed by MLS Grid
- 2026-02-23 Price Changed $255,285 Stellar MLS as Distributed by MLS Grid
- 2026-02-22 Price Changed $255,286 Stellar MLS as Distributed by MLS Grid
- 2026-02-20 Price Changed $255,386 Stellar MLS as Distributed by MLS Grid
- 2026-02-19 Price Changed $255,387 Stellar MLS as Distributed by MLS Grid
- 2026-02-18 Price Changed $255,388 Stellar MLS as Distributed by MLS Grid
- 2026-02-17 Price Changed $255,389 Stellar MLS as Distributed by MLS Grid
- 2026-02-16 Price Changed $255,390 Stellar MLS as Distributed by MLS Grid
- 2026-02-14 Price Changed $255,391 Stellar MLS as Distributed by MLS Grid
- 2026-02-13 Price Changed $255,491 Stellar MLS as Distributed by MLS Grid
- 2026-02-12 Price Changed $255,492 Stellar MLS as Distributed by MLS Grid
- 2026-02-11 Price Changed $255,493 Stellar MLS as Distributed by MLS Grid
- 2026-02-10 Price Changed $255,494 Stellar MLS as Distributed by MLS Grid
- 2026-02-09 Price Changed $255,495 Stellar MLS as Distributed by MLS Grid
- 2026-02-07 Price Changed $255,496 Stellar MLS as Distributed by MLS Grid
- 2026-02-06 Price Changed $255,596 Stellar MLS as Distributed by MLS Grid
- 2026-02-05 Price Changed $255,597 Stellar MLS as Distributed by MLS Grid
- 2026-02-04 Price Changed $255,598 Stellar MLS as Distributed by MLS Grid
- 2026-02-03 Price Changed $255,599 Stellar MLS as Distributed by MLS Grid
- 2026-01-30 Price Changed $255,600 Stellar MLS as Distributed by MLS Grid
- 2026-01-25 Price Changed $259,600 Stellar MLS as Distributed by MLS Grid
- 2026-01-09 Price Changed $259,700 Stellar MLS as Distributed by MLS Grid
- 2026-01-04 Price Changed $259,800 Stellar MLS as Distributed by MLS Grid
- 2025-12-18 Price Changed $259,900 Stellar MLS as Distributed by MLS Grid
- 2025-12-12 Price Changed $264,300 Stellar MLS as Distributed by MLS Grid
- 2025-12-06 Price Changed $264,400 Stellar MLS as Distributed by MLS Grid
- 2025-11-28 Price Changed $264,500 Stellar MLS as Distributed by MLS Grid
- 2025-11-21 Price Changed $264,600 Stellar MLS as Distributed by MLS Grid
- 2025-11-14 Price Changed $264,700 Stellar MLS as Distributed by MLS Grid
- 2025-09-30 Listed $264,900 Stellar MLS as Distributed by MLS Grid
Cash-flow waterfall
monthlySold comps — $/sqft
last 12 mo · ≤1 miLoading sold comps…