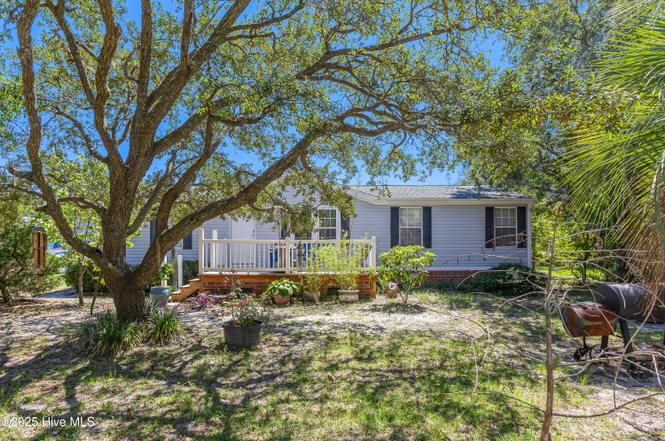
2673 White St SW · Holden Beach, NC
Flood risk 1/10 · Minimal
- FEMA flood zone
- X (unshaded)
- Chance of flooding over 30 yrs
- 0.0%
- Est. flood insurance / yr
- $507 – $1,088
Fire risk 4/10 · Minor
- Est. fire insurance / yr
- $906 – $1,684
Heat risk 10/10 · Severe
- Hot days now (above 104°F)
- 7 days/yr
- Hot days in 30 yrs
- 20 days/yr
Wind risk 9/10 · Severe
- Chance of severe wind over 30 yrs
- 99.0%
Air-quality risk 2/10 · Minimal
- Unhealthy air days now
- 1 days/yr
- Unhealthy air days in 30 yrs
- 1 days/yr
Risk factors via First Street. Map © Google.
Why this score? — see what drove the C grade
The composite is a weighted blend of 9 inputs, each scored 0–100. Each bar is that input's sub-score; the figure is the points it added to the 100-point composite (weight × sub-score).
- Cash flow +24.7/30.0
- DSCR +8.0/10.0
- ARV discount +5.9/15.0
- 1% rule +5.1/10.0
- Schools +3.9/10.0
- Livability +3.2/5.0
- Rent growth +2.5/5.0
- Condition / age +2.5/5.0
- Appreciation +0.0/10.0
$220,000
🖨 Deal sheet 📄 Offer letter ✓ Due diligence
Listing remarks
Comfortable living with space for your RV, boat, or your equipment for your business. NO HOA gives you the freedom to park your items here. Like to garden? This is your space. There's even a chicken coop ready for fresh eggs every morning. Come out a check this home so close to the Intracoastal Waterway and Holden Beach you can almost hear the waves. Schedule your private tour today!
Key facts
- Space for boat
- Space for rv
- Chicken coop
Tags
Property features AI
Exterior
- Parking: Detached garage (1 car); 6 open parking spaces (total 7 parking spaces); Garage faces front
- Utilities: Public water; Water connected; Septic tank sewer
- Home design: Manufactured home; One level
- Construction: Vinyl siding; Frame construction; Shingle roof; Crawl space foundation; Built as a manufactured home
- Exterior features: Deck; Privacy and partial fencing; Shed
Interior
- Kitchen: Electric oven; Electric cooktop; Refrigerator; Dishwasher
- Bedrooms: Total rooms: 5 (includes bedrooms and living spaces)
- Flooring: Bamboo; Carpet
- Bathrooms: 2 full bathrooms
- Heating & cooling: Heat pump heating; Electric heating; Central air conditioning
- Interior features: Walk-in closets; Kitchen island; Ceiling fans; Window coverings; Partially furnished
- Laundry & utility: Washer; Dryer
Neighborhood map
What this means for you Summary
Snapshot
- This is a 3-bed/2.0-bath manufactured listed at $220k.
Deal economics
- At list price, monthly cash flow is $457 ($5k/yr) — positive.
- The deal already cash-flows at list — no discount required.
- Meets the 1% rule at list price ($2k rent vs $220k).
- Recommended offer: $194k (12.0% below list) — sets the bar for market timing.
- Cap rate 8.8% vs local median 3.1% in Holden Beach — top-decile yield for the area; either an underpriced asset or a hidden risk that comps aren't pricing in. Stress-test before assuming the spread holds.
Location & tenants
- Location reads 65/100 on livability (#334 in NC) — a middle-class / working-renter tenant base. Strengths: employment A+, crime A, housing A; Watch: cost of living D, health & safety D, amenities F.
- Brunswick County Schools (rural): math 45% / reading 47% proficiency, ranked #82 of 178 in NC (top 46%) — families likely to look elsewhere, expect single-tenant / working-renter base with shorter leases.
- Zoned schools: Supply Elementary (math 46% / reading 39%, grade F, #625 of 1,410 statewide, top 45%, 539 students, 99% FRL); Cedar Grove Middle (math 30% / reading 36%, grade F, #305 of 475 statewide, top 65%, 434 students, 99% FRL); West Brunswick High (math 50% / reading 56%, grade C-, #281 of 535 statewide, top 53%, 1,526 students, 100% FRL) — zoned schools average 100% FRL vs 53% district-wide (46 pts higher); higher-poverty schools than district average — tighter screening recommended.
- Market conditions: 506 active listings in the ZIP; 2 comparable units currently listed for rent nearby; 6,112 units permitted in Brunswick County in 2024 (990 in 5+ unit buildings).
- This rent runs 44% of the median local income ($60k/yr) — at the standard rent-burdened threshold; future hikes will face affordability resistance.
Forward outlook
- Local home prices are declining (-3.0%/yr); year-one equity from $2k of loan paydown is wiped out by about $7k of value loss. Plan a longer hold.
- Brunswick County population projected at +36% by 2050 — long-run rental-demand tailwind backs the buy-and-hold thesis.
Negotiation context
- It's been on market 287 days — a 12% lower offer ($194k) is reasonable based on typical stale-listing flexibility.
- 5 sale attempts since 21y ago with the ask held roughly flat each time — persistent listings suggest the price (not the market) is what's stuck; bring a comps-based counter.
- Current owner paid $84k; list at $220k implies a 163% gain — meaningful room to come down on a strong offer.
Risks & watch-outs
- Climate carrying-cost: severe wind risk, 99% chance of damaging wind over 30y; extreme-heat days projected 7→20/yr by 2055 (HVAC capex compounding) — expect insurance premiums to compound above CPI over the hold.
Questions for the listing agent
- It's been on market 287 days. Have you received any prior offers? Is the seller open to a 12% concession, seller financing, or rate buy-down credit?
- Why hasn't it sold? Are there any deal-killer items the seller is aware of (foundation, flood, title, zoning, code violations)?
- Is there a deadline driving the sale (1031 exchange, divorce, estate, relocation)? That informs how much negotiation room exists.
- What's the average days-on-market for RENTAL listings here right now (not sales)? A rising rental-DOM trend means longer vacancies and softer asking-rent achievability than the comps imply.
- What's the recent tenant-quality profile in this submarket — average credit score on applications, eviction rate, late-payment / NSF rate, and stable-employment percentage? A property-management company in the area should have these aggregated.
- How much new for-sale + rental construction is in the pipeline within 1–3 miles? Heavy new supply typically softens prices + rents 12–24 months out; constrained supply supports both.
Investment metrics
- 1% rule
- 1.01% ✓
- Cap rate
- 8.79%
- Cash-on-cash
- 8.90%
- DSCR
- 1.40
- GRM
- 8.3
CMA / ARV
- ARV (on-the-fly)
- $212,544
- Comps found
- 12
Show comp detail 12 sales within ~0.75 mi
| Address | Dist | Beds/Ba | Sqft | Sold | Price | $/sf | Match |
|---|---|---|---|---|---|---|---|
| 2522 Gator Ln SW | 0.56mi | 3/2.0 | 1,268 (-2%) | 3mo | $240,000 | $189 | 68 |
| 2587 Dockside Dr SW | 0.45mi | 3/2.0 | 1,431 (+10%) | 6mo | $242,000 | $169 | 57 |
| 3006 Boones Neck Rd SW | 0.69mi | 2/2.0 (-1) | 1,351 (+4%) | 1mo | $189,000 | $140 | 54 |
| 2476 Mackerel St SW | 0.46mi | 3/2.0 | 1,216 (-6%) | 21mo | $179,000 | $147 | 51 |
| 2653 Gamewell Ct SW | 0.60mi | 3/2.0 | 1,328 (+2%) | 22mo | $247,000 | $186 | 50 |
| 2564 Nickle St SW | 0.47mi | 3/2.0 | 1,462 (+13%) | 10mo | $206,419 | $141 | 48 |
| 2978 Ice Ct SW | 0.59mi | 3/2.0 | 1,358 (+5%) | 21mo | $230,000 | $169 | 47 |
| 2875 Pirate Ln SW | 0.38mi | 2/2.0 (-1) | 1,178 (-9%) | 22mo | $191,500 | $163 | 44 |
| 2354 Lena Ln SW | 0.61mi | 3/2.0 | 1,433 (+11%) | 12mo | $235,000 | $164 | 44 |
| 2382 Summer Place Dr SW | 0.69mi | 2/2.0 (-1) | 1,178 (-9%) | 6mo | $225,500 | $191 | 43 |
| 2392 Circle Dr SW | 0.70mi | 3/2.0 | 1,475 (+14%) | 9mo | $234,600 | $159 | 36 |
| 2356 Lena Ln SW | 0.60mi | 3/2.0 | 1,488 (+15%) | 14mo | $199,000 | $134 | 36 |
Match score weights: distance 35% · size 25% · config 20% · recency 20%. Top-matched comps best support the ARV.
Projected returns pro-forma
-3.0% appreciation · 3.0% rent growth · sell at horizon
- IRR
- -2.9%
- Equity multiple
- 0.89×
- Total profit
- $-6,642
- Equity at exit
- $32,803
- IRR
- 6.8%
- Equity multiple
- 1.51×
- Total profit
- $31,273
- Equity at exit
- $19,022
Cash invested: $61,600 (down + closing). Projections, not guarantees.
Landlord ↔ Tenant lean methodology
- Overall (STATE)
- 85 Strongly Landlord-Friendly
- State North Carolina
- 85 Strongly Landlord-Friendly · R+3
- County
- — inherits STATE
- City
- — inherits STATE
ZIP-level market 28462
- Active inventory
- 506
- Price-to-rent
- 8.3×
Monthly cashflow live
- Estimated rent
- $2,216 medium interval (Pro) →
- Mortgage (P&I)
- −$1,154
- Tax from tax record
- −$48 /mo · $577/yr
- Insurance
- −$92
- HOA
- −$0
- Vacancy / Maint / Mgmt
- −$465
- Net cashflow
- $457
Break-even live
UW: 25.0% down · 7.5% · 30yr · 1.5% tax · 5.0% vac · 8.0% maint · 8.0% mgmt
Financing live
Cash to close
- Down payment
- $55,000
- Closing costs
- $6,600
- Reserves months
- —
- Total cash needed
- —
Loan-product check · same deal, 3 products live
Conventional
25% down · 7.5% · 30yr
- Down + closing
- —
- Monthly P&I
- —
- Monthly cashflow
- —
- DSCR
- —
- Eligible?
- —
Personal DTI + credit; lowest rate.
DSCR
20% down · 8.5% · 30yr
- Down + closing
- —
- Monthly P&I
- —
- Monthly cashflow
- —
- DSCR
- —
- Eligible?
- —
No personal income docs; deal must DSCR.
Hard money
10% down · 12.0% · 12mo
- Down + closing
- —
- Monthly P&I
- —
- Monthly cashflow
- —
- DSCR
- —
- Eligible?
- —
Short-term bridge; refi at stabilization.
Rent comps 2 comps
| Address | Beds | Baths | Sqft | Rent | $/sqft | DOM | Units | Dist |
|---|---|---|---|---|---|---|---|---|
| 2272 Dolphin Shores Dr SW Unit 203 Supply, NC | 3.0 | 3.0 | 1567 | $1,850 | $1.18 | 14d | 1 | 1.19mi |
| 2272 Dolphin Shores Dr SW Unit 404 Supply, NC | 2.0 | 2.0 | 1216 | $1,650 | $1.36 | 14d | 1 | 1.19mi |
Listing history 28 events
-
2026-06-18days on market $220,000 Active 287 DOM
-
2026-06-17days on market $220,000 Active 286 DOM
-
2026-06-16days on market $220,000 Active 285 DOM
-
2026-06-15days on market $220,000 Active 284 DOM
-
2026-06-14days on market $220,000 Active 282 DOM
-
2026-06-13days on market $220,000 Active 281 DOM
-
2026-06-10days on market $220,000 Active 279 DOM
-
2026-06-09days on market $220,000 Active 278 DOM
-
2026-06-08days on market $220,000 Active 277 DOM
-
2026-06-07days on market $220,000 Active 276 DOM
-
2026-06-05days on market $220,000 Active 273 DOM
-
2026-06-03days on market $220,000 Active 272 DOM
-
2026-06-02days on market $220,000 Active 271 DOM
-
2026-06-01days on market $220,000 Active 270 DOM
-
2026-05-31days on market $220,000 Active 269 DOM
-
2026-05-30days on market $220,000 Active 268 DOM
-
2025-09-04$220,000 Active
-
2024-01-06historical
-
2023-11-19price $224,900
-
2023-09-07price $227,250
-
2023-09-07price $227,500
-
2023-08-11$230,000 Active
-
2016-03-30historical
-
2015-12-01$79,500
-
2015-07-31historical
-
2015-01-09$81,500
-
2006-01-19soldstatus $83,500
-
2005-04-26$77,900
ⓘ Source: listings_history table (triggers on properties + properties_extension) + one-shot
backfill from property_details.listing_events for pre-trigger history.
Tax reassessment forecast NC · Resets to sale price
- Current annual tax
- $577 · $48/mo
- Projected year-2 tax
- $1,804 · $150/mo
- Expected delta
- +$1,227/yr (+$102/mo · 212.9%)
ⓘ Screening estimate from a state-policy table — verify with the county assessor before closing.
Climate risk First Street
- Flood 1/10 Low FEMA zone X (unshaded) · 0% chance over 30 yrs
- Wildfire 4/10 Moderate
- Heat 10/10 Extreme 7 d/yr ≥104°F today · 20 d/yr by 30 yrs out
- Wind 9/10 Extreme 99% chance of damaging wind over 30 yrs
- Air quality 2/10 Low 1 unhealthy d/yr today · 1 by 30 yrs out
Nearby sold comps map
Loading sold comps map…
Walkable amenities ~0.75 mi
Loading nearby amenities…
Taxation est. · year 1
- Rental income
- $26,590
- − Mortgage interest
- −$12,323
- − Property taxes
- −$577
- − Insurance
- −$1,100
- − Repairs & maintenance
- −$2,127
- − Management
- −$2,127
- − Depreciation
- −$6,400
- Taxable income
- $1,936
- Est. tax owed @ 24.0%
- −$465
- After-tax cash flow
- $5,021/yr
For passive investors: Depreciation is non-cash, so a rental often shows a tax loss while cash-flowing — sheltering income. Rental losses are passive: they offset passive income freely, and up to $25,000/yr can offset ordinary (W-2) income if you actively participate and your MAGI is under $100k (phasing out to $0 by $150k); unused losses carry forward. On sale, claimed depreciation is recaptured at up to 25%, and gains may owe capital-gains tax (a 1031 exchange can defer both). Figures are a year-1 estimate at your 24.0% rate — not tax advice; consult a CPA.
Schools (NCES district)
- District
- Brunswick County Schools
- NCES district ID
- 3700420
- Math proficiency
- 45% ▲ 4.00%
- Reading proficiency
- 47% ▲ 4.00%
- Median HH income
- $47,494
- Composite
- 39.23/100
- National rank
- #4011
- State rank
- #82 of 178 in NC
Livability — Holden Beach
- Score
- 65/100
- State rank
- #334
- US rank
- #13586
Category grades
Schools grade is shown separately in the Schools card above.
Census & demographics
- County
- Brunswick County · 131,536 people
- Metro
- Myrtle Beach-Conway-North Myrtle Beach, SC-NC
- Population (ZIP)
- 12,340
- Household income
- $60,349
- Rent vs Own
- Severe rent burden
- 269.0
Population outlook (Brunswick County) Hauer SSP2
- Today (2025)
- 152,111 people
- By 2030
- 165,705 · +8.9%
- By 2040
- 188,494 · +23.9%
- By 2050
- 206,228 · +35.6%
- By 2075
- 237,876 · +56.4%
- By 2100
- 251,451 · +65.3%
Race, ethnicity, and origin ACS 2023
- Neighborhood character
- Predominantly White (87%)
- Race & ethnicity
- White 87% Black 7% Two or more races 5% Hispanic / Latino 2%
- Common ancestry
- Slovak 4% Lithuanian 4% Serbian 2%
- Foreign-born
- 1% · Canada
- Languages at home
- 99% English-only · Spanish 1%
Political lean MEDSL · Brunswick
- 2024 margin
- Strong R (+24.9) · D 37.2% · R 62.0%
- 2008→2024 swing
- -6.9pp toward R · 2008: -17.9pp · 2024: -24.9pp
- All cycles
- 2024: R+24.9 2020: R+25.0 2016: R+28.7 2012: R+22.2 2008: R+17.9
Not yet ingested
- Civics
- —
Market trends
- HPI YoY
- ▼ -259.44%
- Current HPI
- 144.2462
- Rent YoY
- —
- Metro
- Myrtle Beach-Conway-North Myrtle Beach, SC-NC
- State GDP YoY
- ▲ 3.28%
- F500 in state
- 26
Industry mix (Fortune 500 HQ in NC)
| Industry | F500 HQs | Revenue |
|---|---|---|
| Financial Services | 2 | $213B |
|
||
| Retail | 2 | $95B |
|
||
| Industrial Conglomerate | 1 | $38B |
|
||
| Metals / Steel | 1 | $35B |
|
||
| Utilities | 1 | $30B |
|
||
| Industrial Machinery | 1 | $19B |
|
||
Price history
+182.4% since first listed12 events — show timeline
- 2025-09-04 Listed $220,000 Hive MLS
- 2024-01-06 Listing Removed — Hive MLS
- 2023-11-19 Price Changed $224,900 Hive MLS
- 2023-09-07 Price Changed $227,250 Hive MLS
- 2023-09-07 Price Changed $227,500 Hive MLS
- 2023-08-11 Listed $230,000 Hive MLS
- 2016-03-30 Listing Removed — Hive MLS
- 2015-12-01 Listed $79,500 Hive MLS
- 2015-07-31 Listing Removed — Hive MLS
- 2015-01-09 Listed $81,500 Hive MLS
- 2006-01-19 Sold (MLS) $83,500 Hive MLS
- 2005-04-26 Listed $77,900 Hive MLS
Property tax history
+1.0%/yrLatest (2025): $577 · +0.0% YoY. Source: county tax records.
Cash-flow waterfall
monthlySold comps — $/sqft
last 12 mo · ≤1 miLoading sold comps…