3265 Robin Dr · Decatur, IL
Flood risk 1/10 · Minimal
- FEMA flood zone
- X (unshaded)
- Chance of flooding over 30 yrs
- 0.0%
- Est. flood insurance / yr
- $473 – $860
Fire risk 1/10 · Minimal
- Est. fire insurance / yr
- $804 – $1,492
Heat risk 3/10 · Minor
- Hot days now (above 106°F)
- 7 days/yr
- Hot days in 30 yrs
- 19 days/yr
Wind risk 2/10 · Minimal
- Chance of severe wind over 30 yrs
- 2.0%
Air-quality risk 2/10 · Minimal
- Unhealthy air days now
- 1 days/yr
- Unhealthy air days in 30 yrs
- 1 days/yr
Risk factors via First Street. Map © Google.
Why this score? — see what drove the C- grade
The composite is a weighted blend of 9 inputs, each scored 0–100. Each bar is that input's sub-score; the figure is the points it added to the 100-point composite (weight × sub-score).
- Cash flow +19.5/30.0
- 1% rule +8.0/10.0
- ARV discount +7.5/15.0
- DSCR +6.1/10.0
- Appreciation +3.9/10.0
- Livability +3.0/5.0
- Rent growth +2.5/5.0
- Condition / age +2.5/5.0
- Schools +0.4/10.0
$72,500
🖨 Deal sheet 📄 Offer letter ✓ Due diligence
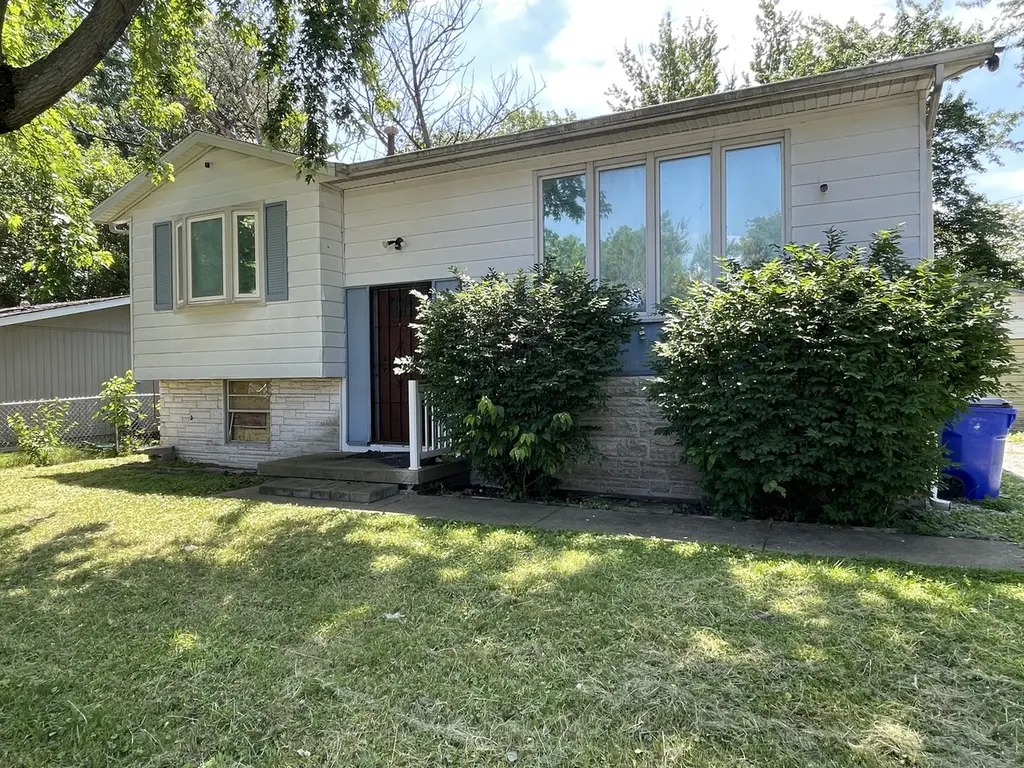
Listing remarks
Bi-level home offering 2 bedrooms and 1 full bath with potential for updates and added value. Interior features some newer flooring and updated kitchen appliances already in place. Unfinished basement includes a toilet and plumbing hookups, providing opportunity for future expansion or additional finished space. Property will require repairs and improvements and is being sold as-is. Suitable opportunity for investors, flippers, or buyers looking for a project with equity potential.
Key facts
- Plumbing hookups
- Newer flooring
- Unfinished basement
Tags
Property features AI
Finance
- Other: Property assessed living area and size sourced from assessor/county records; Total finished and unfinished combined area reported
- HOA & community: No master association fee required
Exterior
- Parking: Detached garage (garage owned); Concrete and gravel parking surfaces; Total of 2 parking spaces (2 garage spaces)
- Utilities: Public water; Public sewer; Natural gas service; Electric service (standard)
- Home design: Detached single-family home; Split-level / bi-level layout; Fee simple ownership
- Construction: Aluminum siding; Built approximately 51–60 years ago; Not rebuilt or rehabilitated
- Exterior features: Lot approximately 60 x 110; Lot under 0.25 acre; Public water and public sewer
Interior
- Kitchen: Kitchen on main level (approx. 10 x 12)
- Bedrooms: Two bedrooms (both on the main level); Bedroom dimensions include a 10 x 9 bedroom and an 11 x 9 master bedroom
- Bathrooms: One full bathroom; One half bathroom
- Heating & cooling: Natural gas heating; Central air conditioning
- Interior features: Four total rooms
- Laundry & utility: Dedicated laundry room
Neighborhood map
What this means for you Summary
Snapshot
- This is a 2-bed/1.0-bath other listed at $72k.
Deal economics
- At list price, monthly cash flow is $82 ($981/yr) — positive.
- The deal already cash-flows at list — no discount required.
- Meets the 1% rule at list price ($946 rent vs $72k).
- Recommended offer: $71k (1.5% below list) — sets the bar for market timing.
Location & tenants
- Location reads 59/100 on livability (#1,076 in IL) — a working-class tenant base; expect higher turnover. Strengths: cost of living A+, housing A+; Watch: schools F, crime F, amenities F.
- Decatur SD 61 (urban): math 3% / reading 6% proficiency, ranked #605 of 620 in IL (top 98%) — low school quality limits family demand, transient renter base, plan for 1-2y turnover; 73% free/reduced lunch — lower-income household profile, screen leases tightly.
- Market conditions: 135 active listings in the ZIP; 2 comparable units currently listed for rent nearby; 63 units permitted in Macon County in 2024 (0 in 5+ unit buildings).
Forward outlook
- Local home prices are declining (-2.2%/yr); year-one equity from $501 of loan paydown is wiped out by about $2k of value loss. Plan a longer hold.
- Macon County population projected at -24% by 2050 — secular population decline; favor cash flow + early exit over multi-decade hold.
Negotiation context
- It's been on market 27 days — a 2% lower offer ($71k) is reasonable based on typical stale-listing flexibility.
Risks & watch-outs
- Watch-outs: property tax is 4.2% of price.
Questions for the listing agent
- Built in 1969 — when were the roof, HVAC, electrical panel, plumbing, and water heater last replaced?
- Property tax is high relative to price — has the assessment been appealed recently, and will the sale trigger a re-assessment?
- Is there a deadline driving the sale (1031 exchange, divorce, estate, relocation)? That informs how much negotiation room exists.
- Schools are F-rated, which usually means shorter tenancies and higher turnover. Who's the typical renter profile here, and what's been the actual vacancy rate?
- Crime grade is F in this area — have there been break-ins, vandalism, or insurance claims at this property in the last 3 years? What carrier currently insures it and at what premium?
- What's the average days-on-market for RENTAL listings here right now (not sales)? A rising rental-DOM trend means longer vacancies and softer asking-rent achievability than the comps imply.
- What's the recent tenant-quality profile in this submarket — average credit score on applications, eviction rate, late-payment / NSF rate, and stable-employment percentage? A property-management company in the area should have these aggregated.
- How much new for-sale + rental construction is in the pipeline within 1–3 miles? Heavy new supply typically softens prices + rents 12–24 months out; constrained supply supports both.
Investment metrics
- 1% rule
- 1.30% ✓
- Cap rate
- 7.65%
- Cash-on-cash
- 4.83%
- DSCR
- 1.21
- GRM
- 6.4
CMA / ARV
No comps found within radius.
Projected returns pro-forma
-2.21% appreciation · 3.0% rent growth · sell at horizon
- IRR
- -5.0%
- Equity multiple
- 0.80×
- Total profit
- $-4,016
- Equity at exit
- $13,374
- IRR
- 3.5%
- Equity multiple
- 1.29×
- Total profit
- $5,801
- Equity at exit
- $10,763
Cash invested: $20,300 (down + closing). Projections, not guarantees.
Landlord ↔ Tenant lean methodology
- Overall (STATE)
- 43 Moderately Tenant-Leaning
- State Illinois
- 43 Moderately Tenant-Leaning · D+7
- County
- — inherits STATE
- City
- — inherits STATE
ZIP-level market 62526
- Home prices YoY
- -1.2%
- Active inventory
- 135
- Price-to-rent
- 6.4×
Monthly cashflow live
- Estimated rent
- $946 medium interval (Pro) →
- Mortgage (P&I)
- −$380
- Tax from tax record
- −$255 /mo · $3,063/yr
- Insurance
- −$30
- HOA
- −$0
- Vacancy / Maint / Mgmt
- −$199
- Net cashflow
- $82
Break-even live
UW: 25.0% down · 7.5% · 30yr · 1.5% tax · 5.0% vac · 8.0% maint · 8.0% mgmt
Financing live
Cash to close
- Down payment
- $18,125
- Closing costs
- $2,175
- Reserves months
- —
- Total cash needed
- —
Loan-product check · same deal, 3 products live
Conventional
25% down · 7.5% · 30yr
- Down + closing
- —
- Monthly P&I
- —
- Monthly cashflow
- —
- DSCR
- —
- Eligible?
- —
Personal DTI + credit; lowest rate.
DSCR
20% down · 8.5% · 30yr
- Down + closing
- —
- Monthly P&I
- —
- Monthly cashflow
- —
- DSCR
- —
- Eligible?
- —
No personal income docs; deal must DSCR.
Hard money
10% down · 12.0% · 12mo
- Down + closing
- —
- Monthly P&I
- —
- Monthly cashflow
- —
- DSCR
- —
- Eligible?
- —
Short-term bridge; refi at stabilization.
Rent comps 2 comps
| Address | Beds | Baths | Sqft | Rent | $/sqft | DOM | Units | Dist |
|---|---|---|---|---|---|---|---|---|
| 1350 E Wellington Way Decatur, IL | 1.0 | 1.0 | 605 | $700 | $1.16 | 21d | 1 | 1.47mi |
| 1350 E Wellington Way Unit 1330-3A Decatur, IL | 2.0 | 1.0 | 858 | $825 | $0.96 | 43d | 1 | 1.47mi |
Listing history 17 events
-
2026-06-19days on market $72,500 Active 27 DOM
-
2026-06-18days on market $72,500 Active 26 DOM
-
2026-06-17days on market $72,500 Active 25 DOM
-
2026-06-16days on market $72,500 Active 24 DOM
-
2026-06-15days on market $72,500 Active 23 DOM
-
2026-06-14days on market $72,500 Active 21 DOM
-
2026-06-13days on market $72,500 Active 20 DOM
-
2026-06-10days on market $72,500 Active 18 DOM
-
2026-06-09days on market $72,500 Active 17 DOM
-
2026-06-08days on market $72,500 Active 16 DOM
-
2026-06-07days on market $72,500 Active 15 DOM
-
2026-06-05days on market $72,500 Active 12 DOM
-
2026-06-02days on market $72,500 Active 10 DOM
-
2026-06-01days on market $72,500 Active 9 DOM
-
2026-05-31days on market $72,500 Active 8 DOM
-
2026-05-30days on market $72,500 Active 7 DOM
-
2026-05-22$72,500 Active
ⓘ Source: listings_history table (triggers on properties + properties_extension) + one-shot
backfill from property_details.listing_events for pre-trigger history.
Tax reassessment forecast IL · Partial reset (capped growth)
- Current annual tax
- $3,063 · $255/mo
- Projected year-2 tax
- $3,063 · $255/mo
- Expected delta
- $0/yr ($0/mo · 0.0%)
ⓘ Screening estimate from a state-policy table — verify with the county assessor before closing.
Climate risk First Street
- Flood 1/10 Low FEMA zone X (unshaded) · 0% chance over 30 yrs
- Wildfire 1/10 Low
- Heat 3/10 Moderate 7 d/yr ≥106°F today · 19 d/yr by 30 yrs out
- Wind 2/10 Low 2% chance of damaging wind over 30 yrs
- Air quality 2/10 Low 1 unhealthy d/yr today · 1 by 30 yrs out
Nearby sold comps map
Loading sold comps map…
Walkable amenities ~0.75 mi
Loading nearby amenities…
Taxation est. · year 1
- Rental income
- $11,353
- − Mortgage interest
- −$4,061
- − Property taxes
- −$3,063
- − Insurance
- −$362
- − Repairs & maintenance
- −$908
- − Management
- −$908
- − Depreciation
- −$2,109
- Taxable loss
- −$59
- Est. tax savings @ 24.0%
- +$14
- After-tax cash flow
- $995/yr
For passive investors: Depreciation is non-cash, so a rental often shows a tax loss while cash-flowing — sheltering income. Rental losses are passive: they offset passive income freely, and up to $25,000/yr can offset ordinary (W-2) income if you actively participate and your MAGI is under $100k (phasing out to $0 by $150k); unused losses carry forward. On sale, claimed depreciation is recaptured at up to 25%, and gains may owe capital-gains tax (a 1031 exchange can defer both). Figures are a year-1 estimate at your 24.0% rate — not tax advice; consult a CPA.
Schools (NCES district)
- District
- Decatur SD 61
- NCES district ID
- 1711850
- Math proficiency
- 3% ▼ -4.00%
- Reading proficiency
- 6% ▼ -6.00%
- Median HH income
- $38,864
- Composite
- 3.99/100
- National rank
- #10059
- State rank
- #605 of 620 in IL
Livability — Decatur
- Score
- 59/100
- State rank
- #1076
- US rank
- #20533
Category grades
Schools grade is shown separately in the Schools card above.
Census & demographics
- Census place
- Decatur, IL
- County
- Macon County · 78,333 people
- City population
- 78,333
- Metro
- Decatur, IL
- Population (ZIP)
- 30,483
- Household income
- $49,062
- Rent vs Own
- Severe rent burden
- 1041.0
Population outlook (Macon County) Hauer SSP2
- Today (2025)
- 99,568 people
- By 2030
- 94,973 · -4.6%
- By 2040
- 85,250 · -14.4%
- By 2050
- 75,920 · -23.8%
- By 2075
- 55,962 · -43.8%
- By 2100
- 36,468 · -63.4%
Race, ethnicity, and origin ACS 2023
- Neighborhood character
- Predominantly White (68%)
- Race & ethnicity
- White 68% Black 22% Two or more races 6% Hispanic / Latino 3% Asian 2%
- Common ancestry
- Lithuanian 2% Italian 2% Slovak 2%
- Foreign-born
- 4% · Canada
- Languages at home
- 95% English-only · Spanish 2% Other Indo-European 1%
Political lean MEDSL · Macon
- 2024 margin
- R (+18.9) · D 39.8% · R 58.7% · Other 1.4%
- 2008→2024 swing
- -20.0pp toward R · 2008: 1.1pp · 2024: -18.9pp
- All cycles
- 2024: R+18.9 2020: R+17.7 2016: R+18.1 2012: R+5.2 2008: D+1.1
Not yet ingested
- Civics
- —
Market trends
- HPI YoY
- ▼ -2.21%
- Current HPI
- 182.871
- Rent YoY
- —
- Metro
- Decatur, IL
- State GDP YoY
- ▲ 1.59%
- F500 in state
- 60
Industry mix (Fortune 500 HQ in IL)
| Industry | F500 HQs | Revenue |
|---|---|---|
| Insurance | 4 | $201B |
|
||
| Consumer Goods | 4 | $87B |
|
||
| Industrial Machinery | 3 | $64B |
|
||
| Healthcare | 2 | $55B |
|
||
| Retail / Pharmacy | 1 | $148B |
|
||
| Agriculture / Food | 1 | $86B |
|
||
Price history
1 event — show timeline
- 2026-05-22 Listed $72,500 MRED as Distributed by MLS Grid
Property tax history
+9.2%/yrLatest (2024): $3,063 · +7.8% YoY. Source: county tax records.
Cash-flow waterfall
monthlySold comps — $/sqft
last 12 mo · ≤1 miLoading sold comps…