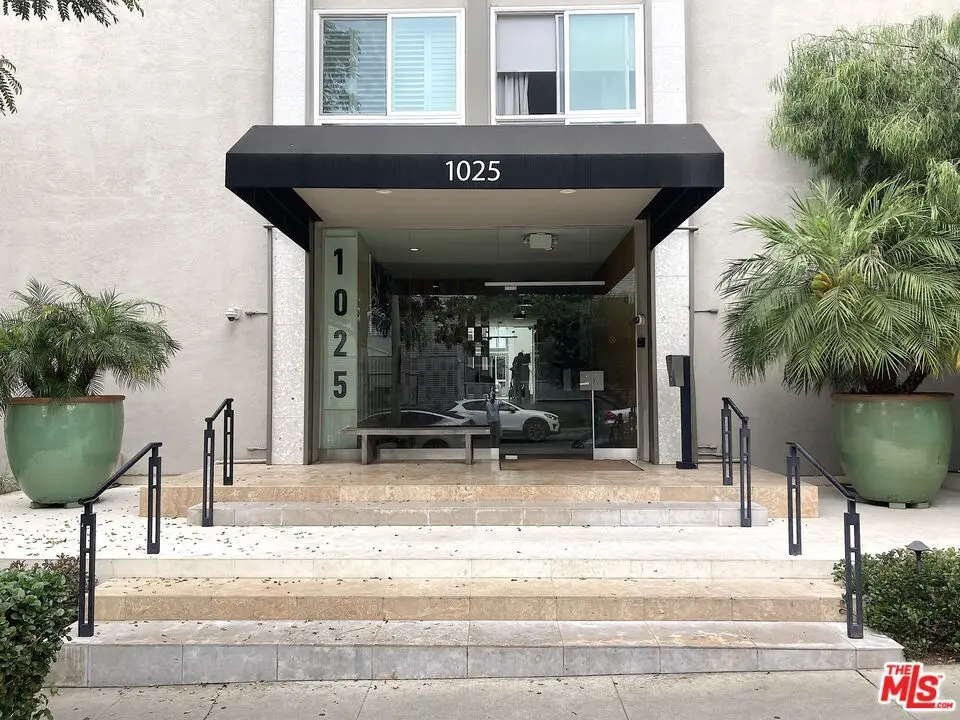
1025 N Kings Rd #115 · West Hollywood, CA
Flood risk 1/10 · Minimal
- FEMA flood zone
- X (unshaded)
- Chance of flooding over 30 yrs
- 0.0%
- Est. flood insurance / yr
- $507 – $1,088
Fire risk 1/10 · Minimal
- Est. fire insurance / yr
- $659 – $1,223
Heat risk 6/10 · Moderate
- Hot days now (above 88°F)
- 7 days/yr
- Hot days in 30 yrs
- 23 days/yr
Wind risk 1/10 · Minimal
- Chance of severe wind over 30 yrs
- —
Air-quality risk 5/10 · Moderate
- Unhealthy air days now
- 7 days/yr
- Unhealthy air days in 30 yrs
- 7 days/yr
Risk factors via First Street. Map © Google.
Why this score? — see what drove the D grade
The composite is a weighted blend of 9 inputs, each scored 0–100. Each bar is that input's sub-score; the figure is the points it added to the 100-point composite (weight × sub-score).
- ARV discount +15.0/15.0
- Cash flow +7.5/30.0
- Appreciation +5.4/10.0
- Schools +3.6/10.0
- Livability +3.5/5.0
- 1% rule +2.6/10.0
- Condition / age +2.5/5.0
- Rent growth +2.4/5.0
- DSCR +1.6/10.0
$499,000
🖨 Deal sheet (PDF) 📄 Offer letter ✓ Due diligence
Listing remarks
Redo this 1039 sq ft 1 br/1.5 Ba condo, 1-sty up. Frml Entry, big LR, w/ south vus of mature trees. Built as a condo w/ a large kitch, originally plumbed for laund equip. 1/2 BA+BR w/ its own BA & 2 closets. Modernized Primary BA w/ sep. tiled shower & tub . Central A/C. 1 secured pkg space; there is also guest pking. Swimming pl. Located on popular Kings Rd in central W Hllywd. Close to local restaurants & shops. Convenient nearby pub. transit. Probate sale & short-sale. Show by appt.
Key facts
- Green area
- Formal entry
- Entry closet
Tags
Property features AI
Finance
- Other: Complex contains 62 units; Managed by Scott Management
- Financial info: Listing terms: Probate
- HOA & community: Monthly HOA dues; HOA amenities include controlled access, elevator, guest parking, pool, sun deck, and maintained landscaping; Association pet rules (call for details)
Exterior
- Parking: Subterranean gated garage with controlled entrance; One covered parking space (total 1 parking space)
- Security: 24-hour security; Automatic gate; Gated community; Exterior security lights; Smoke and fire detection system; Carbon monoxide detector(s)
- Utilities: Public water
- Home design: Residential condominium, attached; One level unit; Faces south; Entry on first floor
- Construction: Stucco exterior; Building has 4 total floors; Attached/common walls
- Exterior features: Association pool; Green belt view; Southern exposure; Association-maintained landscaping; Sun deck
Interior
- Kitchen: Dishwasher; Garbage disposal; Hood fan; Refrigerator
- Flooring: Carpet; Tile
- Bathrooms: One full bathroom; One half bathroom
- Heating & cooling: A/C; Radiant heat
- Interior features: Foyer entry; Pantry; Dining room
- Laundry & utility: Community laundry; Laundry area in kitchen; Central water heater
Neighborhood map
What this means for you Summary
Snapshot
- This is a 1-bed/2.0-bath condo listed at $499k.
Deal economics
- At list price, monthly cash flow is $-631 ($-8k/yr) — negative.
- To cash-flow at today's rent, offer at most $388k (22.3% below list).
- To meet the 1% rule (rent ≥ 1% of price), the offer needs to be $379k (24.0% below list).
- Recommended offer: $379k (24.0% below list) — sets the bar for 1% rule.
- Cap rate 4.8% vs local median 1.5% in West Hollywood — top-decile yield for the area; either an underpriced asset or a hidden risk that comps aren't pricing in. Stress-test before assuming the spread holds.
Location & tenants
- Location reads 70/100 on livability (#239 in CA) — a middle-class / working-renter tenant base. Strengths: amenities A+, commute A+, employment B+; Watch: health & safety C-, crime F, cost of living F.
- Los Angeles Unified (urban): math 29% / reading 54% proficiency, ranked #223 of 517 in CA (top 43%) — families likely to look elsewhere, expect single-tenant / working-renter base with shorter leases; 67% free/reduced lunch — lower-income household profile, screen leases tightly.
- Zoned schools: Rosewood Avenue Elementary (248 students, 66% FRL); Hubert Howe Bancroft Middle (446 students, 92% FRL); Fairfax Senior High (math 40% / reading 61%, grade D+, #324 of 1,170 statewide, top 28%, 1,632 students, 81% FRL).
- Market conditions: Rents soft (-0.5%/yr); 384 active listings in the ZIP; 40 comparable units currently listed for rent nearby; rentals at typical pace (median 27d on market — plan ~3-4 weeks tenant-placement turnaround); solid renter incomes; 19,697 units permitted in Los Angeles County in 2024 (9,426 in 5+ unit buildings).
- This rent runs 42% of the median local income ($108k/yr) — at the standard rent-burdened threshold; future hikes will face affordability resistance.
Forward outlook
- In year one you build about $7k of equity ($3k loan paydown + $4k appreciation (0.8% local appreciation)).
- Los Angeles County population projected at +9% by 2050 — modest demand growth; plan on rents tracking national, not racing it.
- By year 5, paydown + projected appreciation supports a ~$35k cash-out refi (75% LTV) — recoverable capital for the next deal without selling this one.
Negotiation context
- It's been on market 15 days — a 2% lower offer ($492k) is reasonable based on typical stale-listing flexibility.
- Current owner paid $105k; list at $499k implies a 375% gain — meaningful room to come down on a strong offer.
Risks & watch-outs
- Climate carrying-cost: extreme-heat days projected 7→23/yr by 2055 (HVAC capex compounding) — expect insurance premiums to compound above CPI over the hold.
Questions for the listing agent
- What do current leases actually rent for vs. the listed asking? Can we see a recent rent roll and the last 12 months of T-12 income?
- Built in 1965 — when were the roof, HVAC, electrical panel, plumbing, and water heater last replaced?
- What does the HOA fee cover, when was the last increase, and are there any pending special assessments or reserve-fund shortfalls?
- Any open or pending special assessments — roof, HVAC, plumbing, elevator, façade? What's the per-unit balance and payoff schedule, and is the seller paying it off at close or rolling it to the buyer?
- Is there a deadline driving the sale (1031 exchange, divorce, estate, relocation)? That informs how much negotiation room exists.
- Schools are A-rated — typically a magnet for longer-tenancy family renters. What's the average tenant stay here, and is there a school-zone premium baked into asking?
- Crime grade is F in this area — have there been break-ins, vandalism, or insurance claims at this property in the last 3 years? What carrier currently insures it and at what premium?
- The area grade is low — what's the realistic commute time and amenity access for the typical tenant pool here? Any planned neighborhood developments (good or bad) we should know about?
- What's the average days-on-market for RENTAL listings here right now (not sales)? A rising rental-DOM trend means longer vacancies and softer asking-rent achievability than the comps imply.
- What's the recent tenant-quality profile in this submarket — average credit score on applications, eviction rate, late-payment / NSF rate, and stable-employment percentage? A property-management company in the area should have these aggregated.
- How much new apartment / multifamily construction is in the pipeline within 1–3 miles? Heavy new supply (>2% of stock underway) typically softens rents 12–24 months out; light construction supports rent growth.
Investment metrics
- 1% rule
- 0.76% ✗
- Cap rate
- 4.78%
- Cash-on-cash
- -5.42%
- DSCR
- 0.76
- GRM
- 11.0
CMA / ARV
- ARV (median comp)
- $765,267
- List price
- $499,000
- Delta
- -34.79%
- Verdict
- UNDERPRICED
- Comps
- 20 within 1.0 mi
Projected returns pro-forma
0.76% appreciation · 0.0% rent growth · sell at horizon
- IRR
- -7.0%
- Equity multiple
- 0.66×
- Total profit
- $-47,550
- Equity at exit
- $164,208
- IRR
- -3.1%
- Equity multiple
- 0.65×
- Total profit
- $-48,721
- Equity at exit
- $213,546
Cash invested: $139,720 (down + closing). Projections, not guarantees.
Landlord ↔ Tenant lean methodology
- Overall (STATE)
- 18 Strongly Tenant-Friendly
- State California
- 18 Strongly Tenant-Friendly · D+13
- County
- — inherits STATE
- City
- — inherits STATE
ZIP-level market 90069
- Home prices YoY
- 0.2%
- Rents YoY
- -0.5%
- Active inventory
- 384
- Price-to-rent
- 11.0×
Monthly cashflow live
- Estimated rent
- $3,792 high interval (Pro) →
- Mortgage (P&I)
- −$2,617
- Tax from tax record
- −$226 /mo · $2,715/yr
- Insurance
- −$208
- HOA
- −$575
- Vacancy / Maint / Mgmt
- −$796
- Net cashflow
- $-631
Break-even live
Sensitivity live
| Price | -10% $-348 | -5% $-489 | +0% $-631 | +5% $-772 | +10% $-913 |
|---|---|---|---|---|---|
| Rent | -10% $-930 | -5% $-780 | +0% $-631 | +5% $-481 | +10% $-331 |
| Rate | -1.0pp $-379 | -0.5pp $-504 | base $-631 | +0.5pp $-760 | +1.0pp $-891 |
UW: 25.0% down · 7.5% · 30yr · 1.5% tax · 5.0% vac · 8.0% maint · 8.0% mgmt
Financing live
Cash to close
- Down payment
- $124,750
- Closing costs
- $14,970
- Reserves months
- —
- Total cash needed
- —
Loan-product check · same deal, 3 products live
Conventional
25% down · 7.5% · 30yr
- Down + closing
- —
- Monthly P&I
- —
- Monthly cashflow
- —
- DSCR
- —
- Eligible?
- —
Personal DTI + credit; lowest rate.
DSCR
20% down · 8.5% · 30yr
- Down + closing
- —
- Monthly P&I
- —
- Monthly cashflow
- —
- DSCR
- —
- Eligible?
- —
No personal income docs; deal must DSCR.
Hard money
10% down · 12.0% · 12mo
- Down + closing
- —
- Monthly P&I
- —
- Monthly cashflow
- —
- DSCR
- —
- Eligible?
- —
Short-term bridge; refi at stabilization.
Rent comps 40 comps
| Address | Beds | Baths | Sqft | Rent | $/sqft | DOM | Units | Dist |
|---|---|---|---|---|---|---|---|---|
| 1025 N Kings Rd #313 West Hollywood, CA | 2.0 | 2.0 | 1417 | $5,995 | $4.23 | 45d | 1 | 0.02mi |
| 8350 Santa Monica Blvd West Hollywood, CA | 2.0 | 2.0 | 909 | $4,699 | $5.17 | 9d | 1 | 0.03mi |
| 1030 N Kings Rd #206 West Hollywood, CA | 2.0 | 2.0 | 1170 | $7,100 | $6.07 | 45d | 1 | 0.04mi |
| 1010 N Kings Rd #310 West Hollywood, CA | 1.0 | 1.0 | 1131 | $2,950 | $2.61 | 9d | 1 | 0.06mi |
| 1010 N Kings Rd West Hollywood, CA | 1.0 | 1.0 | 1131 | $2,850 | $2.52 | 26d | 2 | 0.06mi |
| 1114 Kings Rd Unit 05 (1/1) West Hollywood, CA | 1.0 | 1.0 | 1050 | $2,850 | $2.71 | 9d | 1 | 0.09mi |
| 949 N Kings Rd #302 West Hollywood, CA | 1.0 | 1.5 | 1093 | $4,495 | $4.11 | 45d | 1 | 0.11mi |
| 950 N Kings Rd West Hollywood, CA | 2.0 | 1.0–2.0 | 955 | $3,535 | $3.70 | 26d | 2 | 0.11mi |
| 1120 Flores St Unit 05 West Hollywood, CA | 1.0 | 1.0 | 800 | $2,895 | $3.62 | 4d | 1 | 0.11mi |
| 1016 Croft Ave Unit 10005 Los Angeles, CA | 2.0 | 1.0 | 1225 | $3,495 | $2.85 | 45d | 1 | 0.12mi |
| 1203 N Sweetzer Ave West Hollywood, CA | 1.0 | 1.0 | 863 | $2,700 | $3.13 | 26d | 2 | 0.15mi |
| 1209 N Kings Rd #8 West Hollywood, CA | 2.0 | 1.5 | 1160 | $4,800 | $4.14 | 26d | 1 | 0.15mi |
| 1017 N Croft Ave #103 Los Angeles, CA | 2.0 | 2.5 | 1375 | $9,800 | $7.13 | 26d | 1 | 0.16mi |
| 942 N Croft Ave Los Angeles, CA | 2.0 | 1.0 | 1400 | $4,295 | $3.07 | 45d | 1 | 0.17mi |
| 1121 N Olive Dr #209 West Hollywood, CA | 2.0 | 2.0 | 1193 | $3,750 | $3.14 | 45d | 1 | 0.18mi |
| 1232 N Kings Rd West Hollywood, CA | 2.0 | 2.0 | 1230 | $5,064 | $4.12 | 21d | 1 | 0.18mi |
| 1030 N Harper Ave Unit 1 West Hollywood, CA | 2.0 | 2.0 | 1100 | $3,157 | $2.87 | 45d | 1 | 0.18mi |
| 1233 N Flores St #104 West Hollywood, CA | 1.0 | 1.0 | 710 | $3,350 | $4.72 | 26d | 1 | 0.19mi |
| 8281 Norton Ave Unit 8281 1/2 West Hollywood, CA | 1.0 | 1.0 | 750 | $2,595 | $3.46 | 45d | 1 | 0.19mi |
| 1222 N Olive Dr West Hollywood, CA | 1.0 | 1.0 | 596 | $3,100 | $5.20 | 20d | 2 | 0.20mi |
| 1222 N Olive Dr West Hollywood, CA | 1.0 | 1.0 | 793 | $3,100 | $3.91 | 6d | 1 | 0.20mi |
| 1138 Hacienda Pl West Hollywood, CA | 1.0 | 1.5 | 900 | $2,595 | $2.88 | 20d | 1 | 0.20mi |
| 960 N Alfred St Los Angeles, CA | 1.0–2.0 | 1.0–2.0 | 945 | $2,375 | $2.51 | 5d | 4 | 0.20mi |
| 1230 N Sweetzer Ave #106 West Hollywood, CA | 1.0 | 1.0 | 750 | $2,950 | $3.93 | 26d | 1 | 0.21mi |
| 1230 N Sweetzer Ave West Hollywood, CA | 1.0 | 1.0 | 715 | $2,722 | $3.81 | 45d | 2 | 0.21mi |
| 1245 N Kings Rd West Hollywood, CA | 1.0 | 1.0 | 1000 | $2,850 | $2.85 | 45d | 1 | 0.22mi |
| 928 N Alfred St Unit 101 Los Angeles, CA | 1.0 | 1.0 | 875 | $2,800 | $3.20 | 6d | 1 | 0.22mi |
| 949 N Alfred St Unit 8 Los Angeles, CA | 1.0 | 1.0 | 700 | $2,150 | $3.07 | 45d | 1 | 0.23mi |
| 850 N Kings Rd #306 West Hollywood, CA | 2.0 | 2.0 | 1317 | $5,995 | $4.55 | 14d | 1 | 0.23mi |
| 850 N Kings Rd West Hollywood, CA | 2.0 | 2.0 | 1271 | $5,245 | $4.13 | 16d | 2 | 0.23mi |
| 916 N Alfred St Unit 6 Los Angeles, CA | 1.0 | 1.0 | 900 | $4,000 | $4.44 | 45d | 1 | 0.24mi |
| 1257 N Sweetzer Ave Unit 104 West Hollywood, CA | 1.0 | 1.0 | 752 | $3,650 | $4.85 | 26d | 1 | 0.24mi |
| 1257 N Sweetzer Ave Unit 202 West Hollywood, CA | 2.0 | 2.0 | 1156 | $5,795 | $5.01 | 45d | 1 | 0.24mi |
| 1257 N Sweetzer Ave Unit 202 West Hollywood, CA | 2.0 | 2.0 | 1156 | $5,795 | $5.01 | 26d | 1 | 0.24mi |
| 1260 Flores St Unit 5 West Hollywood, CA | 2.0 | 1.0 | 1329 | $3,750 | $2.82 | 9d | 1 | 0.24mi |
| 8440 Fountain Ave West Hollywood, CA | 2.0 | 2.0 | 1304 | $3,795 | $2.91 | 26d | 1 | 0.24mi |
| 8214 Norton Ave Unit C West Hollywood, CA | 1.0 | 1.0 | 750 | $2,250 | $3.00 | 45d | 1 | 0.25mi |
| 935 N Alfred St Unit 8 Los Angeles, CA | 1.0 | 1.0 | 750 | $2,100 | $2.80 | 26d | 1 | 0.25mi |
| 910 N Alfred St Unit 4 Los Angeles, CA | 2.0 | 2.0 | 1300 | $5,000 | $3.85 | 45d | 1 | 0.25mi |
| 8216 Norton Ave West Hollywood, CA | 2.0 | 2.0 | 750 | $2,850 | $3.80 | 18d | 1 | 0.25mi |
HOA detail condo
- Monthly dues
- $575 · $6,900/yr
- Assessments
- None detected in remarks — confirm with the listing agent.
Listing history 4 events
-
2026-05-12$499,000 Active 2428-char remark
-
1988-05-12soldstatus $105,000
-
1986-06-16soldstatus $90,000
-
1983-08-25soldstatus $99,500
ⓘ Source: listings_history table (triggers on properties + properties_extension) + one-shot
backfill from property_details.listing_events for pre-trigger history.
Tax reassessment forecast CA · Resets to sale price
- Current annual tax
- $2,715 · $226/mo
- Projected year-2 tax
- $3,792 · $316/mo
- Expected delta
- +$1,078/yr (+$90/mo · 39.7%)
ⓘ Screening estimate from a state-policy table — verify with the county assessor before closing.
Climate risk First Street
- Flood 1/10 Low FEMA zone X (unshaded) · 0% chance over 30 yrs
- Wildfire 1/10 Low
- Heat 6/10 Major 7 d/yr ≥88°F today · 23 d/yr by 30 yrs out
- Wind 1/10 Low
- Air quality 5/10 Major 7 unhealthy d/yr today · 7 by 30 yrs out
Nearby sold comps map
Loading sold comps map…
Walkable amenities ~0.75 mi
Loading nearby amenities…
Taxation est. · year 1
- Rental income
- $45,499
- − Mortgage interest
- −$27,952
- − Property taxes
- −$2,715
- − Insurance
- −$2,495
- − Repairs & maintenance
- −$3,640
- − Management
- −$3,640
- − HOA
- −$6,900
- − Depreciation
- −$14,516
- Taxable loss
- −$16,359
- Est. tax savings @ 24.0%
- +$3,926
- After-tax cash flow
- $-3,641/yr
For passive investors: Depreciation is non-cash, so a rental often shows a tax loss while cash-flowing — sheltering income. Rental losses are passive: they offset passive income freely, and up to $25,000/yr can offset ordinary (W-2) income if you actively participate and your MAGI is under $100k (phasing out to $0 by $150k); unused losses carry forward. On sale, claimed depreciation is recaptured at up to 25%, and gains may owe capital-gains tax (a 1031 exchange can defer both). Figures are a year-1 estimate at your 24.0% rate — not tax advice; consult a CPA.
Schools (NCES district)
- District
- Los Angeles Unified
- NCES district ID
- 0622710
- Math proficiency
- 29% ▼ -4.00%
- Reading proficiency
- 54% ▲ 10.00%
- Median HH income
- $50,403
- Composite
- 35.67/100
- National rank
- #4875
- State rank
- #223 of 517 in CA
Livability — West Hollywood
- Score
- 70/100
- State rank
- #239
- US rank
- #7852
Category grades
Schools grade is shown separately in the Schools card above.
Census & demographics
- Census place
- West Hollywood, CA
- County
- Los Angeles County · 9,444,647 people
- City population
- 20,961
- Metro
- Los Angeles-Long Beach-Anaheim, CA
- Population (ZIP)
- 20,961
- Household income
- $107,987
- Rent vs Own
- Severe rent burden
- 2412.0
Population outlook (Los Angeles County) Hauer SSP2
- Today (2025)
- 10,940,515 people
- By 2030
- 11,256,481 · +2.9%
- By 2040
- 11,729,929 · +7.2%
- By 2050
- 11,948,407 · +9.2%
- By 2075
- 11,818,114 · +8.0%
- By 2100
- 10,842,928 · -0.9%
Race, ethnicity, and origin ACS 2023
- Neighborhood character
- Predominantly White (77%)
- Race & ethnicity
- White 77% Hispanic / Latino 8% Two or more races 8% Asian 6% Black 3%
- Hispanic origin (detail)
- Mexican 4%
- Common ancestry
- Scotch-Irish 6% Lithuanian 4% Italian 4%
- Foreign-born
- 21% · Canada, China, Jamaica
- Languages at home
- 77% English-only · Spanish 7% Other Indo-European 4% Russian/Polish/Slavic 3%
Political lean MEDSL · Los Angeles
- 2024 margin
- Solid D (+32.9) · D 64.8% · R 31.9% · Other 3.3%
- 2008→2024 swing
- -7.4pp toward R · 2008: 40.4pp · 2024: 32.9pp
- All cycles
- 2024: D+32.9 2020: D+44.2 2016: D+48.0 2012: D+40.0 2008: D+40.4
Not yet ingested
- Civics
- —
Market trends
- HPI YoY
- ▲ 0.76%
- Current HPI
- 323.1842
- Rent YoY
- ▼ -0.54%
- Metro
- Los Angeles-Long Beach-Anaheim, CA
- State GDP YoY
- ▲ 3.21%
- F500 in state
- 116
Industry mix (Fortune 500 HQ in CA)
| Industry | F500 HQs | Revenue |
|---|---|---|
| Technology | 27 | $1,492B |
|
||
| Financial Services | 3 | $174B |
|
||
| Retail | 3 | $44B |
|
||
| Insurance | 3 | $26B |
|
||
| Media / Entertainment | 2 | $115B |
|
||
| Pharmaceuticals / Biotech | 2 | $62B |
|
||
Price history
+401.5% since first listed5 events — show timeline
- 2026-05-29 Pending — TheMLS
- 2026-05-12 Listed $499,000 TheMLS
- 1988-05-12 Sold (Public Records) $105,000 Public Records
- 1986-06-16 Sold (Public Records) $90,000 Public Records
- 1983-08-25 Sold (Public Records) $99,500 Public Records
Property tax history
+1.8%/yrLatest (2025): $2,715 · +3.0% YoY. Source: county tax records.
Cash-flow waterfall
monthlySold comps — $/sqft
last 12 mo · ≤1 miLoading sold comps…