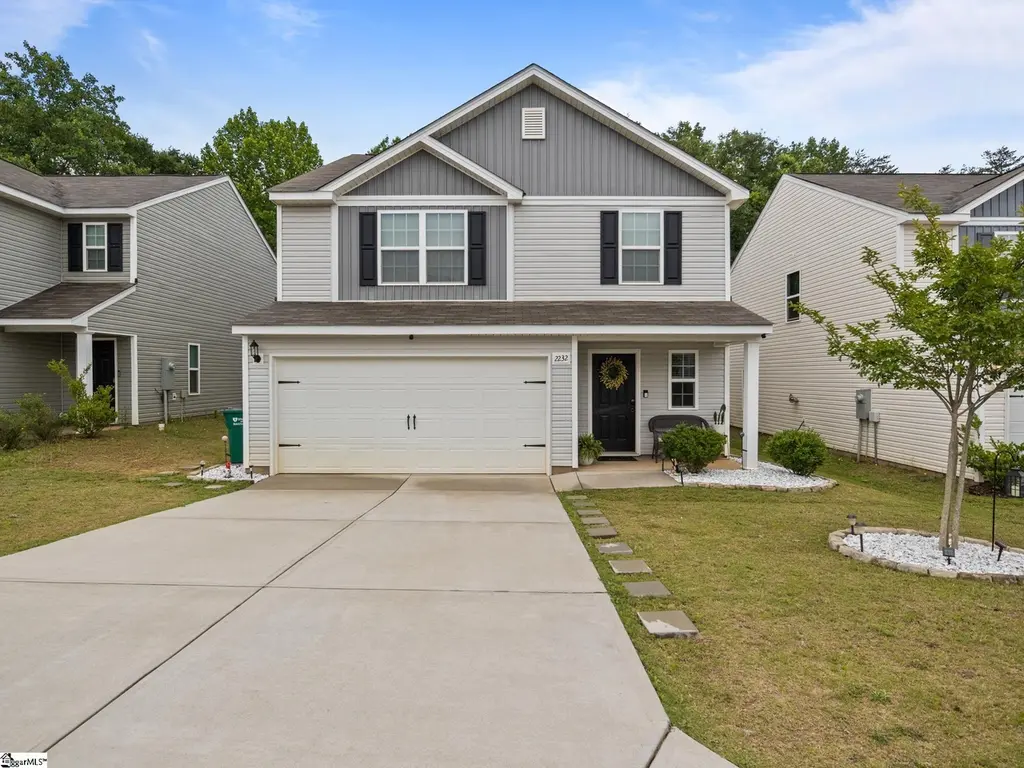
2232 Southlea Dr · Inman, SC
Flood risk 1/10 · Minimal
- FEMA flood zone
- X (unshaded)
- Chance of flooding over 30 yrs
- 0.0%
- Est. flood insurance / yr
- $507 – $1,088
Fire risk 4/10 · Minor
- Est. fire insurance / yr
- $783 – $1,453
Heat risk 5/10 · Moderate
- Hot days now (above 104°F)
- 7 days/yr
- Hot days in 30 yrs
- 16 days/yr
Wind risk 2/10 · Minimal
- Chance of severe wind over 30 yrs
- 1.0%
Air-quality risk 4/10 · Minor
- Unhealthy air days now
- 4 days/yr
- Unhealthy air days in 30 yrs
- 4 days/yr
Risk factors via First Street. Map © Google.
Why this score? — see what drove the D grade
The composite is a weighted blend of 9 inputs, each scored 0–100. Each bar is that input's sub-score; the figure is the points it added to the 100-point composite (weight × sub-score).
- Cash flow +15.0/30.0
- ARV discount +6.8/15.0
- DSCR +4.6/10.0
- Schools +4.5/10.0
- Livability +3.7/5.0
- 1% rule +3.4/10.0
- Rent growth +2.9/5.0
- Condition / age +2.5/5.0
- Appreciation +0.0/10.0
$260,000
🖨 Deal sheet 📄 Offer letter ✓ Due diligence
Listing remarks MLS
Welcome to this stunning property with a natural color palette that creates a warm and inviting atmosphere. The spacious kitchen is highlighted by a center island, perfect for meal prep. The master bedroom features a walk-in closet for ample storage space. Other rooms offers flexible living space to suit your needs. The primary bathroom provides good under sink storage. Don't miss out on this amazing opportunity to make this your dream home. This home has been virtually staged to illustrate its potential.
Key facts
- Ample cabinetry
- Dedicated coffee bar
- Large island
Tags
Property features AI
Finance
- Other: Residential property — discovery required
- HOA & community: Homeowners association present; HOA covers street lights, bylaws, and restrictive covenants; Community has lights and private roads
Exterior
- Parking: Attached 2-car garage; Paved concrete driveway
- Utilities: Public water; Public sewer; Electric water heater; Private garbage pickup
- Home design: Two-story residential property; Built in 2022; Storage in attic and garage; Slab foundation
- Construction: Vinyl siding exterior; Composition shingle roof
- Exterior features: Front porch; Thermal windows; Level lot; Lot one-half acre or less
Interior
- Kitchen: Dishwasher; Refrigerator; Smooth-top range; Built-in microwave; 12 x 12 kitchen
- Bedrooms: Primary bedroom on 2nd level with full bath, shower-only and walk-in closet; Bedroom sizes approximately 12 x 17, 12 x 12, 12 x 14, and 10 x 12
- Flooring: Luxury vinyl tile/plank
- Bathrooms: Two full bathrooms; One half bathroom
- Heating & cooling: Electric forced-air heating; Central electric cooling
- Interior features: Attic stairs (disappearing); Cable available; 9-foot-plus ceilings; Ceiling fans; Smooth ceilings; Granite countertops; Open floor plan; Smoke detector; Some window treatments; Walk-in closet; Pantry closet
- Laundry & utility: Laundry on 2nd floor in closet-style space; Washer connection; Electric dryer hookup
Neighborhood map
What this means for you Summary
Snapshot
- This is a 4-bed/2.5-bath single-family listed at $260k.
Deal economics
- At list price, monthly cash flow is $82 ($987/yr) — positive.
- The deal already cash-flows at list — no discount required.
- To meet the 1% rule (rent ≥ 1% of price), the offer needs to be $217k (16.5% below list).
- Recommended offer: $217k (16.5% below list) — sets the bar for 1% rule.
- Cap rate 6.7% vs local median 4.3% in Inman — top-decile yield for the area; either an underpriced asset or a hidden risk that comps aren't pricing in. Stress-test before assuming the spread holds.
Location & tenants
- Location reads 74/100 on livability (#29 in SC, #4,452 nationally) — a middle-class / working-renter tenant base. Strengths: cost of living A+, housing A+, health & safety A+; Watch: amenities D, commute F.
- Spartanburg 02 (suburban): math 49% / reading 56% proficiency, ranked #6 of 80 in SC (top 8%) — acceptable for families but not a draw, mixed tenant base, ~2y average lease.
- Zoned schools: James H. Hendrix Elementary (math 55% / reading 45%, grade D+, #163 of 597 statewide, top 28%, 694 students, 89% FRL) — zoned schools average 89% FRL vs 44% district-wide (44 pts higher); higher-poverty schools than district average — tighter screening recommended.
- Market conditions: Rents rising (+1.8%/yr); 693 active listings in the ZIP; 2 comparable units currently listed for rent nearby; solid renter incomes; 3,129 units permitted in Spartanburg County in 2024 (40 in 5+ unit buildings).
- This rent runs 34% of the median local income ($76k/yr) — at the standard rent-burdened threshold; future hikes will face affordability resistance.
Forward outlook
- Local home prices are declining (-3.0%/yr); year-one equity from $2k of loan paydown is wiped out by about $8k of value loss. Plan a longer hold.
- Spartanburg County population projected at +18% by 2050 — long-run rental-demand tailwind backs the buy-and-hold thesis.
Negotiation context
- Only 12 days on market — expect competitive offers; lowballing is unlikely to land.
- 11 sale attempts since 5y ago with the ask held roughly flat each time — persistent listings suggest the price (not the market) is what's stuck; bring a comps-based counter.
Risks & watch-outs
- Climate carrying-cost: extreme-heat days projected 7→16/yr by 2055 (HVAC capex compounding) — expect insurance premiums to compound above CPI over the hold.
Questions for the listing agent
- What does the HOA fee cover, when was the last increase, and are there any pending special assessments or reserve-fund shortfalls?
- Is there a deadline driving the sale (1031 exchange, divorce, estate, relocation)? That informs how much negotiation room exists.
- The area grade is low — what's the realistic commute time and amenity access for the typical tenant pool here? Any planned neighborhood developments (good or bad) we should know about?
- What's the average days-on-market for RENTAL listings here right now (not sales)? A rising rental-DOM trend means longer vacancies and softer asking-rent achievability than the comps imply.
- What's the recent tenant-quality profile in this submarket — average credit score on applications, eviction rate, late-payment / NSF rate, and stable-employment percentage? A property-management company in the area should have these aggregated.
- How much new for-sale + rental construction is in the pipeline within 1–3 miles? Heavy new supply typically softens prices + rents 12–24 months out; constrained supply supports both.
Investment metrics
- 1% rule
- 0.84% ✗
- Cap rate
- 6.67%
- Cash-on-cash
- 1.36%
- DSCR
- 1.06
- GRM
- 10.0
CMA / ARV
- ARV (on-the-fly)
- $255,940
- Comps found
- 12
Show comp detail 12 sales within ~0.75 mi
| Address | Dist | Beds/Ba | Sqft | Sold | Price | $/sf | Match |
|---|---|---|---|---|---|---|---|
| 1442 Cattleman Acres Dr Unit MD 166 Crane VE B | 0.12mi | 4/2.5 | 1,955 (+2%) | 2mo | $259,849 | $133 | 89 |
| 1471 Cattleman Acres Dr Unit MD 175 Crane VE C | 0.17mi | 4/2.5 | 1,955 (+2%) | 1mo | $262,499 | $134 | 87 |
| 4055 Rustling Grass Trl Unit MD 200 Crane VE B | 0.15mi | 4/2.5 | 1,955 (+2%) | 4mo | $258,508 | $132 | 86 |
| 4039 Rustling Grass Trl Unit MD 196 Crane VE A | 0.18mi | 4/2.5 | 1,955 (+2%) | 6mo | $269,999 | $138 | 83 |
| 2078 Southlea Dr | 0.28mi | 3/2.5 (-1) | 1,868 (-2%) | 1mo | $250,000 | $134 | 77 |
| 6090 Mason Tucker Dr | 0.05mi | 3/2.5 (-1) | 1,679 (-12%) | 5mo | $245,000 | $146 | 69 |
| 2014 Southlea Dr | 0.19mi | 3/2.5 (-1) | 1,704 (-11%) | 4mo | $253,000 | $148 | 65 |
| 556 Bailey Elizabeth Way | 0.32mi | 3/2.0 (-1) | 1,997 (+5%) | 9mo | $260,000 | $130 | 63 |
| 524 Bailey Elizabeth Way | 0.37mi | 3/2.5 (-1) | 2,015 (+6%) | 7mo | $257,000 | $128 | 62 |
| 416 N Ivestor Ct | 0.42mi | 3/2.5 (-1) | 1,703 (-11%) | 1mo | $259,250 | $152 | 57 |
| 523 Bailey Elizabeth Way | 0.35mi | 3/2.5 (-1) | 2,147 (+12%) | 6mo | $280,000 | $130 | 53 |
| 253 Highland Springs Loop | 0.65mi | 3/2.0 (-1) | 1,644 (-14%) | 6mo | $274,900 | $167 | 35 |
Match score weights: distance 35% · size 25% · config 20% · recency 20%. Top-matched comps best support the ARV.
Projected returns pro-forma
-3.0% appreciation · 1.79% rent growth · sell at horizon
- IRR
- -15.4%
- Equity multiple
- 0.46×
- Total profit
- $-39,572
- Equity at exit
- $38,767
- IRR
- -9.0%
- Equity multiple
- 0.47×
- Total profit
- $-38,450
- Equity at exit
- $22,480
Cash invested: $72,800 (down + closing). Projections, not guarantees.
Landlord ↔ Tenant lean methodology
- Overall (STATE)
- 90 Strongly Landlord-Friendly
- State South Carolina
- 90 Strongly Landlord-Friendly · R+6
- County
- — inherits STATE
- City
- — inherits STATE
ZIP-level market 29349
- Home prices YoY
- -31.8%
- Rents YoY
- 1.8%
- Active inventory
- 693
- Price-to-rent
- 10.0×
Monthly cashflow live
- Estimated rent
- $2,172 medium interval (Pro) →
- Mortgage (P&I)
- −$1,363
- Tax from tax record
- −$145 /mo · $1,736/yr
- Insurance
- −$108
- HOA
- −$17
- Vacancy / Maint / Mgmt
- −$456
- Net cashflow
- $82
Break-even live
UW: 25.0% down · 7.5% · 30yr · 1.5% tax · 5.0% vac · 8.0% maint · 8.0% mgmt
Financing live
Cash to close
- Down payment
- $65,000
- Closing costs
- $7,800
- Reserves months
- —
- Total cash needed
- —
Loan-product check · same deal, 3 products live
Conventional
25% down · 7.5% · 30yr
- Down + closing
- —
- Monthly P&I
- —
- Monthly cashflow
- —
- DSCR
- —
- Eligible?
- —
Personal DTI + credit; lowest rate.
DSCR
20% down · 8.5% · 30yr
- Down + closing
- —
- Monthly P&I
- —
- Monthly cashflow
- —
- DSCR
- —
- Eligible?
- —
No personal income docs; deal must DSCR.
Hard money
10% down · 12.0% · 12mo
- Down + closing
- —
- Monthly P&I
- —
- Monthly cashflow
- —
- DSCR
- —
- Eligible?
- —
Short-term bridge; refi at stabilization.
Rent comps 2 comps
| Address | Beds | Baths | Sqft | Rent | $/sqft | DOM | Units | Dist |
|---|---|---|---|---|---|---|---|---|
| 2118 Southlea Dr Inman, SC | 3.0 | 2.5 | 1915 | $1,749 | $0.91 | 13d | 1 | 0.27mi |
| 1202 Chelsey Ln Unit 1430 Inman, SC | 3.0 | 2.5 | 1366 | $1,650 | $1.21 | 20d | 1 | 1.14mi |
HOA detail
- Monthly dues
- $17 · $204/yr
Listing history 11 events
-
2026-06-18days on market $260,000 Active 12 DOM
-
2026-06-17days on market $260,000 Active 11 DOM
-
2026-06-16days on market $260,000 Active 10 DOM
-
2026-06-15days on market $260,000 Active 9 DOM
-
2026-06-14days on market $260,000 Active 7 DOM
-
2026-06-13days on market $260,000 Active 6 DOM
-
2026-06-10days on market $260,000 Active 4 DOM
-
2026-06-09days on market $260,000 Active 3 DOM
-
2026-06-08days on market $260,000 Active 2 DOM
-
2026-06-07remarks 699-char remark
-
2026-06-07$260,000 Active 1 DOM
ⓘ Source: listings_history table (triggers on properties + properties_extension) + one-shot
backfill from property_details.listing_events for pre-trigger history.
Tax reassessment forecast SC · Resets to sale price
- Current annual tax
- $1,736 · $145/mo
- Projected year-2 tax
- $1,736 · $145/mo
- Expected delta
- $0/yr ($0/mo · 0.0%)
ⓘ Screening estimate from a state-policy table — verify with the county assessor before closing.
Climate risk First Street
- Flood 1/10 Low FEMA zone X (unshaded) · 0% chance over 30 yrs
- Wildfire 4/10 Moderate
- Heat 5/10 Major 7 d/yr ≥104°F today · 16 d/yr by 30 yrs out
- Wind 2/10 Low 100% chance of damaging wind over 30 yrs
- Air quality 4/10 Moderate 4 unhealthy d/yr today · 4 by 30 yrs out
Nearby sold comps map
Loading sold comps map…
Walkable amenities ~0.75 mi
Loading nearby amenities…
Taxation est. · year 1
- Rental income
- $26,062
- − Mortgage interest
- −$14,564
- − Property taxes
- −$1,736
- − Insurance
- −$1,300
- − Repairs & maintenance
- −$2,085
- − Management
- −$2,085
- − HOA
- −$204
- − Depreciation
- −$7,564
- Taxable loss
- −$3,476
- Est. tax savings @ 24.0%
- +$834
- After-tax cash flow
- $1,821/yr
For passive investors: Depreciation is non-cash, so a rental often shows a tax loss while cash-flowing — sheltering income. Rental losses are passive: they offset passive income freely, and up to $25,000/yr can offset ordinary (W-2) income if you actively participate and your MAGI is under $100k (phasing out to $0 by $150k); unused losses carry forward. On sale, claimed depreciation is recaptured at up to 25%, and gains may owe capital-gains tax (a 1031 exchange can defer both). Figures are a year-1 estimate at your 24.0% rate — not tax advice; consult a CPA.
Schools (NCES district)
- District
- Spartanburg 02
- NCES district ID
- 4503510
- Math proficiency
- 49% ▼ -7.00%
- Reading proficiency
- 56% ▲ 2.00%
- Median HH income
- $49,591
- Composite
- 44.79/100
- National rank
- #2742
- State rank
- #6 of 80 in SC
Livability — Inman
- Score
- 74/100
- State rank
- #29
- US rank
- #4452
Category grades
Schools grade is shown separately in the Schools card above.
Census & demographics
- County
- Spartanburg County · 258,607 people
- City population
- 39,083
- Metro
- Spartanburg, SC
- Population (ZIP)
- 39,083
- Household income
- $76,168
- Rent vs Own
- Severe rent burden
- 271.0
Population outlook (Spartanburg County) Hauer SSP2
- Today (2025)
- 325,495 people
- By 2030
- 338,800 · +4.1%
- By 2040
- 363,471 · +11.7%
- By 2050
- 384,156 · +18.0%
- By 2075
- 430,137 · +32.1%
- By 2100
- 442,733 · +36.0%
Race, ethnicity, and origin ACS 2023
- Neighborhood character
- Predominantly White (80%)
- Race & ethnicity
- White 80% Black 9% Hispanic / Latino 6% Two or more races 4% Asian 2%
- Hispanic origin (detail)
- Mexican 5%
- Common ancestry
- Subsaharan African 6% Serbian 3% Scotch-Irish 3%
- Foreign-born
- 9% · Canada
- Languages at home
- 86% English-only · Russian/Polish/Slavic 7% Spanish 3% Other Asian/Pacific 2%
Political lean MEDSL · Spartanburg
- 2024 margin
- Solid R (+33.6) · D 32.6% · R 66.2% · Other 1.2%
- 2008→2024 swing
- -12.0pp toward R · 2008: -21.6pp · 2024: -33.6pp
- All cycles
- 2024: R+33.6 2020: R+27.3 2016: R+30.0 2012: R+23.1 2008: R+21.6
Not yet ingested
- Civics
- —
Market trends
- HPI YoY
- ▼ -113.67%
- Current HPI
- 244.0359
- Rent YoY
- ▲ 1.79%
- Metro
- Spartanburg, SC
- State GDP YoY
- ▲ 4.51%
- F500 in state
- 2
Industry mix (Fortune 500 HQ in SC)
| Industry | F500 HQs | Revenue |
|---|---|---|
| Packaging | 1 | $7B |
|
||
Price history
-70.2% since first listed51 events — show timeline
- 2026-06-06 Listed $260,000 Greater Greenville MLS
- 2024-09-03 Sold (MLS) $240,000 Greater Greenville MLS
- 2024-08-30 Sold (Public Records) $240,000 Public Records
- 2024-07-31 Pending — Greater Greenville MLS
- 2024-07-18 Price Changed $250,000 Greater Greenville MLS
- 2024-07-04 Price Changed $253,000 Greater Greenville MLS
- 2024-06-20 Price Changed $254,000 Greater Greenville MLS
- 2024-06-06 Price Changed $255,000 Greater Greenville MLS
- 2024-05-23 Price Changed $259,000 Greater Greenville MLS
- 2024-04-18 Price Changed $266,000 Greater Greenville MLS
- 2024-04-04 Price Changed $267,000 Greater Greenville MLS
- 2024-03-07 Price Changed $269,000 Greater Greenville MLS
- 2024-02-22 Listed $276,000 Greater Greenville MLS
- 2024-02-14 Sold (Public Records) $239,000 Public Records
- 2024-01-23 Delisted — SPMLS
- 2023-10-31 Listing Removed — WUMLS
- 2023-07-28 Listed $277,000 SPMLS
- 2023-07-18 Listing Removed — Greater Greenville MLS
- 2023-06-24 Price Changed $272,800 Greater Greenville MLS
- 2023-06-24 Price Changed $272,800 WUMLS
- 2023-05-06 Price Changed $273,000 Greater Greenville MLS
- 2023-05-06 Price Changed $273,000 WUMLS
- 2023-04-14 Price Changed $277,000 Greater Greenville MLS
- 2023-04-14 Price Changed $277,000 WUMLS
- 2023-04-03 Listed $285,000 WUMLS
- 2023-03-24 Listed $285,000 Greater Greenville MLS
- 2023-02-14 Price Changed $274,000 SPMLS
- 2022-12-27 Delisted — SPMLS
- 2022-12-22 Price Changed $280,000 SPMLS
- 2022-09-24 Price Changed $298,000 SPMLS
- 2022-09-23 Listed $290,000 SPMLS
- 2022-09-21 Delisted — SPMLS
- 2022-09-15 Delisted — SPMLS
- 2022-09-15 Listed $299,500 SPMLS
- 2022-08-26 Price Changed $314,500 SPMLS
- 2022-08-04 Price Changed $314,990 SPMLS
- 2022-08-02 Price Changed $318,900 SPMLS
- 2022-07-26 Listed $319,900 SPMLS
- 2022-03-18 Sold (MLS) $293,900 Greater Greenville MLS
- 2022-03-18 Sold (MLS) $293,900 SPMLS
- 2022-02-18 Pending — SPMLS
- 2022-02-18 Pending — Greater Greenville MLS
- 2022-01-26 Price Changed $293,900 SPMLS
- 2022-01-26 Price Changed $293,900 Greater Greenville MLS
- 2021-12-29 Listed $283,900 Greater Greenville MLS
- 2021-12-24 Price Changed $283,900 SPMLS
- 2021-12-23 Relisted — SPMLS
- 2021-10-27 Pending — SPMLS
- 2021-10-22 Price Changed $273,900 SPMLS
- 2021-10-15 Listed $268,900 SPMLS
- 2021-03-17 Sold (Public Records) $872,000 Public Records
Property tax history
+138.8%/yrLatest (2025): $1,736 · -17.2% YoY. Source: county tax records.
Cash-flow waterfall
monthlySold comps — $/sqft
last 12 mo · ≤1 miLoading sold comps…