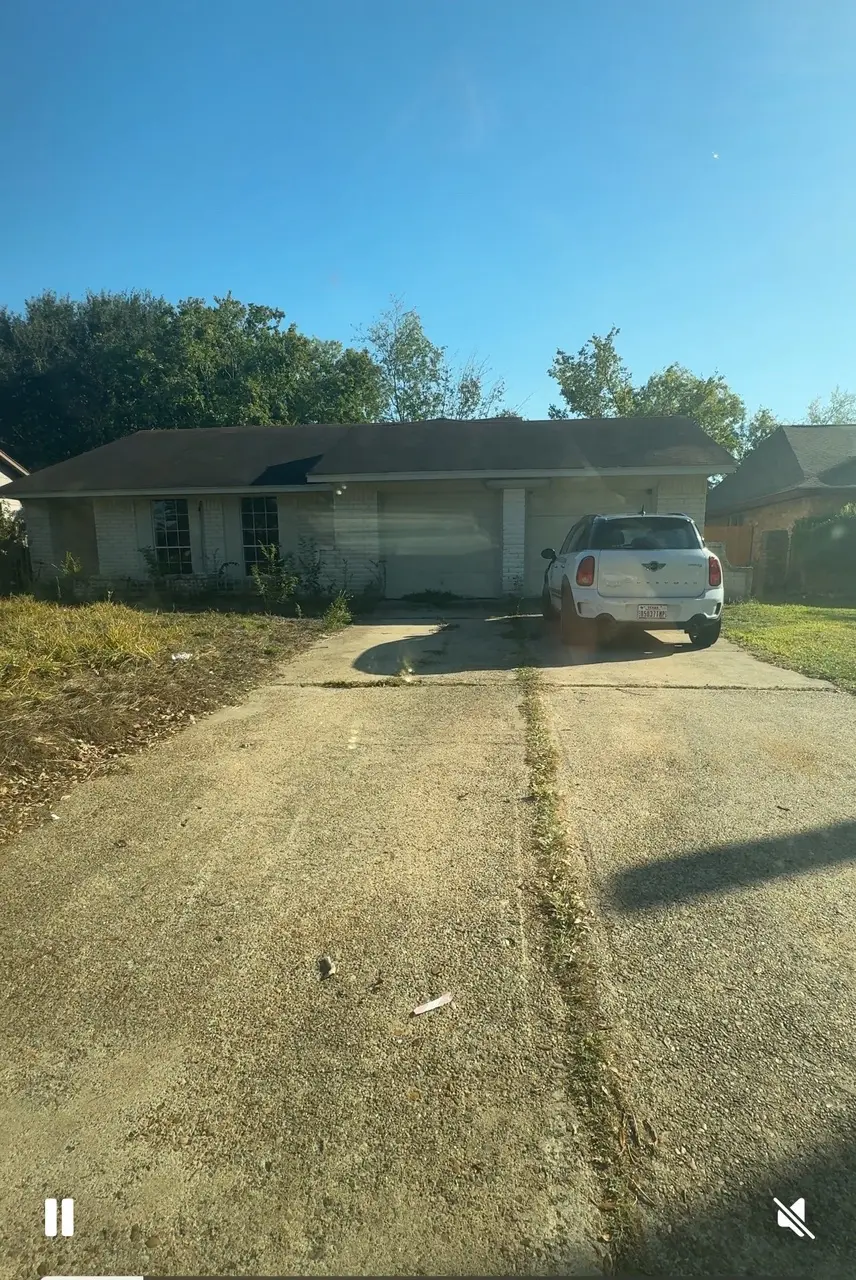
7707 Lumber Jack Dr · Houston, TX
Flood risk 4/10 · Minor
- FEMA flood zone
- X (unshaded)
- Chance of flooding over 30 yrs
- 0.2%
- Est. flood insurance / yr
- $507 – $1,088
Fire risk 1/10 · Minimal
- Est. fire insurance / yr
- $1,222 – $2,270
Heat risk 9/10 · Severe
- Hot days now (above 109°F)
- 7 days/yr
- Hot days in 30 yrs
- 23 days/yr
Wind risk 8/10 · Major
- Chance of severe wind over 30 yrs
- 99.0%
Air-quality risk 3/10 · Minor
- Unhealthy air days now
- 3 days/yr
- Unhealthy air days in 30 yrs
- 4 days/yr
Risk factors via First Street. Map © Google.
Why this score? — see what drove the D grade
The composite is a weighted blend of 9 inputs, each scored 0–100. Each bar is that input's sub-score; the figure is the points it added to the 100-point composite (weight × sub-score).
- ARV discount +15.0/15.0
- Cash flow +9.9/30.0
- 1% rule +5.0/10.0
- Livability +3.7/5.0
- DSCR +2.8/10.0
- Condition / age +2.5/5.0
- Rent growth +1.8/5.0
- Schools +1.5/10.0
- Appreciation +0.0/10.0
$169,000
🖨 Deal sheet (PDF) 📄 Offer letter ✓ Due diligence
Listing remarks MLS
3 bedroom and 2 bath home located in the quiet Woodland Oaks Subdivision. this 3-bedroom, 2-bath home offers 1,422 sq ft of living space. The property currently presents a prime opportunity for investors or buyers seeking a renovation project.
Key facts
- 6,786 sq ft lot
- 2 garage spots
- Built 1977
Neighborhood map
What this means for you Summary
Snapshot
- This is a 3-bed/2.0-bath single-family listed at $169k.
Deal economics
- At list price, monthly cash flow is $-106 ($-1k/yr) — negative.
- To cash-flow at today's rent, offer at most $150k (11.1% below list).
- To meet the 1% rule (rent ≥ 1% of price), the offer needs to be $168k (0.4% below list).
- Recommended offer: $149k (12.0% below list) — sets the bar for market timing.
- Cap rate 5.5% vs local median 3.2% in Houston — top-decile yield for the area; either an underpriced asset or a hidden risk that comps aren't pricing in. Stress-test before assuming the spread holds.
Location & tenants
- Location reads 74/100 on livability (#184 in TX, #4,771 nationally) — a middle-class / working-renter tenant base. Strengths: amenities A+, cost of living A+, housing A+; Watch: crime F.
- Aldine ISD (suburban): math 16% / reading 21% proficiency, ranked #790 of 826 in TX (top 96%) — low school quality limits family demand, transient renter base, plan for 1-2y turnover; 79% free/reduced lunch — lower-income household profile, screen leases tightly.
- Zoned schools: Ermel El (math 20% / reading 21%, grade F, #3,515 of 4,322 statewide, top 82%, 449 students, 92% FRL); Hoffman Middle (math 17% / reading 24%, grade F, #1,407 of 1,662 statewide, top 86%, 637 students, 91% FRL); Aldine H S (math 15% / reading 20%, grade F, #1,451 of 1,632 statewide, top 89%, 2,663 students, 94% FRL).
- Market conditions: Rents soft (-3.0%/yr); 186 active listings in the ZIP; 5 comparable units currently listed for rent nearby; rentals at typical pace (median 19d on market — plan ~3-4 weeks tenant-placement turnaround); 29,883 units permitted in Harris County in 2024 (8,621 in 5+ unit buildings).
- This rent runs 31% of the median local income ($65k/yr) — at the standard rent-burdened threshold; future hikes will face affordability resistance.
Forward outlook
- Local home prices are declining (-3.0%/yr); year-one equity from $1k of loan paydown is wiped out by about $5k of value loss. Plan a longer hold.
- Harris County population projected at +47% by 2050 — long-run rental-demand tailwind backs the buy-and-hold thesis.
Negotiation context
- It's been on market 201 days — a 12% lower offer ($149k) is reasonable based on typical stale-listing flexibility.
- Current owner paid $45k; list at $169k implies a 278% gain — meaningful room to come down on a strong offer.
Risks & watch-outs
- Watch-outs: property tax is 3.3% of price.
- Climate carrying-cost: severe wind risk, 99% chance of damaging wind over 30y; extreme-heat days projected 7→23/yr by 2055 (HVAC capex compounding) — expect insurance premiums to compound above CPI over the hold.
Questions for the listing agent
- What do current leases actually rent for vs. the listed asking? Can we see a recent rent roll and the last 12 months of T-12 income?
- It's been on market 201 days. Have you received any prior offers? Is the seller open to a 12% concession, seller financing, or rate buy-down credit?
- Built in 1977 — when were the roof, HVAC, electrical panel, plumbing, and water heater last replaced?
- Property tax is high relative to price — has the assessment been appealed recently, and will the sale trigger a re-assessment?
- What does the HOA fee cover, when was the last increase, and are there any pending special assessments or reserve-fund shortfalls?
- Why hasn't it sold? Are there any deal-killer items the seller is aware of (foundation, flood, title, zoning, code violations)?
- Is there a deadline driving the sale (1031 exchange, divorce, estate, relocation)? That informs how much negotiation room exists.
- Schools are D-rated, which usually means shorter tenancies and higher turnover. Who's the typical renter profile here, and what's been the actual vacancy rate?
- Crime grade is F in this area — have there been break-ins, vandalism, or insurance claims at this property in the last 3 years? What carrier currently insures it and at what premium?
- The area grade is low — what's the realistic commute time and amenity access for the typical tenant pool here? Any planned neighborhood developments (good or bad) we should know about?
- What's the average days-on-market for RENTAL listings here right now (not sales)? A rising rental-DOM trend means longer vacancies and softer asking-rent achievability than the comps imply.
- What's the recent tenant-quality profile in this submarket — average credit score on applications, eviction rate, late-payment / NSF rate, and stable-employment percentage? A property-management company in the area should have these aggregated.
- How much new for-sale + rental construction is in the pipeline within 1–3 miles? Heavy new supply typically softens prices + rents 12–24 months out; constrained supply supports both.
Investment metrics
- 1% rule
- 1.00% ✗
- Cap rate
- 5.54%
- Cash-on-cash
- -2.69%
- DSCR
- 0.88
- GRM
- 8.4
CMA / ARV
- ARV (median comp)
- $209,603
- List price
- $169,000
- Delta
- -19.37%
- Verdict
- UNDERPRICED
- Comps
- 20 within 1.0 mi
Show comp detail 12 sales within ~0.75 mi
| Address | Dist | Beds/Ba | Sqft | Sold | Price | $/sf | Match |
|---|---|---|---|---|---|---|---|
| 7707 Lumber Jack Dr | 0.00mi | 3/2.0 | 1,422 (0%) | 1mo | $169,000 | $119 | 100 |
| 7823 Lumber Jack Drive Dr | 0.14mi | 3/2.0 | 1,379 (-3%) | 2mo | $205,000 | $149 | 87 |
| 7306 Log Hollow Dr | 0.37mi | 3/2.0 | 1,445 (+2%) | 2mo | $257,900 | $178 | 79 |
| 7935 Yellow Pine Dr | 0.40mi | 3/2.0 | 1,379 (-3%) | 0mo | $195,000 | $141 | 76 |
| 7818 Kellwood Dr | 0.57mi | 3/2.0 | 1,404 (-1%) | 1mo | $240,000 | $171 | 71 |
| 7210 Lumber Jack Dr | 0.42mi | 3/2.0 | 1,500 (+6%) | 1mo | $225,000 | $150 | 70 |
| 7102 Log Hollow Dr | 0.60mi | 3/2.0 | 1,419 (-0%) | 2mo | $249,900 | $176 | 70 |
| 7727 Log Hollow Dr | 0.16mi | 3/2.0 | 1,624 (+14%) | 1mo | $160,000 | $99 | 68 |
| 7731 Deadwood Dr | 0.41mi | 3/2.0 | 1,307 (-8%) | 3mo | $210,000 | $161 | 65 |
| 7843 Yellow Pine Dr | 0.19mi | 3/2.5 | 1,627 (+14%) | 2mo | $215,000 | $132 | 64 |
| 7611 Woodland West Dr | 0.71mi | 3/2.0 | 1,340 (-6%) | 1mo | $239,999 | $179 | 57 |
| 7410 Pierrepont Dr | 0.64mi | 3/2.0 | 1,558 (+10%) | 1mo | $249,900 | $160 | 53 |
Match score weights: distance 35% · size 25% · config 20% · recency 20%. Top-matched comps best support the ARV.
Projected returns pro-forma
-3.0% appreciation · 0.0% rent growth · sell at horizon
- IRR
- -24.9%
- Equity multiple
- 0.18×
- Total profit
- $-38,893
- Equity at exit
- $25,198
- IRR
- -38.4%
- Equity multiple
- -0.29×
- Total profit
- $-60,873
- Equity at exit
- $14,612
Cash invested: $47,320 (down + closing). Projections, not guarantees.
Landlord ↔ Tenant lean methodology
- Overall (STATE)
- 87 Strongly Landlord-Friendly
- State Texas
- 87 Strongly Landlord-Friendly · R+5
- County
- — inherits STATE
- City
- — inherits STATE
ZIP-level market 77040
- Rents YoY
- -3.0%
- Active inventory
- 186
- Price-to-rent
- 8.4×
Monthly cashflow live
- Estimated rent
- $1,684 high interval (Pro) →
- Mortgage (P&I)
- −$886
- Tax from tax record
- −$468 /mo · $5,613/yr
- Insurance
- −$70
- HOA
- −$12
- Vacancy / Maint / Mgmt
- −$354
- Net cashflow
- $-106
Break-even live
Sensitivity live
| Price | -10% $-11 | -5% $-58 | +0% $-106 | +5% $-154 | +10% $-202 |
|---|---|---|---|---|---|
| Rent | -10% $-239 | -5% $-173 | +0% $-106 | +5% $-40 | +10% $27 |
| Rate | -1.0pp $-21 | -0.5pp $-63 | base $-106 | +0.5pp $-150 | +1.0pp $-195 |
UW: 25.0% down · 7.5% · 30yr · 1.5% tax · 5.0% vac · 8.0% maint · 8.0% mgmt
Financing live
Cash to close
- Down payment
- $42,250
- Closing costs
- $5,070
- Reserves months
- —
- Total cash needed
- —
Loan-product check · same deal, 3 products live
Conventional
25% down · 7.5% · 30yr
- Down + closing
- —
- Monthly P&I
- —
- Monthly cashflow
- —
- DSCR
- —
- Eligible?
- —
Personal DTI + credit; lowest rate.
DSCR
20% down · 8.5% · 30yr
- Down + closing
- —
- Monthly P&I
- —
- Monthly cashflow
- —
- DSCR
- —
- Eligible?
- —
No personal income docs; deal must DSCR.
Hard money
10% down · 12.0% · 12mo
- Down + closing
- —
- Monthly P&I
- —
- Monthly cashflow
- —
- DSCR
- —
- Eligible?
- —
Short-term bridge; refi at stabilization.
Rent comps 5 comps
| Address | Beds | Baths | Sqft | Rent | $/sqft | DOM | Units | Dist |
|---|---|---|---|---|---|---|---|---|
| 7058 W Gulf Bank Rd Houston, TX | 2.0 | 2.0–2.5 | 870 | $1,364 | $1.57 | 5d | 3 | 0.77mi |
| 6807 Ashland Forest Dr Houston, TX | 3.0 | 2.0 | 1790 | $1,850 | $1.03 | 45d | 1 | 1.07mi |
| 7740 W Little York Rd Houston, TX | 1.0–3.0 | 1.0–2.0 | 1325 | $1,916 | $1.45 | 0d | 53 | 1.31mi |
| 7846 W Little York Rd Houston, TX | 3.0 | 2.0 | 1647 | $1,549 | $0.94 | 26d | 1 | 1.44mi |
| 8515 Bartletts Harbor Ct Houston, TX | 3.0 | 2.5 | 1812 | $1,989 | $1.10 | 18d | 1 | 1.45mi |
HOA detail
- Monthly dues
- $12 · $144/yr
Listing history 5 events
-
2026-06-01days on market $169,000 Pending 201 DOM
-
2026-05-31days on market $169,000 Pending 200 DOM
-
2026-05-07status Pending 243-char remark
Show marketing remark (243 chars)
3 bedroom and 2 bath home located in the quiet Woodland Oaks Subdivision. this 3-bedroom, 2-bath home offers 1,422 sq ft of living space. The property currently presents a prime opportunity for investors or buyers seeking a renovation project.
-
2025-11-12$169,000 Active 243-char remark
Show marketing remark (243 chars)
3 bedroom and 2 bath home located in the quiet Woodland Oaks Subdivision. this 3-bedroom, 2-bath home offers 1,422 sq ft of living space. The property currently presents a prime opportunity for investors or buyers seeking a renovation project.
-
1991-11-18soldstatus $44,700
ⓘ Source: listings_history table (triggers on properties + properties_extension) + one-shot
backfill from property_details.listing_events for pre-trigger history.
Tax reassessment forecast TX · Resets to sale price
- Current annual tax
- $5,613 · $468/mo
- Projected year-2 tax
- $5,613 · $468/mo
- Expected delta
- $0/yr ($0/mo · 0.0%)
ⓘ Screening estimate from a state-policy table — verify with the county assessor before closing.
Climate risk First Street
- Flood 4/10 Moderate FEMA zone X (unshaded) · 20% chance over 30 yrs
- Wildfire 1/10 Low
- Heat 9/10 Extreme 7 d/yr ≥109°F today · 23 d/yr by 30 yrs out
- Wind 8/10 Severe 99% chance of damaging wind over 30 yrs
- Air quality 3/10 Moderate 3 unhealthy d/yr today · 4 by 30 yrs out
Nearby sold comps map
Loading sold comps map…
Walkable amenities ~0.75 mi
Loading nearby amenities…
Taxation est. · year 1
- Rental income
- $20,206
- − Mortgage interest
- −$9,467
- − Property taxes
- −$5,613
- − Insurance
- −$845
- − Repairs & maintenance
- −$1,616
- − Management
- −$1,616
- − HOA
- −$144
- − Depreciation
- −$4,916
- Taxable loss
- −$4,012
- Est. tax savings @ 24.0%
- +$963
- After-tax cash flow
- $-311/yr
For passive investors: Depreciation is non-cash, so a rental often shows a tax loss while cash-flowing — sheltering income. Rental losses are passive: they offset passive income freely, and up to $25,000/yr can offset ordinary (W-2) income if you actively participate and your MAGI is under $100k (phasing out to $0 by $150k); unused losses carry forward. On sale, claimed depreciation is recaptured at up to 25%, and gains may owe capital-gains tax (a 1031 exchange can defer both). Figures are a year-1 estimate at your 24.0% rate — not tax advice; consult a CPA.
Schools (NCES district)
- District
- Aldine ISD
- NCES district ID
- 4807710
- Math proficiency
- 16% ▼ -23.00%
- Reading proficiency
- 21% ▼ -11.00%
- Median HH income
- $37,081
- Composite
- 15.42/100
- National rank
- #9317
- State rank
- #790 of 826 in TX
Livability — Houston
- Score
- 74/100
- State rank
- #184
- US rank
- #4771
Category grades
Schools grade is shown separately in the Schools card above.
Census & demographics
- Census place
- Houston, TX
- County
- Harris County · 4,702,590 people
- City population
- 3,226,434
- Metro
- Houston-The Woodlands-Sugar Land, TX
- Population (ZIP)
- 50,977
- Household income
- $65,028
- Rent vs Own
- Severe rent burden
- 2785.0
Population outlook (Harris County) Hauer SSP2
- Today (2025)
- 5,571,493 people
- By 2030
- 6,089,821 · +9.3%
- By 2040
- 7,142,806 · +28.2%
- By 2050
- 8,185,864 · +46.9%
- By 2075
- 10,574,329 · +89.8%
- By 2100
- 12,109,958 · +117.4%
Race, ethnicity, and origin ACS 2023
- Neighborhood character
- Diverse neighborhood (Simpson 0.65)
- Race & ethnicity
- Hispanic / Latino 53% White 21% Two or more races 19% Black 15% Asian 8% Native American 2%
- Hispanic origin (detail)
- Mexican 35% Puerto Rican 2% Cuban 1%
- Common ancestry
- Romanian 2% Lithuanian 1% Italian 1%
- Foreign-born
- 31% · Canada, Vietnam, Jamaica
- Languages at home
- 48% English-only · Spanish 43% Vietnamese 6% Other Asian/Pacific 1%
Political lean MEDSL · Harris
- 2024 margin
- Lean D (+5.5) · D 52.0% · R 46.4% · Other 1.6%
- 2008→2024 swing
- +3.9pp toward D · 2008: 1.6pp · 2024: 5.5pp
- All cycles
- 2024: D+5.5 2020: D+13.3 2016: D+12.4 2012: D+0.1 2008: D+1.6
Not yet ingested
- Civics
- —
Market trends
- HPI YoY
- ▼ -176.41%
- Current HPI
- 240.6178
- Rent YoY
- ▼ -2.97%
- Metro
- Houston-The Woodlands-Sugar Land, TX
- State GDP YoY
- ▲ 3.95%
- F500 in state
- 110
Industry mix (Fortune 500 HQ in TX)
| Industry | F500 HQs | Revenue |
|---|---|---|
| Energy | 16 | $1,198B |
|
||
| Technology | 5 | $198B |
|
||
| Engineering / Construction | 4 | $72B |
|
||
| Energy Services | 3 | $60B |
|
||
| Utilities | 3 | $41B |
|
||
| Healthcare | 2 | $330B |
|
||
Price history
+278.1% since first listed3 events — show timeline
- 2026-05-07 Pending — HARMLS
- 2025-11-12 Listed $169,000 HARMLS
- 1991-11-18 Sold (Public Records) $44,700 Public Records
Property tax history
+9.5%/yrLatest (2025): $5,613 · +53.5% YoY. Source: county tax records.
Cash-flow waterfall
monthlySold comps — $/sqft
last 12 mo · ≤1 miLoading sold comps…