 🏷️ Likely Rental
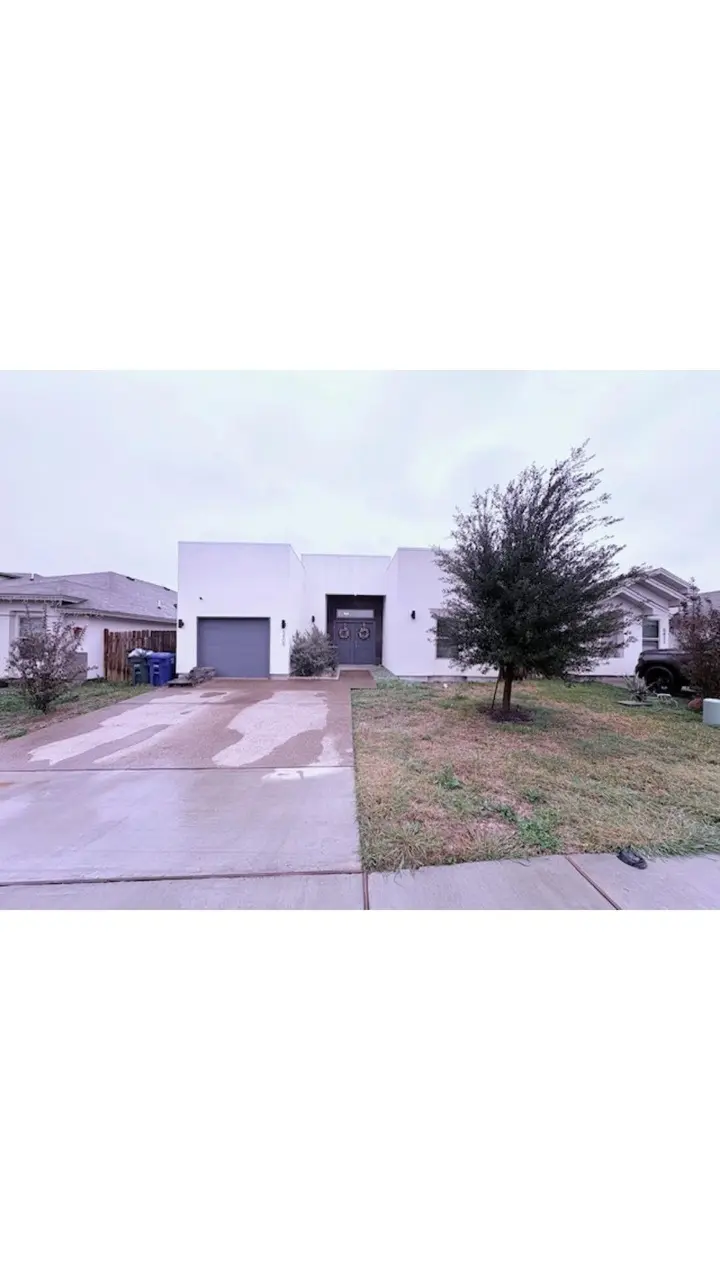
5409 Alamosa Ct · Laredo, TX
Flood risk 3/10 · Minor
- FEMA flood zone
- X (unshaded)
- Chance of flooding over 30 yrs
- 0.1%
- Est. flood insurance / yr
- $507 – $1,088
Fire risk 5/10 · Moderate
- Est. fire insurance / yr
- $1,222 – $2,270
Heat risk 8/10 · Major
- Hot days now (above 110°F)
- 7 days/yr
- Hot days in 30 yrs
- 24 days/yr
Wind risk 8/10 · Major
- Chance of severe wind over 30 yrs
- 80.0%
Air-quality risk 1/10 · Minimal
- Unhealthy air days now
- 0 days/yr
- Unhealthy air days in 30 yrs
- 0 days/yr
Risk factors via First Street. Map © Google.
Why this score? — see what drove the D grade
The composite is a weighted blend of 9 inputs, each scored 0–100. Each bar is that input's sub-score; the figure is the points it added to the 100-point composite (weight × sub-score).
- Cash flow +15.0/30.0
- ARV discount +7.5/15.0
- 1% rule +5.0/10.0
- DSCR +5.0/10.0
- Livability +3.7/5.0
- Schools +2.8/10.0
- Rent growth +2.5/5.0
- Condition / age +2.5/5.0
- Appreciation +0.0/10.0
$2,000
🖨 Deal sheet 📄 Offer letter ✓ Due diligence
Listing remarks MLS
Welcome to this Beautifully custom crafted RE Signature built home located in south Laredo. Featuring 4 spacious bedroom and 2 full baths, this residence officer the perfect blend of style, comfort, and quality craftsmanship. High ceilings throughout, with a cement slab ready for a palapa in the back yard.
Key facts
- 4,600 sq ft lot
- Garage
- Built 2021
Neighborhood map
What this means for you Summary
Snapshot
- This is a 4-bed/2.0-bath single-family listed at $2k.
Deal economics
- At list price, monthly cash flow is $1k ($17k/yr) — positive.
- The deal already cash-flows at list — no discount required.
- Meets the 1% rule at list price ($2k rent vs $2k).
- Recommended offer: $2k (6.0% below list) — sets the bar for market timing.
- Cap rate 854.6% vs local median 4.1% in Laredo — top-decile yield for the area; either an underpriced asset or a hidden risk that comps aren't pricing in. Stress-test before assuming the spread holds.
Location & tenants
- Location reads 73/100 on livability (#227 in TX) — a middle-class / working-renter tenant base. Strengths: cost of living A+, housing A+, health & safety A+; Watch: schools C-, crime C-, employment D+.
- United ISD (urban): math 27% / reading 38% proficiency, ranked #568 of 826 in TX (top 69%) — families likely to look elsewhere, expect single-tenant / working-renter base with shorter leases; 72% free/reduced lunch — lower-income household profile, screen leases tightly.
- Market conditions: 482 active listings in the ZIP; 8 comparable units currently listed for rent nearby; rentals lingering (median 44d on market — plan ~5-8 weeks vacancy on turnover, expect pricing pressure); 100% of comp listings sitting > 30 days — soft ceiling on asking rent; 1,448 units permitted in Webb County in 2024 (245 in 5+ unit buildings).
Forward outlook
- Local home prices are declining (-3.0%/yr); year-one equity from $14 of loan paydown is wiped out by about $60 of value loss. Plan a longer hold.
- Webb County population projected at +23% by 2050 — long-run rental-demand tailwind backs the buy-and-hold thesis.
- At projected returns (-3.0% appreciation + 3.0% rent growth), your $560 cash investment doubles in ~1 year — after that, you're playing with house money.
Negotiation context
- It's been on market 71 days — a 6% lower offer ($2k) is reasonable based on typical stale-listing flexibility.
- 2 sale attempts with the ask held roughly flat each time — persistent listings suggest the price (not the market) is what's stuck; bring a comps-based counter.
Risks & watch-outs
- Climate carrying-cost: severe wind risk, 80% chance of damaging wind over 30y; moderate wildfire risk; extreme-heat days projected 7→24/yr by 2055 (HVAC capex compounding) — expect insurance premiums to compound above CPI over the hold.
Questions for the listing agent
- It's been on market 71 days. Have you received any prior offers? Is the seller open to a 6% concession, seller financing, or rate buy-down credit?
- Why hasn't it sold? Are there any deal-killer items the seller is aware of (foundation, flood, title, zoning, code violations)?
- Is there a deadline driving the sale (1031 exchange, divorce, estate, relocation)? That informs how much negotiation room exists.
- The area grade is low — what's the realistic commute time and amenity access for the typical tenant pool here? Any planned neighborhood developments (good or bad) we should know about?
- What's the average days-on-market for RENTAL listings here right now (not sales)? A rising rental-DOM trend means longer vacancies and softer asking-rent achievability than the comps imply.
- What's the recent tenant-quality profile in this submarket — average credit score on applications, eviction rate, late-payment / NSF rate, and stable-employment percentage? A property-management company in the area should have these aggregated.
- How much new for-sale + rental construction is in the pipeline within 1–3 miles? Heavy new supply typically softens prices + rents 12–24 months out; constrained supply supports both.
Investment metrics
- 1% rule
- 90.35% ✓
- Cap rate
- 854.56%
- Cash-on-cash
- 3029.53%
- DSCR
- 135.80
- GRM
- 0.1
CMA / ARV
- ARV (median comp)
- $208,852
- List price
- $2,000
- Delta
- -99.04%
- Verdict
- UNDERPRICED
- Comps
- 3 within 1.0 mi
Projected returns pro-forma
-3.0% appreciation · 3.0% rent growth · sell at horizon
- IRR
- —
- Equity multiple
- 161.26×
- Total profit
- $89,748
- Equity at exit
- $298
- IRR
- —
- Equity multiple
- 347.80×
- Total profit
- $194,208
- Equity at exit
- $173
Cash invested: $560 (down + closing). Projections, not guarantees.
Landlord ↔ Tenant lean methodology
- Overall (STATE)
- 87 Strongly Landlord-Friendly
- State Texas
- 87 Strongly Landlord-Friendly · R+5
- County
- — inherits STATE
- City
- — inherits STATE
ZIP-level market 78046
- Home prices YoY
- -13.0%
- Active inventory
- 482
- Price-to-rent
- 0.1×
Monthly cashflow live
- Estimated rent
- $1,807 high interval (Pro) →
- Mortgage (P&I)
- −$10
- Tax est. 1.5%
- −$2 /mo · $30/yr
- Insurance
- −$1
- HOA
- −$0
- Vacancy / Maint / Mgmt
- −$379
- Net cashflow
- $1,414
Break-even live
UW: 25.0% down · 7.5% · 30yr · 1.5% tax · 5.0% vac · 8.0% maint · 8.0% mgmt
Financing live
Cash to close
- Down payment
- $500
- Closing costs
- $60
- Reserves months
- —
- Total cash needed
- —
Loan-product check · same deal, 3 products live
Conventional
25% down · 7.5% · 30yr
- Down + closing
- —
- Monthly P&I
- —
- Monthly cashflow
- —
- DSCR
- —
- Eligible?
- —
Personal DTI + credit; lowest rate.
DSCR
20% down · 8.5% · 30yr
- Down + closing
- —
- Monthly P&I
- —
- Monthly cashflow
- —
- DSCR
- —
- Eligible?
- —
No personal income docs; deal must DSCR.
Hard money
10% down · 12.0% · 12mo
- Down + closing
- —
- Monthly P&I
- —
- Monthly cashflow
- —
- DSCR
- —
- Eligible?
- —
Short-term bridge; refi at stabilization.
Rent comps 8 comps
| Address | Beds | Baths | Sqft | Rent | $/sqft | DOM | Units | Dist |
|---|---|---|---|---|---|---|---|---|
| 1025 La Muralla St Laredo, TX | 4.0 | 2.0 | 1500 | $1,950 | $1.30 | 43d | 1 | 0.14mi |
| 1021 Savannah Loop Laredo, TX | 3.0 | 2.5 | 1096 | $1,650 | $1.51 | 44d | 1 | 0.27mi |
| 402 Prescott Loop Laredo, TX | 3.0 | 2.0 | 1122 | $1,550 | $1.38 | 43d | 1 | 0.66mi |
| 1606 Coba Dr Laredo, TX | 4.0 | 2.0 | 1671 | $1,800 | $1.08 | 43d | 1 | 0.79mi |
| 1610 Coba Dr Unit 1 Laredo, TX | 3.0 | 2.0 | 1643 | $1,750 | $1.07 | 43d | 1 | 0.79mi |
| 1612 Cordova Dr Laredo, TX | 3.0 | 2.0 | 1657 | $1,750 | $1.06 | 43d | 1 | 0.84mi |
| 1426 Los Estribos Dr Laredo, TX | 3.0 | 2.0 | 1492 | $1,900 | $1.27 | 43d | 1 | 1.13mi |
| 3411 Morelos Dr Laredo, TX | 3.0 | 2.0 | 1066 | $1,400 | $1.31 | 43d | 1 | 1.47mi |
Listing history 20 events
-
2026-06-19days on market $2,000 Active 71 DOM
-
2026-06-18days on market $2,000 Active 70 DOM
-
2026-06-17days on market $2,000 Active 69 DOM
-
2026-06-16days on market $2,000 Active 68 DOM
-
2026-06-15days on market $2,000 Active 67 DOM
-
2026-06-14days on market $2,000 Active 65 DOM
-
2026-06-13days on market $2,000 Active 64 DOM
-
2026-06-10days on market $2,000 Active 62 DOM
-
2026-06-09days on market $2,000 Active 61 DOM
-
2026-06-08days on market $2,000 Active 60 DOM
-
2026-06-07days on market $2,000 Active 59 DOM
-
2026-06-03days on market $2,000 Active 55 DOM
-
2026-06-02days on market $2,000 Active 54 DOM
-
2026-06-01days on market $2,000 Active 53 DOM
-
2026-05-31days on market $2,000 Active 52 DOM
-
2026-05-30days on market $2,000 Active 51 DOM
-
2026-04-09$2,000 Active
Show marketing remark (307 chars)
Welcome to this Beautifully custom crafted RE Signature built home located in south Laredo. Featuring 4 spacious bedroom and 2 full baths, this residence officer the perfect blend of style, comfort, and quality craftsmanship. High ceilings throughout, with a cement slab ready for a palapa in the back yard.
-
2026-04-09price $250,000 307-char remark
Show marketing remark (307 chars)
Welcome to this Beautifully custom crafted RE Signature built home located in south Laredo. Featuring 4 spacious bedroom and 2 full baths, this residence officer the perfect blend of style, comfort, and quality craftsmanship. High ceilings throughout, with a cement slab ready for a palapa in the back yard.
-
2026-02-27price $260,000 307-char remark
Show marketing remark (307 chars)
Welcome to this Beautifully custom crafted RE Signature built home located in south Laredo. Featuring 4 spacious bedroom and 2 full baths, this residence officer the perfect blend of style, comfort, and quality craftsmanship. High ceilings throughout, with a cement slab ready for a palapa in the back yard.
-
2026-01-30$269,000 Active 307-char remark
Show marketing remark (307 chars)
Welcome to this Beautifully custom crafted RE Signature built home located in south Laredo. Featuring 4 spacious bedroom and 2 full baths, this residence officer the perfect blend of style, comfort, and quality craftsmanship. High ceilings throughout, with a cement slab ready for a palapa in the back yard.
ⓘ Source: listings_history table (triggers on properties + properties_extension) + one-shot
backfill from property_details.listing_events for pre-trigger history.
Climate risk First Street
- Flood 3/10 Moderate FEMA zone X (unshaded) · 10% chance over 30 yrs
- Wildfire 5/10 Major
- Heat 8/10 Severe 7 d/yr ≥110°F today · 24 d/yr by 30 yrs out
- Wind 8/10 Severe 80% chance of damaging wind over 30 yrs
- Air quality 1/10 Low 0 unhealthy d/yr today · 0 by 30 yrs out
Nearby sold comps map
Loading sold comps map…
Walkable amenities ~0.75 mi
Loading nearby amenities…
Taxation est. · year 1
- Rental income
- $21,685
- − Mortgage interest
- −$112
- − Property taxes
- −$30
- − Insurance
- −$10
- − Repairs & maintenance
- −$1,735
- − Management
- −$1,735
- − Depreciation
- −$58
- Taxable income
- $18,005
- Est. tax owed @ 24.0%
- −$4,321
- After-tax cash flow
- $12,644/yr
For passive investors: Depreciation is non-cash, so a rental often shows a tax loss while cash-flowing — sheltering income. Rental losses are passive: they offset passive income freely, and up to $25,000/yr can offset ordinary (W-2) income if you actively participate and your MAGI is under $100k (phasing out to $0 by $150k); unused losses carry forward. On sale, claimed depreciation is recaptured at up to 25%, and gains may owe capital-gains tax (a 1031 exchange can defer both). Figures are a year-1 estimate at your 24.0% rate — not tax advice; consult a CPA.
Schools (NCES district)
- District
- United ISD
- NCES district ID
- 4843650
- Math proficiency
- 27% ▼ -36.00%
- Reading proficiency
- 38% ▼ -11.00%
- Median HH income
- $47,780
- Composite
- 28.02/100
- National rank
- #6848
- State rank
- #568 of 826 in TX
Livability — Laredo
- Score
- 73/100
- State rank
- #227
- US rank
- #5399
Category grades
Schools grade is shown separately in the Schools card above.
Census & demographics
- Census place
- Laredo, TX
- City population
- 67,333
- Population (ZIP)
- 71,965
Population outlook (Webb County) Hauer SSP2
- Today (2025)
- 301,387 people
- By 2030
- 316,307 · +5.0%
- By 2040
- 345,636 · +14.7%
- By 2050
- 370,647 · +23.0%
- By 2075
- 413,907 · +37.3%
- By 2100
- 416,458 · +38.2%
Race, ethnicity, and origin ACS 2023
- Neighborhood character
- Predominantly Hispanic (97%)
- Race & ethnicity
- Hispanic / Latino 97% Two or more races 53% White 2%
- Hispanic origin (detail)
- Mexican 92%
- Foreign-born
- 22% · Canada
- Languages at home
- 9% English-only · Spanish 91%
Political lean MEDSL · Webb
- 2024 margin
- Toss-up / Even · D 48.5% · R 50.7%
- 2008→2024 swing
- -45.6pp toward R · 2008: 43.4pp · 2024: -2.2pp
- All cycles
- 2024: R+2.2 2020: D+23.3 2016: D+51.6 2012: D+54.0 2008: D+43.4
Not yet ingested
- Civics
- —
Market trends
- HPI YoY
- ▼ -29.36%
- Current HPI
- 196.8153
- Rent YoY
- —
- Metro
- —
- State GDP YoY
- ▲ 3.95%
- F500 in state
- 110
Industry mix (Fortune 500 HQ in TX)
| Industry | F500 HQs | Revenue |
|---|---|---|
| Energy | 16 | $1,198B |
|
||
| Technology | 5 | $198B |
|
||
| Engineering / Construction | 4 | $72B |
|
||
| Energy Services | 3 | $60B |
|
||
| Utilities | 3 | $41B |
|
||
| Healthcare | 2 | $330B |
|
||
Price history
-99.3% since first listed4 events — show timeline
- 2026-04-09 Listed $2,000 LAOR
- 2026-04-09 Price Changed $250,000 LAOR
- 2026-02-27 Price Changed $260,000 LAOR
- 2026-01-30 Listed $269,000 LAOR
Property tax history
+63.0%/yrLatest (2025): $4,712 · -0.8% YoY. Source: county tax records.
Cash-flow waterfall
monthlySold comps — $/sqft
last 12 mo · ≤1 miLoading sold comps…