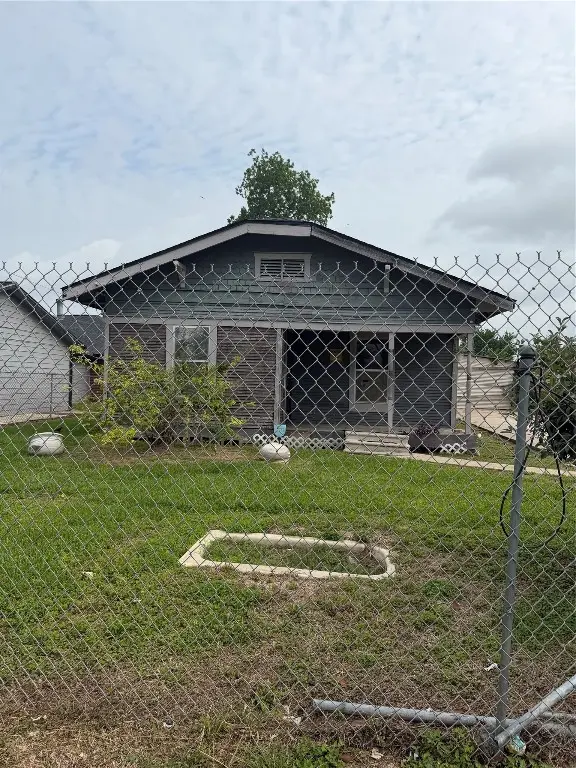
8607 Farqueson St · Houston, TX
Flood risk 6/10 · Moderate
- FEMA flood zone
- AE
- Chance of flooding over 30 yrs
- 0.74%
- Est. flood insurance / yr
- $1,737 – $8,500
Fire risk 1/10 · Minimal
- Est. fire insurance / yr
- $1,222 – $2,270
Heat risk 9/10 · Severe
- Hot days now (above 110°F)
- 7 days/yr
- Hot days in 30 yrs
- 24 days/yr
Wind risk 9/10 · Severe
- Chance of severe wind over 30 yrs
- 99.0%
Air-quality risk 3/10 · Minor
- Unhealthy air days now
- 2 days/yr
- Unhealthy air days in 30 yrs
- 3 days/yr
Risk factors via First Street. Map © Google.
Why this score? — see what drove the B+ grade
The composite is a weighted blend of 9 inputs, each scored 0–100. Each bar is that input's sub-score; the figure is the points it added to the 100-point composite (weight × sub-score).
- Cash flow +30.0/30.0
- 1% rule +10.0/10.0
- DSCR +10.0/10.0
- Appreciation +10.0/10.0
- ARV discount +7.5/15.0
- Livability +3.7/5.0
- Schools +2.7/10.0
- Rent growth +2.5/5.0
- Condition / age +2.5/5.0
$75,000
🖨 Deal sheet 📄 Offer letter ✓ Due diligence
Listing remarks
This charming property sits on a large lot in a rapidly developing neighborhood, offering outstanding investment and renovation potential. Enjoy easy access to major freeways, while still being close to shopping, dining, and entertainment. Bring your imagination and tools—this is the perfect opportunity to create your dream home or so much more.
Key facts
- Large lot
- Close to dining
- Investment potential
Tags
Property features AI
Finance
- Financial info: Lease not considered
Exterior
- Parking: Detached garage; 2-car garage
- Utilities: Public water
- Home design: Residential property; Built in 1930
- Construction: Block foundation; Composition roof; Construction materials: Unknown
- Exterior features: Lot roughly 7,500 sq ft (approx. 0.172 acres); Lot features: Other
Interior
- Bedrooms: Two first-floor bedrooms (each about 13 x 13); Primary bedroom on first floor (about 12 x 12)
- Bathrooms: 2 full bathrooms
- Heating & cooling: Central heating (gas); Central air conditioning (gas)
- Interior features: 3 total rooms
Neighborhood map
What this means for you Summary
Snapshot
- This is a 3-bed/2.0-bath single-family listed at $75k.
Deal economics
- At list price, monthly cash flow is $628 ($8k/yr) — positive.
- The deal already cash-flows at list — no discount required.
- Meets the 1% rule at list price ($2k rent vs $75k).
- Recommended offer: $73k (3.0% below list) — sets the bar for market timing.
- Cap rate 23.2% vs local median 3.2% in Houston — top-decile yield for the area; either an underpriced asset or a hidden risk that comps aren't pricing in. Stress-test before assuming the spread holds.
Location & tenants
- Location reads 74/100 on livability (#184 in TX, #4,771 nationally) — a middle-class / working-renter tenant base. Strengths: amenities A+, cost of living A+, housing A+; Watch: schools D, crime F.
- Houston ISD (urban): math 27% / reading 35% proficiency, ranked #593 of 826 in TX (top 72%) — families likely to look elsewhere, expect single-tenant / working-renter base with shorter leases; 71% free/reduced lunch — lower-income household profile, screen leases tightly.
- Market conditions: 153 active listings in the ZIP; 6 comparable units currently listed for rent nearby; rentals lingering (median 44d on market — plan ~5-8 weeks vacancy on turnover, expect pricing pressure); 50% of comp listings sitting > 30 days — soft ceiling on asking rent; 29,883 units permitted in Harris County in 2024 (8,621 in 5+ unit buildings).
- At $1,987/mo this rent would consume 49% of the median local household income ($48k/yr) (locally 457% of renters already pay >50% of income on rent) — very limited rent-growth headroom before tenants either downsize or default.
Forward outlook
- In year one you build about $8k of equity ($519 loan paydown + $8k appreciation (10.0% local appreciation)).
- Harris County population projected at +47% by 2050 — long-run rental-demand tailwind backs the buy-and-hold thesis.
- At projected returns (10.0% appreciation + 3.0% rent growth), your $21k cash investment doubles in ~2 years — after that, you're playing with house money.
- By year 5, paydown + projected appreciation supports a ~$37k cash-out refi (75% LTV) — recoverable capital for the next deal without selling this one.
Negotiation context
- It's been on market 48 days — a 3% lower offer ($73k) is reasonable based on typical stale-listing flexibility.
- 2 sale attempts; this cycle's ask has dropped $15k (17%) from the opening price — seller is motivated, your offer sets the floor, not the list.
Risks & watch-outs
- Watch-outs: flood insurance adds $427/mo; built in 1930 — expect roof / HVAC / electrical / plumbing capex.
- Climate carrying-cost: in FEMA flood zone AE (mandatory federal flood insurance); severe wind risk, 99% chance of damaging wind over 30y; extreme-heat days projected 7→24/yr by 2055 (HVAC capex compounding) — expect insurance premiums to compound above CPI over the hold.
Questions for the listing agent
- It's been on market 48 days. Have you received any prior offers? Is the seller open to a 3% concession, seller financing, or rate buy-down credit?
- Built in 1930 — when were the roof, HVAC, electrical panel, plumbing, and water heater last replaced?
- What's the actual annual flood-insurance premium (NFIP or private), and is the property in a SFHA with mandatory coverage?
- Is there a deadline driving the sale (1031 exchange, divorce, estate, relocation)? That informs how much negotiation room exists.
- Schools are D-rated, which usually means shorter tenancies and higher turnover. Who's the typical renter profile here, and what's been the actual vacancy rate?
- Crime grade is F in this area — have there been break-ins, vandalism, or insurance claims at this property in the last 3 years? What carrier currently insures it and at what premium?
- What's the average days-on-market for RENTAL listings here right now (not sales)? A rising rental-DOM trend means longer vacancies and softer asking-rent achievability than the comps imply.
- What's the recent tenant-quality profile in this submarket — average credit score on applications, eviction rate, late-payment / NSF rate, and stable-employment percentage? A property-management company in the area should have these aggregated.
- How much new for-sale + rental construction is in the pipeline within 1–3 miles? Heavy new supply typically softens prices + rents 12–24 months out; constrained supply supports both.
Investment metrics
- 1% rule
- 2.65% ✓
- Cap rate
- 23.17%
- Cash-on-cash
- 60.28%
- DSCR
- 3.68
- GRM
- 3.1
CMA / ARV
- ARV (median comp)
- $179,859
- List price
- $75,000
- Delta
- -58.30%
- Verdict
- UNDERPRICED
- Comps
- 11 within 1.0 mi
Projected returns pro-forma
10.0% appreciation · 3.0% rent growth · sell at horizon
- IRR
- 52.0%
- Equity multiple
- 4.86×
- Total profit
- $81,154
- Equity at exit
- $67,566
- IRR
- 45.7%
- Equity multiple
- 10.91×
- Total profit
- $208,093
- Equity at exit
- $145,709
Cash invested: $21,000 (down + closing). Projections, not guarantees.
Landlord ↔ Tenant lean methodology
- Overall (STATE)
- 87 Strongly Landlord-Friendly
- State Texas
- 87 Strongly Landlord-Friendly · R+5
- County
- — inherits STATE
- City
- — inherits STATE
ZIP-level market 77029
- Home prices YoY
- 7.2%
- Active inventory
- 153
- Price-to-rent
- 3.1×
Monthly cashflow live
- Estimated rent
- $1,987 high interval (Pro) →
- Mortgage (P&I)
- −$393
- Tax from tax record
- −$90 /mo · $1,081/yr
- Insurance
- −$31
- Flood insurance flood zone
- −$427 /mo · $5,118/yr
- HOA
- −$0
- Vacancy / Maint / Mgmt
- −$417
- Net cashflow
- $628
Break-even live
UW: 25.0% down · 7.5% · 30yr · 1.5% tax · 5.0% vac · 8.0% maint · 8.0% mgmt
Financing live
Cash to close
- Down payment
- $18,750
- Closing costs
- $2,250
- Reserves months
- —
- Total cash needed
- —
Loan-product check · same deal, 3 products live
Conventional
25% down · 7.5% · 30yr
- Down + closing
- —
- Monthly P&I
- —
- Monthly cashflow
- —
- DSCR
- —
- Eligible?
- —
Personal DTI + credit; lowest rate.
DSCR
20% down · 8.5% · 30yr
- Down + closing
- —
- Monthly P&I
- —
- Monthly cashflow
- —
- DSCR
- —
- Eligible?
- —
No personal income docs; deal must DSCR.
Hard money
10% down · 12.0% · 12mo
- Down + closing
- —
- Monthly P&I
- —
- Monthly cashflow
- —
- DSCR
- —
- Eligible?
- —
Short-term bridge; refi at stabilization.
Rent comps 6 comps
| Address | Beds | Baths | Sqft | Rent | $/sqft | DOM | Units | Dist |
|---|---|---|---|---|---|---|---|---|
| 5415 Bacher St Unit A Houston, TX | 3.0 | 2.5 | 1540 | $2,350 | $1.53 | 24d | 1 | 1.08mi |
| 5415 Bacher St Unit A Houston, TX | 3.0 | 2.5 | 1540 | $2,350 | $1.53 | 43d | 1 | 1.08mi |
| 5426 E Houston Rd Unit A Houston, TX | 3.0 | 2.5 | 1608 | $1,695 | $1.05 | 15d | 1 | 1.16mi |
| 7956 Bonaire St Unit A Houston, TX | 3.0 | 2.5 | 1498 | $2,100 | $1.40 | 44d | 1 | 1.18mi |
| 7956 Bonaire St Unit B Houston, TX | 3.0 | 2.5 | 1498 | $2,150 | $1.44 | 43d | 1 | 1.18mi |
| 7839 Sandy St Houston, TX | 3.0 | 2.0 | 1300 | $1,595 | $1.23 | 5d | 1 | 1.45mi |
Listing history 11 events
-
2026-06-16days on market $75,000 Active 48 DOM
-
2026-06-15days on market $75,000 Active 47 DOM
-
2026-06-13days on market $75,000 Active 45 DOM
-
2026-06-10days on market $75,000 Active 41 DOM
-
2026-06-08days on market $75,000 Active 40 DOM
-
2026-06-07pricestatusdays on market $75,000 Active 39 DOM
-
2026-06-04statusdays on market $90,000 Active Under Contract 36 DOM
-
2026-06-01days on market $90,000 Active 33 DOM
-
2026-05-31days on market $90,000 Active 32 DOM
-
2026-04-29$90,000 Active 353-char remark
-
1988-01-02soldstatus
ⓘ Source: listings_history table (triggers on properties + properties_extension) + one-shot
backfill from property_details.listing_events for pre-trigger history.
Tax reassessment forecast TX · Resets to sale price
- Current annual tax
- $1,081 · $90/mo
- Projected year-2 tax
- $1,372 · $114/mo
- Expected delta
- +$292/yr (+$24/mo · 27.0%)
ⓘ Screening estimate from a state-policy table — verify with the county assessor before closing.
Climate risk First Street
- Flood 6/10 Major FEMA zone AE · 74% chance over 30 yrs
- Wildfire 1/10 Low
- Heat 9/10 Extreme 7 d/yr ≥110°F today · 24 d/yr by 30 yrs out
- Wind 9/10 Extreme 99% chance of damaging wind over 30 yrs
- Air quality 3/10 Moderate 2 unhealthy d/yr today · 3 by 30 yrs out
Nearby sold comps map
Loading sold comps map…
Walkable amenities ~0.75 mi
Loading nearby amenities…
Taxation est. · year 1
- Rental income
- $23,840
- − Mortgage interest
- −$4,201
- − Property taxes
- −$1,081
- − Insurance
- −$5,494
- − Repairs & maintenance
- −$1,907
- − Management
- −$1,907
- − Depreciation
- −$2,182
- Taxable income
- $7,068
- Est. tax owed @ 24.0%
- −$1,696
- After-tax cash flow
- $5,843/yr
For passive investors: Depreciation is non-cash, so a rental often shows a tax loss while cash-flowing — sheltering income. Rental losses are passive: they offset passive income freely, and up to $25,000/yr can offset ordinary (W-2) income if you actively participate and your MAGI is under $100k (phasing out to $0 by $150k); unused losses carry forward. On sale, claimed depreciation is recaptured at up to 25%, and gains may owe capital-gains tax (a 1031 exchange can defer both). Figures are a year-1 estimate at your 24.0% rate — not tax advice; consult a CPA.
Schools (NCES district)
- District
- Houston ISD
- NCES district ID
- 4823640
- Math proficiency
- 27% ▼ -18.00%
- Reading proficiency
- 35% ▼ -6.00%
- Median HH income
- $46,054
- Composite
- 26.63/100
- National rank
- #7173
- State rank
- #593 of 826 in TX
Livability — Houston
- Score
- 74/100
- State rank
- #184
- US rank
- #4771
Category grades
Schools grade is shown separately in the Schools card above.
Census & demographics
- Census place
- Houston, TX
- County
- Harris County · 4,702,590 people
- City population
- 3,226,434
- Metro
- Houston-The Woodlands-Sugar Land, TX
- Population (ZIP)
- 16,154
- Household income
- $48,279
- Rent vs Own
- Severe rent burden
- 457.0
Population outlook (Harris County) Hauer SSP2
- Today (2025)
- 5,571,493 people
- By 2030
- 6,089,821 · +9.3%
- By 2040
- 7,142,806 · +28.2%
- By 2050
- 8,185,864 · +46.9%
- By 2075
- 10,574,329 · +89.8%
- By 2100
- 12,109,958 · +117.4%
Race, ethnicity, and origin ACS 2023
- Neighborhood character
- Predominantly Hispanic (72%)
- Race & ethnicity
- Hispanic / Latino 72% Two or more races 32% Black 22% White 5%
- Hispanic origin (detail)
- Mexican 66%
- Foreign-born
- 31% · Canada
- Languages at home
- 39% English-only · Spanish 61%
Political lean MEDSL · Harris
- 2024 margin
- Lean D (+5.5) · D 52.0% · R 46.4% · Other 1.6%
- 2008→2024 swing
- +3.9pp toward D · 2008: 1.6pp · 2024: 5.5pp
- All cycles
- 2024: D+5.5 2020: D+13.3 2016: D+12.4 2012: D+0.1 2008: D+1.6
Not yet ingested
- Civics
- —
Market trends
- HPI YoY
- ▲ 18.53%
- Current HPI
- 276.1811
- Rent YoY
- —
- Metro
- Houston-The Woodlands-Sugar Land, TX
- State GDP YoY
- ▲ 3.95%
- F500 in state
- 110
Industry mix (Fortune 500 HQ in TX)
| Industry | F500 HQs | Revenue |
|---|---|---|
| Energy | 16 | $1,198B |
|
||
| Technology | 5 | $198B |
|
||
| Engineering / Construction | 4 | $72B |
|
||
| Energy Services | 3 | $60B |
|
||
| Utilities | 3 | $41B |
|
||
| Healthcare | 2 | $330B |
|
||
Price history
-16.7% since first listed6 events — show timeline
- 2026-06-16 Listing Removed — HARMLS
- 2026-06-04 Relisted — HARMLS
- 2026-06-04 Price Changed $75,000 HARMLS
- 2026-06-02 Contingent — HARMLS
- 2026-04-29 Listed $90,000 HARMLS
- 1988-01-02 Sold (Public Records) — Public Records
Property tax history
+4.3%/yrLatest (2025): $1,081 · +11.7% YoY. Source: county tax records.
Cash-flow waterfall
monthlySold comps — $/sqft
last 12 mo · ≤1 miLoading sold comps…