230 Deane Dr · Indian Springs, TX
Flood risk 1/10 · Minimal
- FEMA flood zone
- X (unshaded)
- Chance of flooding over 30 yrs
- 0.0%
- Est. flood insurance / yr
- $507 – $1,088
Fire risk 5/10 · Moderate
- Est. fire insurance / yr
- $1,222 – $2,270
Heat risk 8/10 · Major
- Hot days now (above 111°F)
- 7 days/yr
- Hot days in 30 yrs
- 22 days/yr
Wind risk 8/10 · Major
- Chance of severe wind over 30 yrs
- 99.0%
Air-quality risk 1/10 · Minimal
- Unhealthy air days now
- 0 days/yr
- Unhealthy air days in 30 yrs
- 0 days/yr
Risk factors via First Street. Map © Google.
Why this score? — see what drove the B+ grade
The composite is a weighted blend of 9 inputs, each scored 0–100. Each bar is that input's sub-score; the figure is the points it added to the 100-point composite (weight × sub-score).
- Cash flow +30.0/30.0
- ARV discount +15.0/15.0
- 1% rule +10.0/10.0
- DSCR +10.0/10.0
- Schools +3.2/10.0
- Livability +3.0/5.0
- Rent growth +2.5/5.0
- Condition / age +2.5/5.0
- Appreciation +0.0/10.0
$79,500
🖨 Deal sheet 📄 Offer letter ✓ Due diligence
Listing remarks
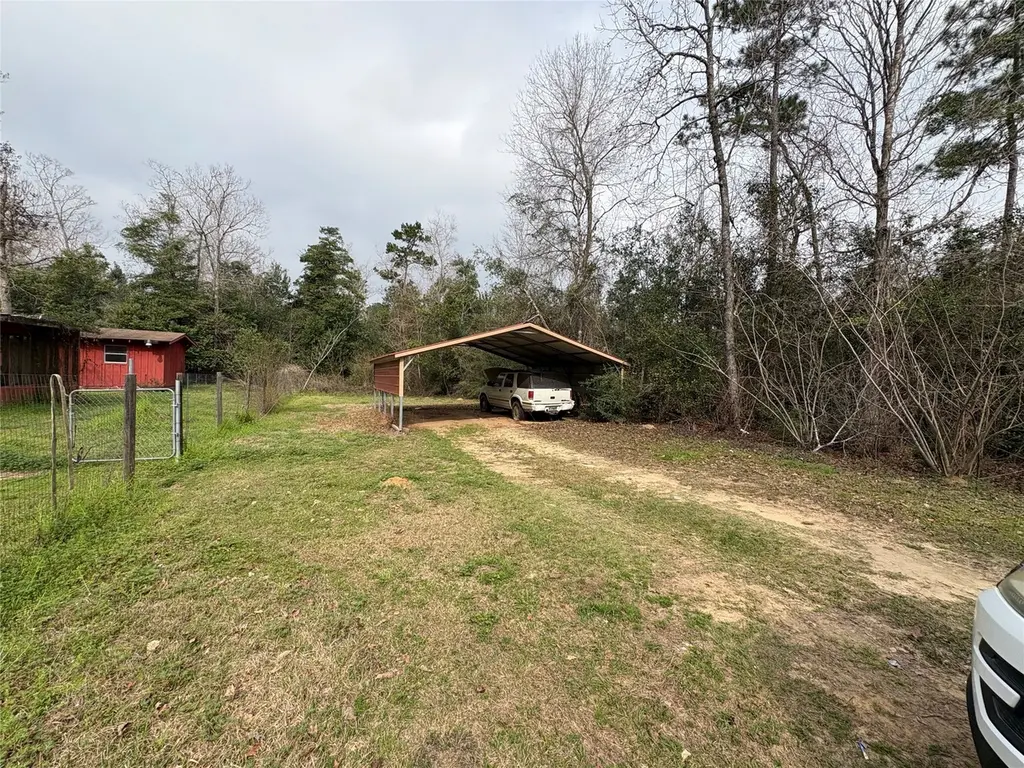
This residence at 230 Deane Dr in Livingston features three bedrooms and one bathroom across 920 square feet of living space. Inside, find well-maintained hardwood flooring throughout the main areas. The kitchen comes equipped with a functional stove, refrigerator, washer, and dryer. Comfort is maintained year-round with central heat and air conditioning. This one-story property is built on a solid foundation with a roof approximately eleven years old. The electrical and plumbing systems are in good working order. Perfect for those seeking a manageable space in a rural setting.
Key facts
- Hardwood flooring
- Central heat
- Air conditioning
Tags
Property features AI
Finance
- Other: Seller disclosure available
- Financial info: Lease not considered
Exterior
- Utilities: Public water; Public sewer
- Home design: Residential property; Built in 1973; Slab foundation
- Construction: Wood siding construction
- Exterior features: Lot of about 2.314 acres; Lot described as Other
Interior
- Bathrooms: One full bathroom
- Heating & cooling: Central heating (electric); Central air conditioning (electric)
- Interior features: One fireplace; Six total rooms
Neighborhood map
What this means for you Summary
Snapshot
- This is a 3-bed/1.0-bath single-family listed at $80k.
Deal economics
- At list price, monthly cash flow is $560 ($7k/yr) — positive.
- The deal already cash-flows at list — no discount required.
- Meets the 1% rule at list price ($1k rent vs $80k).
- Recommended offer: $78k (1.5% below list) — sets the bar for market timing.
Location & tenants
- Location reads 60/100 on livability (#1,068 in TX) — a middle-class / working-renter tenant base. Strengths: cost of living A+, housing A+; Watch: schools F, crime F, amenities F.
- Livingston ISD (rural): math 38% / reading 39% proficiency, ranked #459 of 826 in TX (top 56%) — families likely to look elsewhere, expect single-tenant / working-renter base with shorter leases.
- Market conditions: 1186 active listings in the ZIP; 769 units permitted in Polk County in 2024 (0 in 5+ unit buildings).
Forward outlook
- Local home prices are declining (-3.0%/yr); year-one equity from $550 of loan paydown is wiped out by about $2k of value loss. Plan a longer hold.
- Polk County population projected at +16% by 2050 — long-run rental-demand tailwind backs the buy-and-hold thesis.
- At projected returns (-3.0% appreciation + 3.0% rent growth), your $22k cash investment doubles in ~4 years — after that, you're playing with house money.
Negotiation context
- It's been on market 15 days — a 2% lower offer ($78k) is reasonable based on typical stale-listing flexibility.
- 2 sale attempts with the ask held roughly flat each time — persistent listings suggest the price (not the market) is what's stuck; bring a comps-based counter.
- Current owner paid $25k; list at $80k implies a 218% gain — meaningful room to come down on a strong offer.
Risks & watch-outs
- Climate carrying-cost: severe wind risk, 99% chance of damaging wind over 30y; moderate wildfire risk; extreme-heat days projected 7→22/yr by 2055 (HVAC capex compounding) — expect insurance premiums to compound above CPI over the hold.
Questions for the listing agent
- Built in 1973 — when were the roof, HVAC, electrical panel, plumbing, and water heater last replaced?
- Is there a deadline driving the sale (1031 exchange, divorce, estate, relocation)? That informs how much negotiation room exists.
- Schools are F-rated, which usually means shorter tenancies and higher turnover. Who's the typical renter profile here, and what's been the actual vacancy rate?
- Crime grade is F in this area — have there been break-ins, vandalism, or insurance claims at this property in the last 3 years? What carrier currently insures it and at what premium?
- What's the average days-on-market for RENTAL listings here right now (not sales)? A rising rental-DOM trend means longer vacancies and softer asking-rent achievability than the comps imply.
- What's the recent tenant-quality profile in this submarket — average credit score on applications, eviction rate, late-payment / NSF rate, and stable-employment percentage? A property-management company in the area should have these aggregated.
- How much new for-sale + rental construction is in the pipeline within 1–3 miles? Heavy new supply typically softens prices + rents 12–24 months out; constrained supply supports both.
Investment metrics
- 1% rule
- 1.81% ✓
- Cap rate
- 14.75%
- Cash-on-cash
- 30.21%
- DSCR
- 2.34
- GRM
- 4.6
CMA / ARV
- ARV (median comp)
- $102,880
- List price
- $79,500
- Delta
- -22.73%
- Verdict
- UNDERPRICED
- Comps
- 14 within 1.0 mi
Show comp detail 4 sales within ~0.75 mi
| Address | Dist | Beds/Ba | Sqft | Sold | Price | $/sf | Match |
|---|---|---|---|---|---|---|---|
| 161 Jordan Dr | 0.14mi | 3/1.0 | 960 (-13%) | 3mo | $130,000 | $135 | 70 |
| 193 Bonnie Maude Blvd | 0.53mi | 2/1.0 (-1) | 1,056 (-4%) | 2mo | $54,000 | $51 | 62 |
| 193 Bonnie Blue Lane Ln | 0.29mi | 3/2.0 | 1,224 (+11%) | 10mo | $110,000 | $90 | 55 |
| 315 Starr Springs Dr | 0.48mi | 3/1.0 | 1,040 (-6%) | 20mo | $160,000 | $154 | 52 |
Match score weights: distance 35% · size 25% · config 20% · recency 20%. Top-matched comps best support the ARV.
Projected returns pro-forma
-3.0% appreciation · 3.0% rent growth · sell at horizon
- IRR
- 24.9%
- Equity multiple
- 2.03×
- Total profit
- $22,847
- Equity at exit
- $11,854
- IRR
- 32.7%
- Equity multiple
- 3.97×
- Total profit
- $66,013
- Equity at exit
- $6,874
Cash invested: $22,260 (down + closing). Projections, not guarantees.
Landlord ↔ Tenant lean methodology
- Overall (STATE)
- 87 Strongly Landlord-Friendly
- State Texas
- 87 Strongly Landlord-Friendly · R+5
- County
- — inherits STATE
- City
- — inherits STATE
ZIP-level market 77351
- Home prices YoY
- -14.8%
- Active inventory
- 1186
- Price-to-rent
- 4.6×
Monthly cashflow live
- Estimated rent
- $1,442 medium interval (Pro) →
- Mortgage (P&I)
- −$417
- Tax from tax record
- −$129 /mo · $1,543/yr
- Insurance
- −$33
- HOA
- −$0
- Vacancy / Maint / Mgmt
- −$303
- Net cashflow
- $560
Break-even live
UW: 25.0% down · 7.5% · 30yr · 1.5% tax · 5.0% vac · 8.0% maint · 8.0% mgmt
Financing live
Cash to close
- Down payment
- $19,875
- Closing costs
- $2,385
- Reserves months
- —
- Total cash needed
- —
Loan-product check · same deal, 3 products live
Conventional
25% down · 7.5% · 30yr
- Down + closing
- —
- Monthly P&I
- —
- Monthly cashflow
- —
- DSCR
- —
- Eligible?
- —
Personal DTI + credit; lowest rate.
DSCR
20% down · 8.5% · 30yr
- Down + closing
- —
- Monthly P&I
- —
- Monthly cashflow
- —
- DSCR
- —
- Eligible?
- —
No personal income docs; deal must DSCR.
Hard money
10% down · 12.0% · 12mo
- Down + closing
- —
- Monthly P&I
- —
- Monthly cashflow
- —
- DSCR
- —
- Eligible?
- —
Short-term bridge; refi at stabilization.
Listing history 7 events
-
2026-05-15$79,500 Active 584-char remark
-
2026-05-05historical
-
2026-04-30price $79,500
-
2026-04-14price $82,000
-
2026-04-06price $89,000
-
2026-02-27$94,900 Active
-
1992-12-01soldstatus $25,000
ⓘ Source: listings_history table (triggers on properties + properties_extension) + one-shot
backfill from property_details.listing_events for pre-trigger history.
Tax reassessment forecast TX · Resets to sale price
- Current annual tax
- $1,543 · $129/mo
- Projected year-2 tax
- $1,543 · $129/mo
- Expected delta
- $0/yr ($0/mo · 0.0%)
ⓘ Screening estimate from a state-policy table — verify with the county assessor before closing.
Climate risk First Street
- Flood 1/10 Low FEMA zone X (unshaded) · 0% chance over 30 yrs
- Wildfire 5/10 Major
- Heat 8/10 Severe 7 d/yr ≥111°F today · 22 d/yr by 30 yrs out
- Wind 8/10 Severe 99% chance of damaging wind over 30 yrs
- Air quality 1/10 Low 0 unhealthy d/yr today · 0 by 30 yrs out
Nearby sold comps map
Loading sold comps map…
Walkable amenities ~0.75 mi
Loading nearby amenities…
Taxation est. · year 1
- Rental income
- $17,302
- − Mortgage interest
- −$4,453
- − Property taxes
- −$1,543
- − Insurance
- −$398
- − Repairs & maintenance
- −$1,384
- − Management
- −$1,384
- − Depreciation
- −$2,313
- Taxable income
- $5,826
- Est. tax owed @ 24.0%
- −$1,398
- After-tax cash flow
- $5,326/yr
For passive investors: Depreciation is non-cash, so a rental often shows a tax loss while cash-flowing — sheltering income. Rental losses are passive: they offset passive income freely, and up to $25,000/yr can offset ordinary (W-2) income if you actively participate and your MAGI is under $100k (phasing out to $0 by $150k); unused losses carry forward. On sale, claimed depreciation is recaptured at up to 25%, and gains may owe capital-gains tax (a 1031 exchange can defer both). Figures are a year-1 estimate at your 24.0% rate — not tax advice; consult a CPA.
Schools (NCES district)
- District
- Livingston ISD
- NCES district ID
- 4827780
- Math proficiency
- 38% ▼ -1.00%
- Reading proficiency
- 39% ▲ 3.00%
- Median HH income
- $39,531
- Composite
- 32.25/100
- National rank
- #5767
- State rank
- #459 of 826 in TX
Livability — Indian Springs
- Score
- 60/100
- State rank
- #1068
- US rank
- #18956
Category grades
Schools grade is shown separately in the Schools card above.
Census & demographics
- Census place
- Indian Springs, TX
- County
- Polk County · 37,143 people
- Metro
- nan
- Population (ZIP)
- 37,143
- Household income
- $66,834
- Rent vs Own
- Severe rent burden
- 608.0
Population outlook (Polk County) Hauer SSP2
- Today (2025)
- 51,049 people
- By 2030
- 53,243 · +4.3%
- By 2040
- 56,528 · +10.7%
- By 2050
- 59,243 · +16.1%
- By 2075
- 63,528 · +24.4%
- By 2100
- 60,376 · +18.3%
Race, ethnicity, and origin ACS 2023
- Neighborhood character
- Predominantly White (72%)
- Race & ethnicity
- White 72% Hispanic / Latino 14% Two or more races 9% Black 8% Native American 2%
- Hispanic origin (detail)
- Mexican 11%
- Common ancestry
- Lithuanian 2% Italian 2% Portuguese 2%
- Foreign-born
- 5% · Canada
- Languages at home
- 88% English-only · Spanish 10%
Political lean MEDSL · Polk
- 2024 margin
- Solid R (+58.9) · D 20.2% · R 79.1%
- 2008→2024 swing
- -21.7pp toward R · 2008: -37.2pp · 2024: -58.9pp
- All cycles
- 2024: R+58.9 2020: R+54.5 2016: R+56.5 2012: R+48.2 2008: R+37.2
Not yet ingested
- Civics
- —
Market trends
- HPI YoY
- ▼ -31.11%
- Current HPI
- 178.5316
- Rent YoY
- —
- Metro
- nan
- State GDP YoY
- ▲ 3.95%
- F500 in state
- 110
Industry mix (Fortune 500 HQ in TX)
| Industry | F500 HQs | Revenue |
|---|---|---|
| Energy | 16 | $1,198B |
|
||
| Technology | 5 | $198B |
|
||
| Engineering / Construction | 4 | $72B |
|
||
| Energy Services | 3 | $60B |
|
||
| Utilities | 3 | $41B |
|
||
| Healthcare | 2 | $330B |
|
||
Price history
+218.0% since first listed8 events — show timeline
- 2026-05-30 Listing Removed — HARMLS
- 2026-05-15 Listed $79,500 HARMLS
- 2026-05-05 Listing Removed — HARMLS
- 2026-04-30 Price Changed $79,500 HARMLS
- 2026-04-14 Price Changed $82,000 HARMLS
- 2026-04-06 Price Changed $89,000 HARMLS
- 2026-02-27 Listed $94,900 HARMLS
- 1992-12-01 Sold (Public Records) $25,000 Public Records
Property tax history
+2.1%/yrLatest (2025): $1,543 · +7.3% YoY. Source: county tax records.
Cash-flow waterfall
monthlySold comps — $/sqft
last 12 mo · ≤1 miLoading sold comps…