4290 Rancho Montes Dr · Diamond Springs, CA
Flood risk No data
- FEMA flood zone
- —
- Chance of flooding over 30 yrs
- —
- Est. flood insurance / yr
- —
Fire risk No data
- Est. fire insurance / yr
- —
Heat risk No data
- Hot days now (above threshold)
- —
- Hot days in 30 yrs
- —
Wind risk No data
- Chance of severe wind over 30 yrs
- —
Air-quality risk No data
- Unhealthy air days now
- —
- Unhealthy air days in 30 yrs
- —
Risk factors via First Street. Map © Google.
Why this score? — see what drove the C grade
The composite is a weighted blend of 9 inputs, each scored 0–100. Each bar is that input's sub-score; the figure is the points it added to the 100-point composite (weight × sub-score).
- Cash flow +19.7/30.0
- ARV discount +15.0/15.0
- DSCR +6.2/10.0
- Rent growth +5.0/5.0
- 1% rule +3.9/10.0
- Schools +3.9/10.0
- Condition / age +2.5/5.0
- Livability +2.4/5.0
- Appreciation +0.0/10.0
$210,000
🖨 Deal sheet (PDF) 📄 Offer letter ✓ Due diligence
Listing remarks
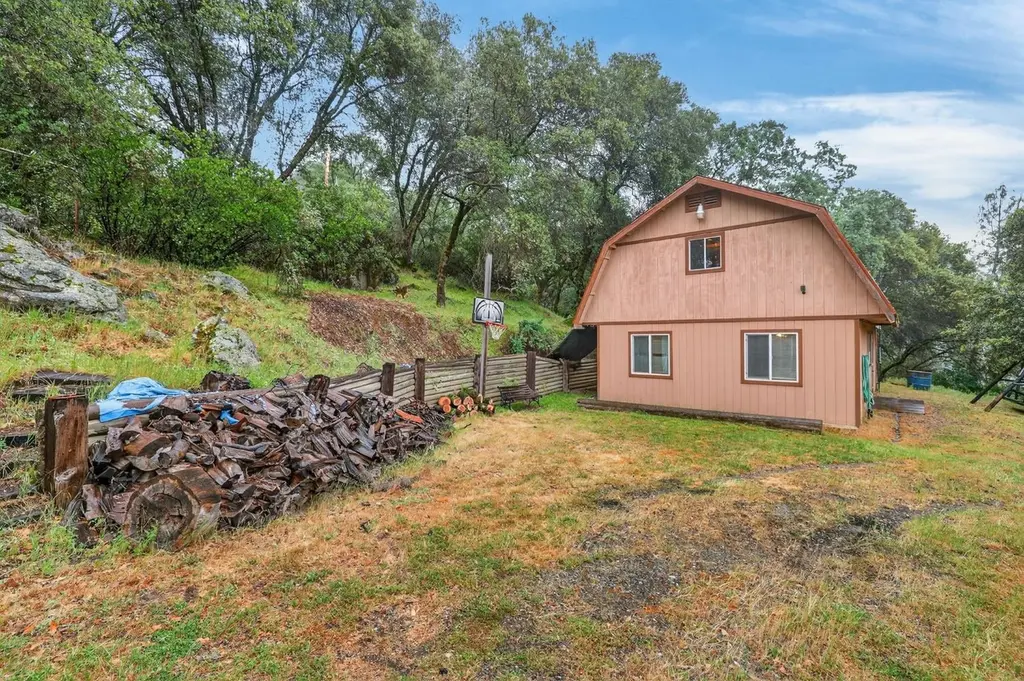
Escape the noise without sacrificing convenience in this unique barndominium retreat in Placerville. Situated on 5 usable acres, this 2-bedroom, 1-bath home offers the perfect blend of rural charm and functional living. Ideal for locals seeking space or buyers looking for a peaceful foothill getaway within a manageable drive. The property provides room to roam, garden, store equipment, or simply enjoy the privacy and natural surroundings that El Dorado County is known for. Whether you're envisioning a full-time residence, weekend escape, or investment opportunity, the versatility of this barndominium delivers. Located just a short drive from outdoor destinations including hiking, wineries,
Key facts
- 5 usable acres
- Foothill living
- Outdoor destinations
Tags
Property features AI
Finance
- HOA & community: No homeowners association
Exterior
- Parking: No garage
- Utilities: Well water; Septic system; 220 volt electric service; Internet available; Underground utilities; Irrigation: other
- Home design: Single-family residence (custom); Fixer / original condition; Built in 1982; One story entry with two interior levels; Shingle and wood roof
- Construction: Shingle and wood roofing; Built in 1982; Other structures: shed(s) and storage
- Exterior features: Balcony; Garden areas; Other yard features; Shed(s) / storage structure(s)
Interior
- Kitchen: Pantry cabinet; Insulated water heater; Electric water heater
- Bedrooms: 2 bedrooms (main level); Loft on the upper level
- Flooring: Concrete floors
- Bathrooms: 1 full bathroom with shower stall and window; Accessible full bath
- Heating & cooling: Fireplace; Wood stove; Ceiling fans; Wall cooling unit; Window cooling units
- Interior features: Accessible doors; Accessible full bathroom; Accessible kitchen; Roof deck; Caulked/sealed windows; Concrete flooring; Living room with a view; Pantry cabinet; Two-level interior with a loft
- Laundry & utility: No laundry hook-ups specified
Neighborhood map
What this means for you Summary
Snapshot
- This is a 2-bed/1.0-bath single-family listed at $210k.
Deal economics
- At list price, monthly cash flow is $248 ($3k/yr) — positive.
- The deal already cash-flows at list — no discount required.
- To meet the 1% rule (rent ≥ 1% of price), the offer needs to be $188k (10.6% below list).
- Recommended offer: $188k (10.6% below list) — sets the bar for 1% rule.
- Cap rate 7.7% vs local median 2.3% in Diamond Springs — top-decile yield for the area; either an underpriced asset or a hidden risk that comps aren't pricing in. Stress-test before assuming the spread holds.
Location & tenants
- Location reads 47/100 on livability (#1,239 in CA) — a working-class tenant base; expect higher turnover. Strengths: housing B+; Watch: schools D, crime D-, amenities F.
- Pioneer Union Elementary (rural): math 30% / reading 55% proficiency, ranked #638 of 1,400 in CA (top 46%) — families likely to look elsewhere, expect single-tenant / working-renter base with shorter leases.
- Market conditions: Rents rising fast (+12.5%/yr); 351 active listings in the ZIP; solid renter incomes; 437 units permitted in El Dorado County in 2024 (0 in 5+ unit buildings).
Forward outlook
- Local home prices are declining (-3.0%/yr); year-one equity from $1k of loan paydown is wiped out by about $6k of value loss. Plan a longer hold.
- El Dorado County population projected to shrink 3% by 2050 — rents likely to lag national; underwrite the cash flow, not the appreciation.
- At projected returns (-3.0% appreciation + 8.0% rent growth), your $59k cash investment doubles in ~10 years — after that, you're playing with house money.
Negotiation context
- It's been on market 64 days — a 6% lower offer ($197k) is reasonable based on typical stale-listing flexibility.
- Current owner paid $9k; list at $210k implies a 2233% gain — meaningful room to come down on a strong offer.
Questions for the listing agent
- It's been on market 64 days. Have you received any prior offers? Is the seller open to a 11% concession, seller financing, or rate buy-down credit?
- Why hasn't it sold? Are there any deal-killer items the seller is aware of (foundation, flood, title, zoning, code violations)?
- Is there a deadline driving the sale (1031 exchange, divorce, estate, relocation)? That informs how much negotiation room exists.
- Schools are D-rated, which usually means shorter tenancies and higher turnover. Who's the typical renter profile here, and what's been the actual vacancy rate?
- Crime grade is D in this area — have there been break-ins, vandalism, or insurance claims at this property in the last 3 years? What carrier currently insures it and at what premium?
- What's the average days-on-market for RENTAL listings here right now (not sales)? A rising rental-DOM trend means longer vacancies and softer asking-rent achievability than the comps imply.
- What's the recent tenant-quality profile in this submarket — average credit score on applications, eviction rate, late-payment / NSF rate, and stable-employment percentage? A property-management company in the area should have these aggregated.
- How much new for-sale + rental construction is in the pipeline within 1–3 miles? Heavy new supply typically softens prices + rents 12–24 months out; constrained supply supports both.
Investment metrics
- 1% rule
- 0.89% ✗
- Cap rate
- 7.71%
- Cash-on-cash
- 5.06%
- DSCR
- 1.22
- GRM
- 9.3
CMA / ARV
- ARV (on-the-fly)
- $407,000
- Comps found
- 1
Show comp detail 1 sale within ~0.75 mi
| Address | Dist | Beds/Ba | Sqft | Sold | Price | $/sf | Match |
|---|---|---|---|---|---|---|---|
| 3431 Elderberry Rd | 0.61mi | 3/2.0 (+1) | 1,134 (+3%) | 2mo | $420,000 | $370 | 56 |
Match score weights: distance 35% · size 25% · config 20% · recency 20%. Top-matched comps best support the ARV.
Projected returns pro-forma
-3.0% appreciation · 8.0% rent growth · sell at horizon
- IRR
- -3.7%
- Equity multiple
- 0.86×
- Total profit
- $-8,436
- Equity at exit
- $31,312
- IRR
- 10.5%
- Equity multiple
- 1.98×
- Total profit
- $57,692
- Equity at exit
- $18,157
Cash invested: $58,800 (down + closing). Projections, not guarantees.
Landlord ↔ Tenant lean methodology
- Overall (STATE)
- 18 Strongly Tenant-Friendly
- State California
- 18 Strongly Tenant-Friendly · D+13
- County
- — inherits STATE
- City
- — inherits STATE
ZIP-level market 95667
- Rents YoY
- 12.5%
- Active inventory
- 351
- Price-to-rent
- 9.3×
Monthly cashflow live
- Estimated rent
- $1,877 medium interval (Pro) →
- Mortgage (P&I)
- −$1,101
- Tax from tax record
- −$46 /mo · $555/yr
- Insurance
- −$88
- HOA
- −$0
- Vacancy / Maint / Mgmt
- −$394
- Net cashflow
- $248
Break-even live
Sensitivity live
| Price | -10% $367 | -5% $307 | +0% $248 | +5% $188 | +10% $129 |
|---|---|---|---|---|---|
| Rent | -10% $99 | -5% $174 | +0% $248 | +5% $322 | +10% $396 |
| Rate | -1.0pp $353 | -0.5pp $301 | base $248 | +0.5pp $193 | +1.0pp $138 |
UW: 25.0% down · 7.5% · 30yr · 1.5% tax · 5.0% vac · 8.0% maint · 8.0% mgmt
Financing live
Cash to close
- Down payment
- $52,500
- Closing costs
- $6,300
- Reserves months
- —
- Total cash needed
- —
Loan-product check · same deal, 3 products live
Conventional
25% down · 7.5% · 30yr
- Down + closing
- —
- Monthly P&I
- —
- Monthly cashflow
- —
- DSCR
- —
- Eligible?
- —
Personal DTI + credit; lowest rate.
DSCR
20% down · 8.5% · 30yr
- Down + closing
- —
- Monthly P&I
- —
- Monthly cashflow
- —
- DSCR
- —
- Eligible?
- —
No personal income docs; deal must DSCR.
Hard money
10% down · 12.0% · 12mo
- Down + closing
- —
- Monthly P&I
- —
- Monthly cashflow
- —
- DSCR
- —
- Eligible?
- —
Short-term bridge; refi at stabilization.
Listing history 17 events
-
2026-06-19days on market $210,000 Active 64 DOM
-
2026-06-18days on market $210,000 Active 63 DOM
-
2026-06-17days on market $210,000 Active 62 DOM
-
2026-06-16days on market $210,000 Active 61 DOM
-
2026-06-15days on market $210,000 Active 60 DOM
-
2026-06-13days on market $210,000 Active 58 DOM
-
2026-06-13days on market $210,000 Active 57 DOM
-
2026-06-10days on market $210,000 Active 55 DOM
-
2026-06-09days on market $210,000 Active 54 DOM
-
2026-06-08days on market $210,000 Active 53 DOM
-
2026-06-07days on market $210,000 Active 52 DOM
-
2026-06-05days on market $210,000 Active 49 DOM
-
2026-06-03days on market $210,000 Active 48 DOM
-
2026-06-02days on market $210,000 Active 47 DOM
-
2026-06-01days on market $210,000 Active 46 DOM
-
2026-05-31days on market $210,000 Active 45 DOM
-
1980-01-29soldstatus $9,000
ⓘ Source: listings_history table (triggers on properties + properties_extension) + one-shot
backfill from property_details.listing_events for pre-trigger history.
Tax reassessment forecast CA · Resets to sale price
- Current annual tax
- $555 · $46/mo
- Projected year-2 tax
- $1,596 · $133/mo
- Expected delta
- +$1,041/yr (+$87/mo · 187.4%)
ⓘ Screening estimate from a state-policy table — verify with the county assessor before closing.
Nearby sold comps map
Loading sold comps map…
Walkable amenities ~0.75 mi
Loading nearby amenities…
Taxation est. · year 1
- Rental income
- $22,523
- − Mortgage interest
- −$11,763
- − Property taxes
- −$555
- − Insurance
- −$1,050
- − Repairs & maintenance
- −$1,802
- − Management
- −$1,802
- − Depreciation
- −$6,109
- Taxable loss
- −$558
- Est. tax savings @ 24.0%
- +$134
- After-tax cash flow
- $3,107/yr
For passive investors: Depreciation is non-cash, so a rental often shows a tax loss while cash-flowing — sheltering income. Rental losses are passive: they offset passive income freely, and up to $25,000/yr can offset ordinary (W-2) income if you actively participate and your MAGI is under $100k (phasing out to $0 by $150k); unused losses carry forward. On sale, claimed depreciation is recaptured at up to 25%, and gains may owe capital-gains tax (a 1031 exchange can defer both). Figures are a year-1 estimate at your 24.0% rate — not tax advice; consult a CPA.
Schools (NCES district)
- District
- Pioneer Union Elementary
- NCES district ID
- 0630480
- Math proficiency
- 30% ▬ 0.00%
- Reading proficiency
- 55% ▲ 10.00%
- Median HH income
- $52,807
- Composite
- 39.11/100
- National rank
- #8246
- State rank
- #638 of 1400 in CA
Livability — Diamond Springs
- Score
- 47/100
- State rank
- #1239
- US rank
- #26264
Category grades
Schools grade is shown separately in the Schools card above.
Census & demographics
- County
- El Dorado County · 144,198 people
- City population
- 6,362
- Metro
- Sacramento-Roseville-Folsom, CA
- Population (ZIP)
- 36,830
- Household income
- $89,938
- Rent vs Own
- Severe rent burden
- 1147.0
Population outlook (El Dorado County) Hauer SSP2
- Today (2025)
- 191,666 people
- By 2030
- 193,662 · +1.0%
- By 2040
- 192,583 · +0.5%
- By 2050
- 185,904 · -3.0%
- By 2075
- 169,543 · -11.5%
- By 2100
- 139,623 · -27.2%
Race, ethnicity, and origin ACS 2023
- Neighborhood character
- Predominantly White (78%)
- Race & ethnicity
- White 78% Hispanic / Latino 14% Two or more races 8% Native American 1%
- Hispanic origin (detail)
- Mexican 11%
- Common ancestry
- Italian 4% Slovak 4% Lithuanian 3%
- Foreign-born
- 6% · Canada, China
- Languages at home
- 92% English-only · Spanish 6%
Political lean MEDSL · El Dorado
- 2024 margin
- R (+12.0) · D 42.6% · R 54.6% · Other 2.8%
- 2008→2024 swing
- -1.5pp toward R · 2008: -10.5pp · 2024: -12.0pp
- All cycles
- 2024: R+12.0 2020: R+8.8 2016: R+13.9 2012: R+18.2 2008: R+10.5
Not yet ingested
- Civics
- —
Market trends
- HPI YoY
- ▼ -480.50%
- Current HPI
- 262.6014
- Rent YoY
- ▲ 12.48%
- Metro
- Sacramento-Roseville-Folsom, CA
- State GDP YoY
- ▲ 3.21%
- F500 in state
- 116
Industry mix (Fortune 500 HQ in CA)
| Industry | F500 HQs | Revenue |
|---|---|---|
| Technology | 27 | $1,492B |
|
||
| Financial Services | 3 | $174B |
|
||
| Retail | 3 | $44B |
|
||
| Insurance | 3 | $26B |
|
||
| Media / Entertainment | 2 | $115B |
|
||
| Pharmaceuticals / Biotech | 2 | $62B |
|
||
Price history
1 event — show timeline
- 1980-01-29 Sold (Public Records) $9,000 Public Records
Property tax history
-1.0%/yrLatest (2025): $555 · +1.3% YoY. Source: county tax records.
Cash-flow waterfall
monthlySold comps — $/sqft
last 12 mo · ≤1 miLoading sold comps…