 5-Plex
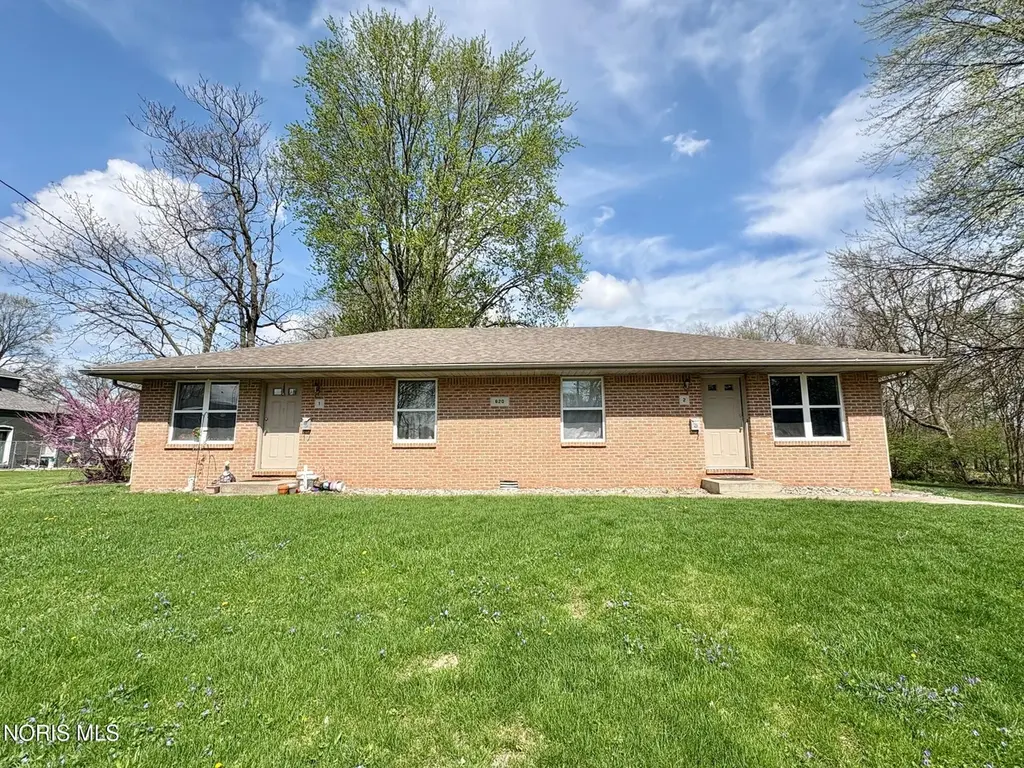
620 Stout St · Napoleon, OH
Flood risk 10/10 · Severe
- FEMA flood zone
- AE
- Chance of flooding over 30 yrs
- 0.99%
- Est. flood insurance / yr
- $1,737 – $8,500
Fire risk 1/10 · Minimal
- Est. fire insurance / yr
- $713 – $1,323
Heat risk 3/10 · Minor
- Hot days now (above 99°F)
- 7 days/yr
- Hot days in 30 yrs
- 17 days/yr
Wind risk 2/10 · Minimal
- Chance of severe wind over 30 yrs
- —
Air-quality risk 2/10 · Minimal
- Unhealthy air days now
- 1 days/yr
- Unhealthy air days in 30 yrs
- 2 days/yr
Risk factors via First Street. Map © Google.
Why this score? — see what drove the C+ grade
The composite is a weighted blend of 9 inputs, each scored 0–100. Each bar is that input's sub-score; the figure is the points it added to the 100-point composite (weight × sub-score).
- Cash flow +25.8/30.0
- DSCR +8.6/10.0
- ARV discount +7.5/15.0
- 1% rule +6.5/10.0
- Schools +5.6/10.0
- Livability +3.5/5.0
- Rent growth +2.5/5.0
- Condition / age +2.5/5.0
- Appreciation +0.0/10.0
$389,900
🖨 Deal sheet 📄 Offer letter ✓ Due diligence
Multi-family units
County records classify this as Multi-Family (2-4 Unit). Listing-text estimate: 5 units. estimate disagrees with records
Listing remarks
Excellent income-producing 5-unit property—fully occupied and ready for its next investor. Offering immediate cash flow, this low-maintenance building includes a newer roof, updated water heaters, and paved parking. Solid rental history and easy upkeep make this a smart, hassle-free addition to your portfolio.
Key facts
- Paved parking
- Newer roof
- 5 unit property
Tags
Property features AI
Finance
- Other: Approximately 1 acre lot
- Financial info: 5 total units (all currently leased); Owner pays exterior maintenance, HVAC maintenance, repairs, insurance, snow removal, taxes, and lawn care; Tenants pay all utilities including electricity, gas, water, sewer, trash, cable and internet
Exterior
- Parking: Asphalt parking lot; Additional private parking
- Utilities: Electricity connected; Natural gas connected; Public water; Public sewer
- Home design: Residential income property (apartment, multi-family); Single-story; Two buildings on site; R4 zoning
- Construction: Brick construction; Asphalt roof; Crawl space foundation; Assessor-reported year built
- Exterior features: Private yard; Rear patio; Private entrances; Level lot
Interior
- Kitchen: Electric oven; Electric range; Refrigerator; Range hood
- Bedrooms: All bedrooms on one level
- Flooring: Carpet; Vinyl
- Heating & cooling: Forced-air heating (natural gas); Central air conditioning
- Interior features: Eat-in kitchen; Private entrance
- Laundry & utility: In-unit stacked washer/dryer; Water heater
Neighborhood map
What this means for you Summary
Snapshot
- This is a 5 × 2-bed/1.0-bath units multifamily listed at $390k.
Deal economics
- At list price, monthly cash flow is $515 ($6k/yr) — positive. Per door: $103/mo.
- The deal already cash-flows at list — no discount required.
- Meets the 1% rule at list price ($4k rent vs $390k).
- Recommended offer: $378k (3.0% below list) — sets the bar for market timing.
- Cap rate 9.2% vs local median 3.8% in Napoleon — top-decile yield for the area; either an underpriced asset or a hidden risk that comps aren't pricing in. Stress-test before assuming the spread holds.
Location & tenants
- Location reads 70/100 on livability (#484 in OH) — a middle-class / working-renter tenant base. Strengths: cost of living A+, housing A+; Watch: employment D+, amenities F, commute F.
- Napoleon Area City (town): math 62% / reading 69% proficiency, ranked #208 of 656 in OH (top 32%) — acceptable for families but not a draw, mixed tenant base, ~2y average lease.
- Zoned schools: Napoleon Elementary School (math 75% / reading 74%, grade A, #272 of 1,584 statewide, top 19%, 975 students, 37% FRL); Napoleon Junior/Senior High School (math 49% / reading 64%, grade C, #291 of 781 statewide, top 37%, 787 students, 30% FRL).
- Market conditions: 49 active listings in the ZIP; solid renter incomes; 18 units permitted in Henry County in 2024 (0 in 5+ unit buildings).
- At $4,475/mo this rent would consume 69% of the median local household income ($78k/yr) — very limited rent-growth headroom before tenants either downsize or default.
Forward outlook
- Local home prices are declining (-3.0%/yr); year-one equity from $3k of loan paydown is wiped out by about $12k of value loss. Plan a longer hold.
- Henry County population projected at -14% by 2050 — secular population decline; favor cash flow + early exit over multi-decade hold.
Negotiation context
- It's been on market 31 days — a 3% lower offer ($378k) is reasonable based on typical stale-listing flexibility.
- 7 sale attempts since 22y ago with the ask held roughly flat each time — persistent listings suggest the price (not the market) is what's stuck; bring a comps-based counter.
Risks & watch-outs
- Watch-outs: flood insurance adds $427/mo.
- Climate carrying-cost: in FEMA flood zone AE (mandatory federal flood insurance) — expect insurance premiums to compound above CPI over the hold.
Questions for the listing agent
- It's been on market 31 days. Have you received any prior offers? Is the seller open to a 3% concession, seller financing, or rate buy-down credit?
- Can we see the unit-by-unit rent roll, current vacancy, and any below-market leases? What's the average tenancy length?
- What capital expenditures (roof, boiler, parking lot, exteriors) have been made in the last 5 years, and what's planned in the next 2?
- What's the actual annual flood-insurance premium (NFIP or private), and is the property in a SFHA with mandatory coverage?
- Is there a deadline driving the sale (1031 exchange, divorce, estate, relocation)? That informs how much negotiation room exists.
- Schools are B-rated — typically a magnet for longer-tenancy family renters. What's the average tenant stay here, and is there a school-zone premium baked into asking?
- What's the average days-on-market for RENTAL listings here right now (not sales)? A rising rental-DOM trend means longer vacancies and softer asking-rent achievability than the comps imply.
- What's the recent tenant-quality profile in this submarket — average credit score on applications, eviction rate, late-payment / NSF rate, and stable-employment percentage? A property-management company in the area should have these aggregated.
- How much new apartment / multifamily construction is in the pipeline within 1–3 miles? Heavy new supply (>2% of stock underway) typically softens rents 12–24 months out; light construction supports rent growth.
Investment metrics
- 1% rule
- 1.15% ✓
- Cap rate
- 9.19%
- Cash-on-cash
- 10.35%
- DSCR
- 1.46
- GRM
- 7.3
CMA / ARV
No comps found within radius.
Projected returns pro-forma
-3.0% appreciation · 3.0% rent growth · sell at horizon
- IRR
- -7.5%
- Equity multiple
- 0.72×
- Total profit
- $-30,088
- Equity at exit
- $58,135
- IRR
- 2.2%
- Equity multiple
- 1.16×
- Total profit
- $17,154
- Equity at exit
- $33,711
Cash invested: $109,172 (down + closing). Projections, not guarantees.
Landlord ↔ Tenant lean methodology
- Overall (STATE)
- 73 Landlord-Friendly
- State Ohio
- 73 Landlord-Friendly · R+6
- County
- — inherits STATE
- City
- — inherits STATE
ZIP-level market 43545
- Home prices YoY
- -19.6%
- Active inventory
- 49
- Price-to-rent
- 36.3×
Monthly cashflow live
- Estimated rent
- $4,475 medium interval (Pro) →
- Mortgage (P&I)
- −$2,045
- Tax from tax record
- −$386 /mo · $4,634/yr
- Insurance
- −$162
- Flood insurance flood zone
- −$427 /mo · $5,118/yr
- HOA
- −$0
- Vacancy / Maint / Mgmt
- −$940
- Net cashflow
- $515
Break-even live
5-unit breakdown (identical units grouped — click to expand)
| Units | Beds | Baths | Est. rent |
|---|---|---|---|
| 5× units | 2 | 1 | $4,475 |
| #1 | 2 | 1 | $895 |
| #2 | 2 | 1 | $895 |
| #3 | 2 | 1 | $895 |
| #4 | 2 | 1 | $895 |
| #5 | 2 | 1 | $895 |
| Total (5 units) | $4,475 | ||
UW: 25.0% down · 7.5% · 30yr · 1.5% tax · 5.0% vac · 8.0% maint · 8.0% mgmt
Financing live
Cash to close
- Down payment
- $97,475
- Closing costs
- $11,697
- Reserves months
- —
- Total cash needed
- —
Loan-product check · same deal, 3 products live
Conventional
25% down · 7.5% · 30yr
- Down + closing
- —
- Monthly P&I
- —
- Monthly cashflow
- —
- DSCR
- —
- Eligible?
- —
Personal DTI + credit; lowest rate.
DSCR
20% down · 8.5% · 30yr
- Down + closing
- —
- Monthly P&I
- —
- Monthly cashflow
- —
- DSCR
- —
- Eligible?
- —
No personal income docs; deal must DSCR.
Hard money
10% down · 12.0% · 12mo
- Down + closing
- —
- Monthly P&I
- —
- Monthly cashflow
- —
- DSCR
- —
- Eligible?
- —
Short-term bridge; refi at stabilization.
Listing history 19 events
-
2026-06-07statusdays on market $389,900 Pending 31 DOM
-
2026-06-04days on market $389,900 Contingent 30 DOM
-
2026-06-02days on market $389,900 Contingent 29 DOM
-
2026-06-01days on market $389,900 Contingent 28 DOM
-
2026-05-31days on market $389,900 Contingent 27 DOM
-
2026-05-07historical Contingent
-
2026-04-27$389,900 Active
-
2018-06-15historical
-
2018-04-25$275,000
-
2014-01-24historical
-
2012-01-24$259,000
-
2012-01-22historical
-
2010-01-22$239,000
-
2010-01-10historical
-
2009-07-10$239,000
-
2005-08-01historical
-
2005-05-03$259,900
-
2005-05-01historical
-
2004-11-01$259,900
ⓘ Source: listings_history table (triggers on properties + properties_extension) + one-shot
backfill from property_details.listing_events for pre-trigger history.
Tax reassessment forecast OH · Partial reset (capped growth)
- Current annual tax
- $4,634 · $386/mo
- Projected year-2 tax
- $5,358 · $447/mo
- Expected delta
- +$724/yr (+$60/mo · 15.6%)
ⓘ Screening estimate from a state-policy table — verify with the county assessor before closing.
Climate risk First Street
- Flood 10/10 Extreme FEMA zone AE · 99% chance over 30 yrs
- Wildfire 1/10 Low
- Heat 3/10 Moderate 7 d/yr ≥99°F today · 17 d/yr by 30 yrs out
- Wind 2/10 Low
- Air quality 2/10 Low 1 unhealthy d/yr today · 2 by 30 yrs out
Nearby sold comps map
Loading sold comps map…
Walkable amenities ~0.75 mi
Loading nearby amenities…
Taxation est. · year 1
- Rental income
- $53,700
- − Mortgage interest
- −$21,840
- − Property taxes
- −$4,634
- − Insurance
- −$7,068
- − Repairs & maintenance
- −$4,296
- − Management
- −$4,296
- − Depreciation
- −$11,343
- Taxable income
- $223
- Est. tax owed @ 24.0%
- −$53
- After-tax cash flow
- $6,131/yr
For passive investors: Depreciation is non-cash, so a rental often shows a tax loss while cash-flowing — sheltering income. Rental losses are passive: they offset passive income freely, and up to $25,000/yr can offset ordinary (W-2) income if you actively participate and your MAGI is under $100k (phasing out to $0 by $150k); unused losses carry forward. On sale, claimed depreciation is recaptured at up to 25%, and gains may owe capital-gains tax (a 1031 exchange can defer both). Figures are a year-1 estimate at your 24.0% rate — not tax advice; consult a CPA.
Schools (NCES district)
- District
- Napoleon Area City
- NCES district ID
- 3904443
- Math proficiency
- 62% ▼ -14.00%
- Reading proficiency
- 69% ▼ -4.00%
- Median HH income
- $49,144
- Composite
- 55.53/100
- National rank
- #1243
- State rank
- #208 of 656 in OH
Livability — Napoleon
- Score
- 70/100
- State rank
- #484
- US rank
- #8082
Category grades
Schools grade is shown separately in the Schools card above.
Census & demographics
- Census place
- Napoleon, OH
- County
- Henry · 27,211 people
- City population
- 14,388
- Population (ZIP)
- 14,388
- Household income
- $78,165
- Rent vs Own
- Severe rent burden
- 4.0
Population outlook (Henry County) Hauer SSP2
- Today (2025)
- 27,204 people
- By 2030
- 26,657 · -2.0%
- By 2040
- 25,149 · -7.6%
- By 2050
- 23,361 · -14.1%
- By 2075
- 20,409 · -25.0%
- By 2100
- 18,199 · -33.1%
Race, ethnicity, and origin ACS 2023
- Neighborhood character
- Predominantly White (88%)
- Race & ethnicity
- White 88% Hispanic / Latino 6% Two or more races 4%
- Hispanic origin (detail)
- Mexican 4%
- Common ancestry
- Lithuanian 3% Slovak 2% Romanian 1%
- Foreign-born
- 2% · Canada
- Languages at home
- 95% English-only · Spanish 3% German/W. Germanic 1% Other Indo-European 1%
Political lean MEDSL · Henry
- 2024 margin
- Solid R (+46.7) · D 26.2% · R 72.9%
- 2008→2024 swing
- -33.8pp toward R · 2008: -12.9pp · 2024: -46.7pp
- All cycles
- 2024: R+46.7 2020: R+43.5 2016: R+39.8 2012: R+18.6 2008: R+12.9
Not yet ingested
- Civics
- —
Market trends
- HPI YoY
- ▼ -51.90%
- Current HPI
- 212.3599
- Rent YoY
- —
- Metro
- —
- State GDP YoY
- ▲ 1.98%
- F500 in state
- 48
Industry mix (Fortune 500 HQ in OH)
| Industry | F500 HQs | Revenue |
|---|---|---|
| Insurance | 3 | $145B |
|
||
| Industrial Machinery | 3 | $49B |
|
||
| Financial Services | 3 | $24B |
|
||
| Consumer Goods | 2 | $93B |
|
||
| Aerospace / Defense | 2 | $47B |
|
||
| Utilities | 2 | $33B |
|
||
Price history
+50.0% since first listed14 events — show timeline
- 2026-05-07 Contingent — NORIS
- 2026-04-27 Listed $389,900 NORIS
- 2018-06-15 Listing Removed — NORIS
- 2018-04-25 Listed $275,000 NORIS
- 2014-01-24 Listing Removed — NORIS
- 2012-01-24 Listed $259,000 NORIS
- 2012-01-22 Listing Removed — NORIS
- 2010-01-22 Listed $239,000 NORIS
- 2010-01-10 Listing Removed — NORIS
- 2009-07-10 Listed $239,000 NORIS
- 2005-08-01 Listing Removed — NORIS
- 2005-05-03 Listed $259,900 NORIS
- 2005-05-01 Listing Removed — NORIS
- 2004-11-01 Listed $259,900 NORIS
Property tax history
-2.5%/yrLatest (2025): $4,634 · -0.1% YoY. Source: county tax records.
Cash-flow waterfall
monthlySold comps — $/sqft
last 12 mo · ≤1 miLoading sold comps…