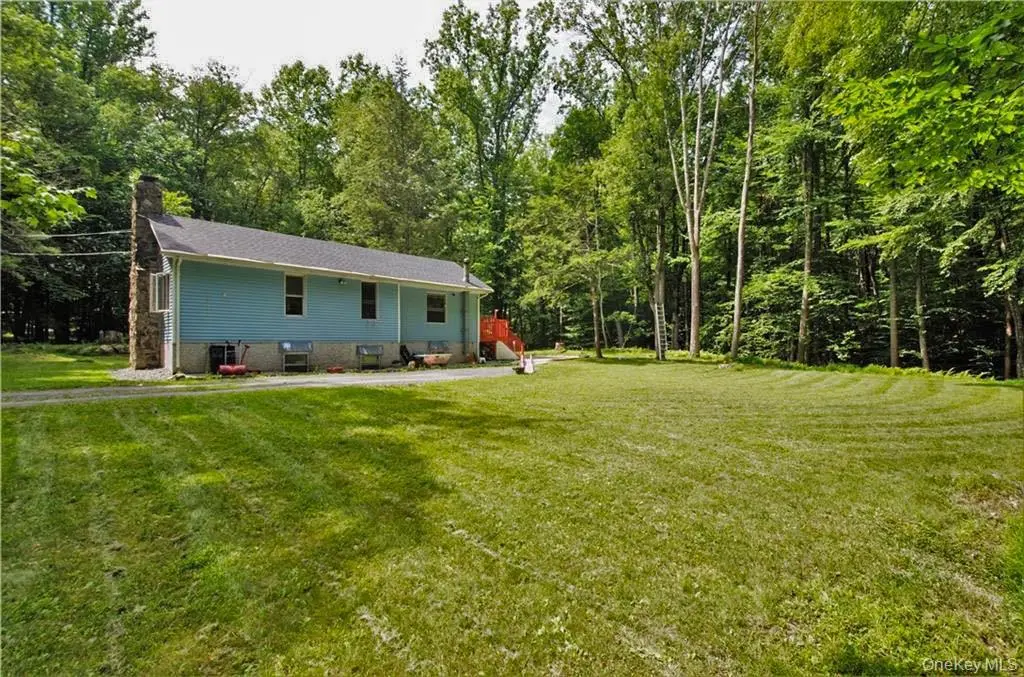
16 Woodland Rd · Otisville, NY
Flood risk 1/10 · Minimal
- FEMA flood zone
- X (unshaded)
- Chance of flooding over 30 yrs
- 0.0%
- Est. flood insurance / yr
- $473 – $860
Fire risk 4/10 · Minor
- Est. fire insurance / yr
- $691 – $1,283
Heat risk 3/10 · Minor
- Hot days now (above 97°F)
- 7 days/yr
- Hot days in 30 yrs
- 15 days/yr
Wind risk 3/10 · Minor
- Chance of severe wind over 30 yrs
- 8.0%
Air-quality risk 2/10 · Minimal
- Unhealthy air days now
- 1 days/yr
- Unhealthy air days in 30 yrs
- 2 days/yr
Risk factors via First Street. Map © Google.
Why this score? — see what drove the C+ grade
The composite is a weighted blend of 9 inputs, each scored 0–100. Each bar is that input's sub-score; the figure is the points it added to the 100-point composite (weight × sub-score).
- Cash flow +20.7/30.0
- ARV discount +15.0/15.0
- DSCR +6.6/10.0
- 1% rule +5.2/10.0
- Schools +5.0/10.0
- Rent growth +4.6/5.0
- Livability +3.5/5.0
- Condition / age +2.5/5.0
- Appreciation +0.0/10.0
$239,000
🖨 Deal sheet 📄 Offer letter ✓ Due diligence
Listing remarks
Welcome home to this very nice three bedroom seasonal ranch located in the Minisink Valley School District in a quiet neighborhood! This private property is surrounded by nature with a large open yard to play and have fun in the sun. The large deck overlooks the private back yard and surrounding woods. The roof has been recently replaced. Sale includes an additional lot of 0.11 acres to bring the total property to 0.28 acres. Look at the Low Taxes! Enjoy peace and quiet on your beautiful property surrounded by woods and a creek. .
Key facts
- Large deck
- Large open yard
- Private back yard
Tags
Property features AI
Exterior
- Parking: Driveway
- Utilities: Septic tank; Electric service by Orange & Rockland; Private trash collection
- Home design: Single-family home; Two-story design
- Construction: Frame construction; Vinyl siding
- Exterior features: Waterfront property; Additional parcel(s) included
Interior
- Kitchen: Refrigerator included
- Bedrooms: Bedrooms include a first-floor bedroom and a main-level primary bedroom
- Bathrooms: 1 full bathroom
- Heating & cooling: Baseboard heating; Oil-fired heating; No central cooling
- Interior features: First-floor bedroom; Primary bedroom on main level; Full basement; Two levels; Deck
Neighborhood map
What this means for you Summary
Snapshot
- This is a 3-bed/1.0-bath single-family listed at $239k.
Deal economics
- At list price, monthly cash flow is $325 ($4k/yr) — positive.
- The deal already cash-flows at list — no discount required.
- Meets the 1% rule at list price ($2k rent vs $239k).
- Recommended offer: $232k (3.0% below list) — sets the bar for market timing.
- Cap rate 7.9% vs local median 2.4% in Otisville — top-decile yield for the area; either an underpriced asset or a hidden risk that comps aren't pricing in. Stress-test before assuming the spread holds.
Location & tenants
- Location reads 70/100 on livability (#459 in NY) — a middle-class / working-renter tenant base. Strengths: employment A+, housing A+, crime A; Watch: amenities F, commute F.
- Minisink Valley Central School District (rural): math 51% / reading 59% proficiency, ranked #254 of 590 in NY (top 43%) — acceptable for families but not a draw, mixed tenant base, ~2y average lease; only 17% free/reduced lunch — higher-income household profile.
- Zoned schools: Otisville Elementary School (math 27% / reading 57%, grade F, #1,361 of 2,108 statewide, top 67%, 589 students, 30% FRL); Minisink Valley Middle School (math 27% / reading 58%, grade D-, #373 of 729 statewide, top 52%, 775 students, 28% FRL); Minisink Valley High School (math 94% / reading 75%, grade A, #379 of 1,100 statewide, top 36%, 1,172 students, 28% FRL).
- Market conditions: Rents rising fast (+8.2%/yr); 273 active listings in the ZIP; solid renter incomes; 1,746 units permitted in Orange County in 2024 (1,265 in 5+ unit buildings).
- This rent runs 34% of the median local income ($87k/yr) — at the standard rent-burdened threshold; future hikes will face affordability resistance.
Forward outlook
- Local home prices are declining (-3.0%/yr); year-one equity from $2k of loan paydown is wiped out by about $7k of value loss. Plan a longer hold.
- At projected returns (-3.0% appreciation + 8.0% rent growth), your $67k cash investment doubles in ~9 years — after that, you're playing with house money.
Negotiation context
- It's been on market 38 days — a 3% lower offer ($232k) is reasonable based on typical stale-listing flexibility.
- 11 sale attempts since 19y ago with the ask held roughly flat each time — persistent listings suggest the price (not the market) is what's stuck; bring a comps-based counter.
- Current owner paid $51k; list at $239k implies a 369% gain — meaningful room to come down on a strong offer.
Questions for the listing agent
- It's been on market 38 days. Have you received any prior offers? Is the seller open to a 3% concession, seller financing, or rate buy-down credit?
- Is there a deadline driving the sale (1031 exchange, divorce, estate, relocation)? That informs how much negotiation room exists.
- Schools are D-rated, which usually means shorter tenancies and higher turnover. Who's the typical renter profile here, and what's been the actual vacancy rate?
- What's the average days-on-market for RENTAL listings here right now (not sales)? A rising rental-DOM trend means longer vacancies and softer asking-rent achievability than the comps imply.
- What's the recent tenant-quality profile in this submarket — average credit score on applications, eviction rate, late-payment / NSF rate, and stable-employment percentage? A property-management company in the area should have these aggregated.
- How much new for-sale + rental construction is in the pipeline within 1–3 miles? Heavy new supply typically softens prices + rents 12–24 months out; constrained supply supports both.
Investment metrics
- 1% rule
- 1.02% ✓
- Cap rate
- 7.93%
- Cash-on-cash
- 5.83%
- DSCR
- 1.26
- GRM
- 8.2
CMA / ARV
- ARV (median comp)
- $409,770
- List price
- $239,000
- Delta
- -41.67%
- Verdict
- UNDERPRICED
- Comps
- 14 within 1.0 mi
Show comp detail 1 sale within ~0.75 mi
| Address | Dist | Beds/Ba | Sqft | Sold | Price | $/sf | Match |
|---|---|---|---|---|---|---|---|
| 3 Birch St | 0.17mi | 2/1.0 (-1) | 624 (-8%) | 3mo | $70,000 | $112 | 70 |
Match score weights: distance 35% · size 25% · config 20% · recency 20%. Top-matched comps best support the ARV.
Projected returns pro-forma
-3.0% appreciation · 8.0% rent growth · sell at horizon
- IRR
- -1.9%
- Equity multiple
- 0.92×
- Total profit
- $-5,164
- Equity at exit
- $35,636
- IRR
- 12.4%
- Equity multiple
- 2.21×
- Total profit
- $80,658
- Equity at exit
- $20,664
Cash invested: $66,920 (down + closing). Projections, not guarantees.
Landlord ↔ Tenant lean methodology
- Overall (STATE)
- 15 Strongly Tenant-Friendly
- State New York
- 15 Strongly Tenant-Friendly · D+10
- County
- — inherits STATE
- City
- — inherits STATE
ZIP-level market 10940
- Home prices YoY
- -18.7%
- Rents YoY
- 8.2%
- Active inventory
- 273
- Price-to-rent
- 8.2×
Monthly cashflow live
- Estimated rent
- $2,431 medium interval (Pro) →
- Mortgage (P&I)
- −$1,253
- Tax from tax record
- −$242 /mo · $2,908/yr
- Insurance
- −$100
- HOA
- −$0
- Vacancy / Maint / Mgmt
- −$511
- Net cashflow
- $325
Break-even live
UW: 25.0% down · 7.5% · 30yr · 1.5% tax · 5.0% vac · 8.0% maint · 8.0% mgmt
Financing live
Cash to close
- Down payment
- $59,750
- Closing costs
- $7,170
- Reserves months
- —
- Total cash needed
- —
Loan-product check · same deal, 3 products live
Conventional
25% down · 7.5% · 30yr
- Down + closing
- —
- Monthly P&I
- —
- Monthly cashflow
- —
- DSCR
- —
- Eligible?
- —
Personal DTI + credit; lowest rate.
DSCR
20% down · 8.5% · 30yr
- Down + closing
- —
- Monthly P&I
- —
- Monthly cashflow
- —
- DSCR
- —
- Eligible?
- —
No personal income docs; deal must DSCR.
Hard money
10% down · 12.0% · 12mo
- Down + closing
- —
- Monthly P&I
- —
- Monthly cashflow
- —
- DSCR
- —
- Eligible?
- —
Short-term bridge; refi at stabilization.
Listing history 48 events
-
2026-06-18days on market $239,000 Active 38 DOM
-
2026-06-17days on market $239,000 Active 37 DOM
-
2026-06-16pricedays on market $239,000 Active 36 DOM
-
2026-06-15days on market $249,000 Active 35 DOM
-
2026-06-14days on market $249,000 Active 33 DOM
-
2026-06-13days on market $249,000 Active 32 DOM
-
2026-06-10days on market $249,000 Active 30 DOM
-
2026-06-09days on market $249,000 Active 29 DOM
-
2026-06-08days on market $249,000 Active 28 DOM
-
2026-06-07days on market $249,000 Active 27 DOM
-
2026-06-03days on market $249,000 Active 23 DOM
-
2026-06-02days on market $249,000 Active 22 DOM
-
2026-06-01days on market $249,000 Active 21 DOM
-
2026-05-31days on market $249,000 Active 20 DOM
-
2026-05-30days on market $249,000 Active 19 DOM
-
2026-05-11$249,000 Active 536-char remark
-
2026-03-03price $246,000
-
2026-03-03status Active
-
2026-03-03price $268,000
-
2026-01-28status Pending
-
2025-12-22price $268,000
-
2025-11-26$275,000 Active
-
2021-09-21historical
-
2021-08-17$169,000 Active
-
2021-07-15historical
-
2021-06-25price $168,000
-
2021-06-06$196,000 Active
-
2016-07-17historical
-
2016-07-11price $51,000
-
2016-07-11soldstatus $51,000 Sold
-
2016-07-09soldstatus $51,000
-
2016-07-08soldstatus $51,000
-
2016-05-24historical Pending
-
2016-05-23price $52,000
-
2016-04-29$52,000 Active
-
2016-04-28$52,000
-
2015-12-30soldstatus $36,400
-
2015-12-19historical Temporarily off Market
-
2015-08-12status Active
-
2015-07-18historical Expired
-
2015-04-16price
-
2014-10-16Active
-
2014-10-16$69,900
-
2008-02-29soldstatus $149,350
-
2008-02-25soldstatus $145,000
-
2007-12-28historical
-
2007-12-28price $149,900
-
2007-06-19$145,000
ⓘ Source: listings_history table (triggers on properties + properties_extension) + one-shot
backfill from property_details.listing_events for pre-trigger history.
Tax reassessment forecast NY · Partial reset (capped growth)
- Current annual tax
- $2,908 · $242/mo
- Projected year-2 tax
- $3,474 · $289/mo
- Expected delta
- +$565/yr (+$47/mo · 19.4%)
ⓘ Screening estimate from a state-policy table — verify with the county assessor before closing.
Climate risk First Street
- Flood 1/10 Low FEMA zone X (unshaded) · 0% chance over 30 yrs
- Wildfire 4/10 Moderate
- Heat 3/10 Moderate 7 d/yr ≥97°F today · 15 d/yr by 30 yrs out
- Wind 3/10 Moderate 8% chance of damaging wind over 30 yrs
- Air quality 2/10 Low 1 unhealthy d/yr today · 2 by 30 yrs out
Nearby sold comps map
Loading sold comps map…
Walkable amenities ~0.75 mi
Loading nearby amenities…
Taxation est. · year 1
- Rental income
- $29,172
- − Mortgage interest
- −$13,388
- − Property taxes
- −$2,908
- − Insurance
- −$1,195
- − Repairs & maintenance
- −$2,334
- − Management
- −$2,334
- − Depreciation
- −$6,953
- Taxable income
- $61
- Est. tax owed @ 24.0%
- −$15
- After-tax cash flow
- $3,888/yr
For passive investors: Depreciation is non-cash, so a rental often shows a tax loss while cash-flowing — sheltering income. Rental losses are passive: they offset passive income freely, and up to $25,000/yr can offset ordinary (W-2) income if you actively participate and your MAGI is under $100k (phasing out to $0 by $150k); unused losses carry forward. On sale, claimed depreciation is recaptured at up to 25%, and gains may owe capital-gains tax (a 1031 exchange can defer both). Figures are a year-1 estimate at your 24.0% rate — not tax advice; consult a CPA.
Schools (NCES district)
- District
- Minisink Valley Central School District
- NCES district ID
- 3619560
- Math proficiency
- 51% ▼ -5.00%
- Reading proficiency
- 59% ▲ 5.00%
- Median HH income
- $84,292
- Composite
- 50.18/100
- National rank
- #1897
- State rank
- #254 of 590 in NY
Livability — Otisville
- Score
- 70/100
- State rank
- #459
- US rank
- #7992
Category grades
Schools grade is shown separately in the Schools card above.
Census & demographics
- County
- Orange County · 267,004 people
- City population
- 3,940
- Metro
- Poughkeepsie-Newburgh-Middletown, NY
- Population (ZIP)
- 53,611
- Household income
- $87,080
- Rent vs Own
- Severe rent burden
- 1846.0
Population outlook (Orange County) Hauer SSP2
- Today (2025)
- 379,830 people
- By 2030
- 378,955 · -0.2%
- By 2040
- 375,444 · -1.2%
- By 2050
- 369,311 · -2.8%
- By 2075
- 354,233 · -6.7%
- By 2100
- 318,150 · -16.2%
Race, ethnicity, and origin ACS 2023
- Neighborhood character
- Highly diverse neighborhood (Simpson 0.70)
- Race & ethnicity
- White 39% Hispanic / Latino 32% Black 20% Two or more races 13% Asian 4% Native American 3%
- Hispanic origin (detail)
- Mexican 9% Puerto Rican 13% Dominican 3%
- Common ancestry
- Romanian 3% Italian 1% Iranian 1%
- Foreign-born
- 18% · Canada, China, Jamaica
- Languages at home
- 72% English-only · Spanish 21% Other Indo-European 2% Chinese 1%
Political lean MEDSL · Orange
- 2024 margin
- Lean R (+8.4) · D 45.8% · R 54.2%
- 2008→2024 swing
- -12.5pp toward R · 2008: 4.1pp · 2024: -8.4pp
- All cycles
- 2024: R+8.4 2020: R+0.2 2016: R+6.5 2012: D+5.2 2008: D+4.1
Not yet ingested
- Civics
- —
Market trends
- HPI YoY
- ▼ -71.68%
- Current HPI
- 311.5969
- Rent YoY
- ▲ 8.23%
- Metro
- Poughkeepsie-Newburgh-Middletown, NY
- State GDP YoY
- ▲ 2.60%
- F500 in state
- 92
Industry mix (Fortune 500 HQ in NY)
| Industry | F500 HQs | Revenue |
|---|---|---|
| Financial Services | 10 | $950B |
|
||
| Consumer Goods | 9 | $162B |
|
||
| Insurance | 4 | $225B |
|
||
| Telecommunications | 2 | $144B |
|
||
| Pharmaceuticals | 2 | $112B |
|
||
| Media / Entertainment | 2 | $69B |
|
||
Price history
+64.8% since first listed34 events — show timeline
- 2026-06-16 Price Changed $239,000 OneKey® MLS as Distributed by MLS Grid
- 2026-05-11 Listed $249,000 OneKey® MLS as Distributed by MLS Grid
- 2026-03-03 Price Changed $246,000 OneKey® MLS as Distributed by MLS Grid
- 2026-03-03 Relisted — OneKey® MLS as Distributed by MLS Grid
- 2026-03-03 Price Changed $268,000 OneKey® MLS as Distributed by MLS Grid
- 2026-01-28 Pending — OneKey® MLS as Distributed by MLS Grid
- 2025-12-22 Price Changed $268,000 OneKey® MLS as Distributed by MLS Grid
- 2025-11-26 Listed $275,000 OneKey® MLS as Distributed by MLS Grid
- 2021-09-21 Listing Removed — OneKey® MLS as Distributed by MLS Grid
- 2021-08-17 Listed $169,000 OneKey® MLS as Distributed by MLS Grid
- 2021-07-15 Listing Removed — OneKey® MLS as Distributed by MLS Grid
- 2021-06-25 Price Changed $168,000 OneKey® MLS as Distributed by MLS Grid
- 2021-06-06 Listed $196,000 OneKey® MLS as Distributed by MLS Grid
- 2016-07-17 Listing Removed — OneKey® MLS as Distributed by MLS Grid
- 2016-07-11 Sold (MLS) $51,000 HGMLS
- 2016-07-11 Price Changed $51,000 HGMLS
- 2016-07-09 Sold (MLS) $51,000 OneKey® MLS as Distributed by MLS Grid
- 2016-07-08 Sold (Public Records) $51,000 Public Records
- 2016-05-24 Contingent — HGMLS
- 2016-05-23 Price Changed $52,000 HGMLS
- 2016-04-29 Listed $52,000 HGMLS
- 2016-04-28 Listed $52,000 OneKey® MLS as Distributed by MLS Grid
- 2015-12-30 Sold (Public Records) $36,400 Public Records
- 2015-12-19 Delisted — HGMLS
- 2015-08-12 Relisted — HGMLS
- 2015-07-18 Delisted — HGMLS
- 2015-04-16 Price Changed — HGMLS
- 2014-10-16 Listed — HGMLS
- 2014-10-16 Listed $69,900 OneKey® MLS as Distributed by MLS Grid
- 2008-02-29 Sold (Public Records) $149,350 Public Records
- 2008-02-25 Sold (MLS) $145,000 HGMLS
- 2007-12-28 Price Changed $149,900 HGMLS
- 2007-12-28 Delisted — HGMLS
- 2007-06-19 Listed $145,000 HGMLS
Property tax history
+0.6%/yrLatest (2025): $2,908 · +3.9% YoY. Source: county tax records.
Cash-flow waterfall
monthlySold comps — $/sqft
last 12 mo · ≤1 miLoading sold comps…