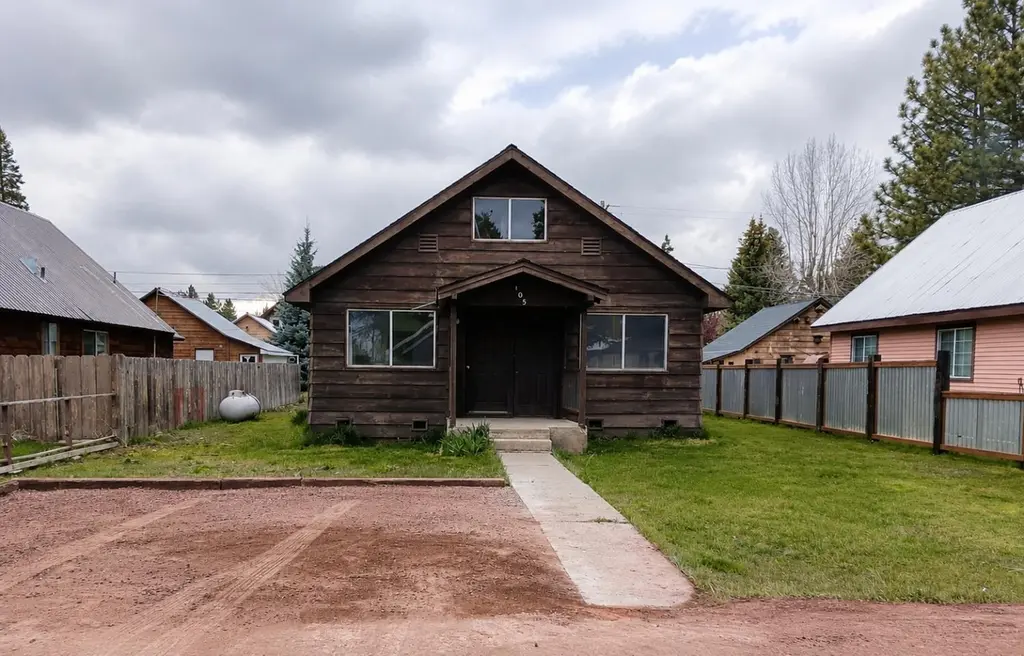
105 Elm St · Westwood, CA
Flood risk 6/10 · Moderate
- FEMA flood zone
- X (unshaded)
- Chance of flooding over 30 yrs
- 0.71%
- Est. flood insurance / yr
- $507 – $1,088
Fire risk 7/10 · Major
- Est. fire insurance / yr
- $659 – $1,223
Heat risk 3/10 · Minor
- Hot days now (above 87°F)
- 7 days/yr
- Hot days in 30 yrs
- 18 days/yr
Wind risk 1/10 · Minimal
- Chance of severe wind over 30 yrs
- —
Air-quality risk 10/10 · Severe
- Unhealthy air days now
- 24 days/yr
- Unhealthy air days in 30 yrs
- 26 days/yr
Risk factors via First Street. Map © Google.
Why this score? — see what drove the C grade
The composite is a weighted blend of 9 inputs, each scored 0–100. Each bar is that input's sub-score; the figure is the points it added to the 100-point composite (weight × sub-score).
- Cash flow +27.2/30.0
- DSCR +9.5/10.0
- 1% rule +6.2/10.0
- Appreciation +5.7/10.0
- Livability +3.1/5.0
- Schools +3.0/10.0
- Rent growth +2.5/5.0
- Condition / age +2.5/5.0
- ARV discount +0.0/15.0
$169,000
🖨 Deal sheet (PDF) 📄 Offer letter ✓ Due diligence
Listing remarks
This is move-in ready and beautifully updated, this home offers flexibility, value, and future upside. The recent remodel makes it perfect to enjoy as-is, while the layout easily allows for adding a half bath and two additional bedrooms for growing needs or increased equity. The two-car garage features a spacious second level, perfect for storage, a workshop, or potential ADU conversion, with power already in place. Enjoy paved off-street parking, fresh interior paint, and a new oven and dishwasher done and ready for you. Cozy up with both a wood-burning fireplace and a gas fireplace, adding charm and comfort year-round. Located in an excellent neighborhood with thoughtful neighbors, you're
Key facts
- Recent remodel
- Gas fireplace
- Two car garage
Tags
Property features AI
Finance
- HOA & community: No homeowners association; Not a senior community
Exterior
- Parking: Detached rear-facing garage; 2 garage spaces
- Utilities: Propane tank owned; 220-volt electrical service; Public water; Public sewer; Irrigation from public district
- Home design: Detached single-family residence; Built in 1930; Single-story
- Construction: Detached construction
- Exterior features: Composition roof; Lot noted as 'See Remarks'
Interior
- Kitchen: Free-standing gas range; Dishwasher; Pantry closet; Breakfast bar/space for dining
- Bedrooms: 3 bedrooms (all on the main level)
- Flooring: Laminate flooring; Wood flooring
- Bathrooms: 1 full bathroom with double sinks, tub with shower over, and window
- Heating & cooling: Propane heating; Hot water heating; Wood stove; Ceiling fans; Window air conditioning units
- Interior features: Great room living area; Two fireplaces (wood burning and gas-piped); Breakfast area and breakfast room; Pantry closet; Breakfast nook and dining bar with space in the kitchen
- Laundry & utility: Washer included; Gas water heater
Neighborhood map
What this means for you Summary
Snapshot
- This is a 2-bed/1.0-bath single-family listed at $169k.
Deal economics
- At list price, monthly cash flow is $484 ($6k/yr) — positive.
- The deal already cash-flows at list — no discount required.
- Meets the 1% rule at list price ($2k rent vs $169k).
- Recommended offer: $166k (1.5% below list) — sets the bar for market timing.
Location & tenants
- Location reads 61/100 on livability (#547 in CA) — a middle-class / working-renter tenant base. Strengths: housing A+, crime B; Watch: amenities F, commute F, employment D-.
- Westwood Unified (rural): math 30% / reading 35% proficiency, ranked #995 of 1,400 in CA (top 71%) — families likely to look elsewhere, expect single-tenant / working-renter base with shorter leases.
- Zoned schools: Fletcher Walker Elementary (math 5% / reading 24%, grade F, #1,420 of 1,571 statewide, top 91%, 89 students, 80% FRL); Westwood High (math 15% / reading 44%, grade F, #723 of 1,170 statewide, top 64%, 85 students, 69% FRL) — zoned schools average 75% FRL vs 53% district-wide (21 pts higher); higher-poverty schools than district average — tighter screening recommended.
- Market conditions: 239 active listings in the ZIP; 6 units permitted in Lassen County in 2024 (0 in 5+ unit buildings).
Forward outlook
- In year one you build about $3k of equity ($1k loan paydown + $2k appreciation (1.4% local appreciation)).
- Lassen County population projected at -14% by 2050 — secular population decline; favor cash flow + early exit over multi-decade hold.
- At projected returns (1.4% appreciation + 3.0% rent growth), your $47k cash investment doubles in ~5 years — after that, you're playing with house money.
- By year 9, paydown + projected appreciation supports a ~$31k cash-out refi (75% LTV) — recoverable capital for the next deal without selling this one.
Negotiation context
- It's been on market 23 days — a 2% lower offer ($166k) is reasonable based on typical stale-listing flexibility.
- Current owner paid $70k; list at $169k implies a 141% gain — meaningful room to come down on a strong offer.
Risks & watch-outs
- Watch-outs: built in 1930 — expect roof / HVAC / electrical / plumbing capex.
- Climate carrying-cost: major flood risk; major wildfire risk — expect insurance premiums to compound above CPI over the hold.
Questions for the listing agent
- Built in 1930 — when were the roof, HVAC, electrical panel, plumbing, and water heater last replaced?
- Is there a deadline driving the sale (1031 exchange, divorce, estate, relocation)? That informs how much negotiation room exists.
- What's the average days-on-market for RENTAL listings here right now (not sales)? A rising rental-DOM trend means longer vacancies and softer asking-rent achievability than the comps imply.
- What's the recent tenant-quality profile in this submarket — average credit score on applications, eviction rate, late-payment / NSF rate, and stable-employment percentage? A property-management company in the area should have these aggregated.
- How much new for-sale + rental construction is in the pipeline within 1–3 miles? Heavy new supply typically softens prices + rents 12–24 months out; constrained supply supports both.
Investment metrics
- 1% rule
- 1.12% ✓
- Cap rate
- 9.73%
- Cash-on-cash
- 12.26%
- DSCR
- 1.55
- GRM
- 7.4
CMA / ARV
- ARV (on-the-fly)
- $119,180
- Comps found
- 8
Show comp detail 8 sales within ~0.75 mi
| Address | Dist | Beds/Ba | Sqft | Sold | Price | $/sf | Match |
|---|---|---|---|---|---|---|---|
| 120 Fair Dr | 0.08mi | 2/1.0 | 992 (-2%) | 14mo | $165,000 | $166 | 81 |
| 124 Fir Street St | 0.10mi | 3/1.0 (+1) | 1,008 (-0%) | 15mo | $80,000 | $79 | 77 |
| 220 Elm Street St | 0.21mi | 2/1.0 | 1,097 (+9%) | 7mo | $115,000 | $105 | 70 |
| 215 Elm St | 0.18mi | 3/1.0 (+1) | 1,118 (+11%) | 4mo | $132,000 | $118 | 66 |
| 112 Fir Street St | 0.05mi | 3/2.0 (+1) | 1,144 (+13%) | 2mo | $207,000 | $181 | 64 |
| 210 Elm Street St | 0.16mi | 3/1.0 (+1) | 1,078 (+7%) | 22mo | $50,000 | $46 | 58 |
| 608 Delwood Street St | 0.71mi | 2/1.0 | 1,122 (+11%) | 12mo | $140,000 | $125 | 39 |
| 403 Elm Street St | 0.41mi | 3/2.0 (+1) | 1,144 (+13%) | 22mo | $127,500 | $111 | 32 |
Match score weights: distance 35% · size 25% · config 20% · recency 20%. Top-matched comps best support the ARV.
Projected returns pro-forma
1.38% appreciation · 3.0% rent growth · sell at horizon
- IRR
- 15.0%
- Equity multiple
- 1.78×
- Total profit
- $37,033
- Equity at exit
- $61,035
- IRR
- 18.1%
- Equity multiple
- 3.27×
- Total profit
- $107,301
- Equity at exit
- $83,759
Cash invested: $47,320 (down + closing). Projections, not guarantees.
Landlord ↔ Tenant lean methodology
- Overall (STATE)
- 18 Strongly Tenant-Friendly
- State California
- 18 Strongly Tenant-Friendly · D+13
- County
- — inherits STATE
- City
- — inherits STATE
ZIP-level market 96137
- Home prices YoY
- 0.9%
- Active inventory
- 239
- Price-to-rent
- 7.4×
Monthly cashflow live
- Estimated rent
- $1,896 medium interval (Pro) →
- Mortgage (P&I)
- −$886
- Tax from tax record
- −$57 /mo · $690/yr
- Insurance
- −$70
- HOA
- −$0
- Vacancy / Maint / Mgmt
- −$398
- Net cashflow
- $484
Break-even live
Sensitivity live
| Price | -10% $579 | -5% $531 | +0% $484 | +5% $436 | +10% $388 |
|---|---|---|---|---|---|
| Rent | -10% $334 | -5% $409 | +0% $484 | +5% $558 | +10% $633 |
| Rate | -1.0pp $569 | -0.5pp $527 | base $484 | +0.5pp $440 | +1.0pp $395 |
UW: 25.0% down · 7.5% · 30yr · 1.5% tax · 5.0% vac · 8.0% maint · 8.0% mgmt
Financing live
Cash to close
- Down payment
- $42,250
- Closing costs
- $5,070
- Reserves months
- —
- Total cash needed
- —
Loan-product check · same deal, 3 products live
Conventional
25% down · 7.5% · 30yr
- Down + closing
- —
- Monthly P&I
- —
- Monthly cashflow
- —
- DSCR
- —
- Eligible?
- —
Personal DTI + credit; lowest rate.
DSCR
20% down · 8.5% · 30yr
- Down + closing
- —
- Monthly P&I
- —
- Monthly cashflow
- —
- DSCR
- —
- Eligible?
- —
No personal income docs; deal must DSCR.
Hard money
10% down · 12.0% · 12mo
- Down + closing
- —
- Monthly P&I
- —
- Monthly cashflow
- —
- DSCR
- —
- Eligible?
- —
Short-term bridge; refi at stabilization.
Listing history 12 events
-
2026-06-12statusdays on market $169,000 Pending 23 DOM
-
2026-06-09days on market $169,000 Active 21 DOM
-
2026-06-08days on market $169,000 Active 20 DOM
-
2026-06-07days on market $169,000 Active 19 DOM
-
2026-06-04days on market $169,000 Active 15 DOM
-
2026-06-02days on market $169,000 Active 14 DOM
-
2026-06-01days on market $169,000 Active 13 DOM
-
2026-05-31days on market $169,000 Active 12 DOM
-
2026-05-31days on market $169,000 Active 11 DOM
-
2025-08-18soldstatus $70,000
-
2004-09-24soldstatus $134,000
-
1994-07-29soldstatus $30,000
ⓘ Source: listings_history table (triggers on properties + properties_extension) + one-shot
backfill from property_details.listing_events for pre-trigger history.
Tax reassessment forecast CA · Resets to sale price
- Current annual tax
- $690 · $57/mo
- Projected year-2 tax
- $1,284 · $107/mo
- Expected delta
- +$595/yr (+$50/mo · 86.2%)
ⓘ Screening estimate from a state-policy table — verify with the county assessor before closing.
Climate risk First Street
- Flood 6/10 Major FEMA zone X (unshaded) · 71% chance over 30 yrs
- Wildfire 7/10 Severe
- Heat 3/10 Moderate 7 d/yr ≥87°F today · 18 d/yr by 30 yrs out
- Wind 1/10 Low
- Air quality 10/10 Extreme 24 unhealthy d/yr today · 26 by 30 yrs out
Nearby sold comps map
Loading sold comps map…
Walkable amenities ~0.75 mi
Loading nearby amenities…
Taxation est. · year 1
- Rental income
- $22,750
- − Mortgage interest
- −$9,467
- − Property taxes
- −$690
- − Insurance
- −$845
- − Repairs & maintenance
- −$1,820
- − Management
- −$1,820
- − Depreciation
- −$4,916
- Taxable income
- $3,192
- Est. tax owed @ 24.0%
- −$766
- After-tax cash flow
- $5,037/yr
For passive investors: Depreciation is non-cash, so a rental often shows a tax loss while cash-flowing — sheltering income. Rental losses are passive: they offset passive income freely, and up to $25,000/yr can offset ordinary (W-2) income if you actively participate and your MAGI is under $100k (phasing out to $0 by $150k); unused losses carry forward. On sale, claimed depreciation is recaptured at up to 25%, and gains may owe capital-gains tax (a 1031 exchange can defer both). Figures are a year-1 estimate at your 24.0% rate — not tax advice; consult a CPA.
Schools (NCES district)
- District
- Westwood Unified
- NCES district ID
- 0642300
- Math proficiency
- 30% ▬ 0.00%
- Reading proficiency
- 35% ▼ -10.00%
- Median HH income
- $38,831
- Composite
- 29.93/100
- National rank
- #11664
- State rank
- #995 of 1400 in CA
Livability — Westwood
- Score
- 61/100
- State rank
- #547
- US rank
- #18201
Category grades
Schools grade is shown separately in the Schools card above.
Census & demographics
- Census place
- Westwood, CA
- Population (ZIP)
- 2,717
Population outlook (Lassen County) Hauer SSP2
- Today (2025)
- 27,112 people
- By 2030
- 26,732 · -1.4%
- By 2040
- 25,536 · -5.8%
- By 2050
- 23,262 · -14.2%
- By 2075
- 18,620 · -31.3%
- By 2100
- 14,679 · -45.9%
Race, ethnicity, and origin ACS 2023
- Neighborhood character
- Predominantly White (81%)
- Race & ethnicity
- White 81% Hispanic / Latino 10% Two or more races 8% Native American 4%
- Hispanic origin (detail)
- Mexican 5%
- Common ancestry
- Slovak 4% Lithuanian 3% Italian 2%
- Foreign-born
- 4% · Canada
- Languages at home
- 93% English-only · Spanish 5% Other Indo-European 1%
Political lean MEDSL · Lassen
- 2024 margin
- Solid R (+54.0) · D 21.8% · R 75.8% · Other 2.4%
- 2008→2024 swing
- -19.8pp toward R · 2008: -34.2pp · 2024: -54.0pp
- All cycles
- 2024: R+54.0 2020: R+51.5 2016: R+51.3 2012: R+39.8 2008: R+34.2
Not yet ingested
- Civics
- —
Market trends
- HPI YoY
- ▲ 1.38%
- Current HPI
- 153.1005
- Rent YoY
- —
- Metro
- —
- State GDP YoY
- ▲ 3.21%
- F500 in state
- 116
Industry mix (Fortune 500 HQ in CA)
| Industry | F500 HQs | Revenue |
|---|---|---|
| Technology | 27 | $1,492B |
|
||
| Financial Services | 3 | $174B |
|
||
| Retail | 3 | $44B |
|
||
| Insurance | 3 | $26B |
|
||
| Media / Entertainment | 2 | $115B |
|
||
| Pharmaceuticals / Biotech | 2 | $62B |
|
||
Price history
+133.3% since first listed3 events — show timeline
- 2025-08-18 Sold (Public Records) $70,000 Public Records
- 2004-09-24 Sold (Public Records) $134,000 Public Records
- 1994-07-29 Sold (Public Records) $30,000 Public Records
Property tax history
+2.7%/yrLatest (2025): $690 · +2.0% YoY. Source: county tax records.
Cash-flow waterfall
monthlySold comps — $/sqft
last 12 mo · ≤1 miLoading sold comps…