 🏷️ Likely Rental
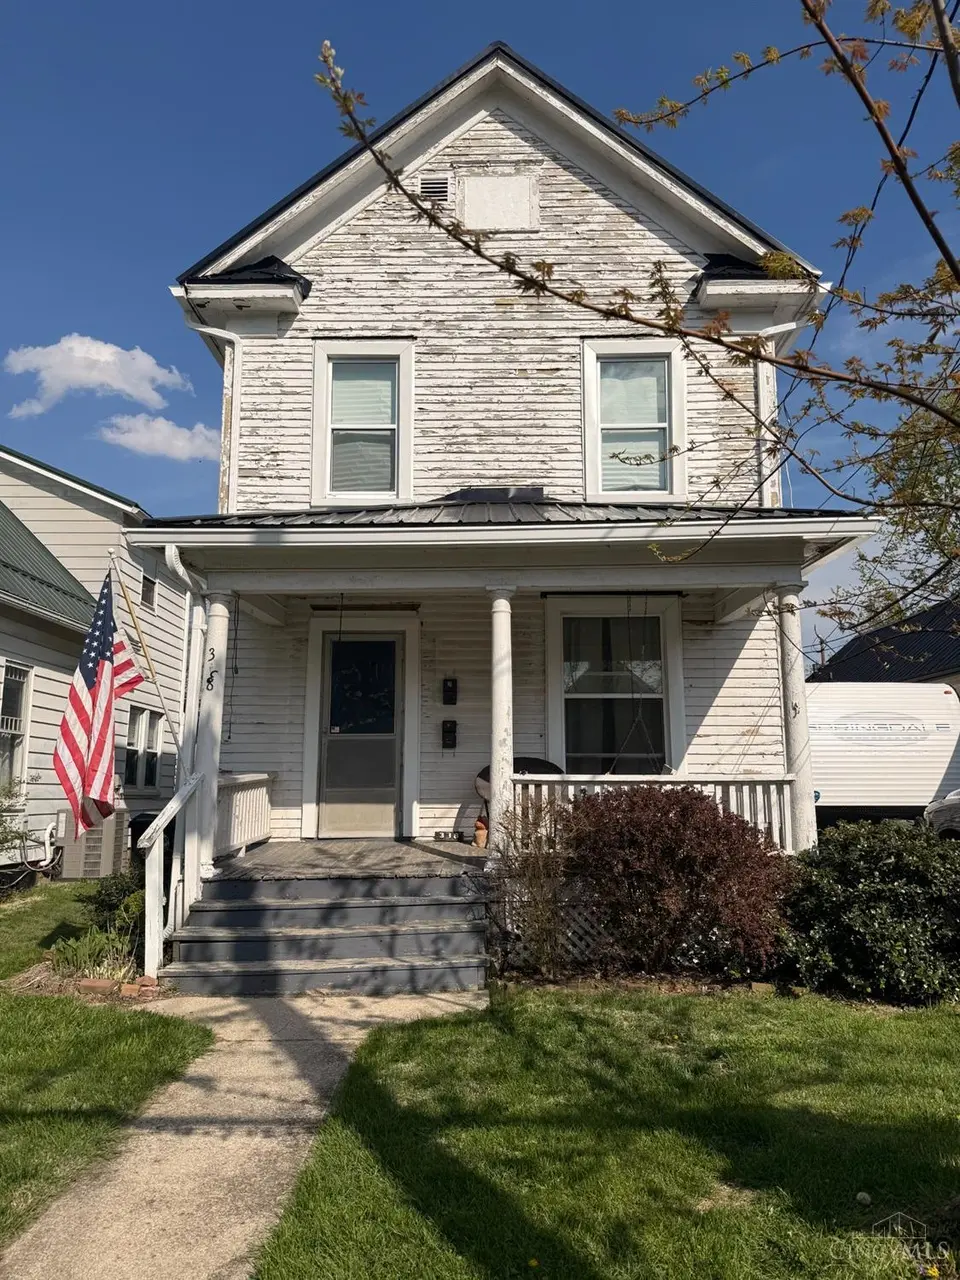
338 N Spring St · Wilmington, OH
Flood risk 1/10 · Minimal
- FEMA flood zone
- X (unshaded)
- Chance of flooding over 30 yrs
- 0.0%
- Est. flood insurance / yr
- $473 – $860
Fire risk 1/10 · Minimal
- Est. fire insurance / yr
- $713 – $1,323
Heat risk 3/10 · Minor
- Hot days now (above 99°F)
- 7 days/yr
- Hot days in 30 yrs
- 19 days/yr
Wind risk 2/10 · Minimal
- Chance of severe wind over 30 yrs
- 1.0%
Air-quality risk 2/10 · Minimal
- Unhealthy air days now
- 1 days/yr
- Unhealthy air days in 30 yrs
- 2 days/yr
Risk factors via First Street. Map © Google.
Why this score? — see what drove the B+ grade
The composite is a weighted blend of 9 inputs, each scored 0–100. Each bar is that input's sub-score; the figure is the points it added to the 100-point composite (weight × sub-score).
- Cash flow +30.0/30.0
- ARV discount +15.0/15.0
- 1% rule +10.0/10.0
- DSCR +10.0/10.0
- Schools +3.9/10.0
- Livability +3.9/5.0
- Rent growth +2.5/5.0
- Condition / age +2.5/5.0
- Appreciation +0.0/10.0
$119,900
🖨 Deal sheet 📄 Offer letter ✓ Due diligence
Listing remarks MLS
Opportunity is knocking with this income-producing duplex in a highly desirable location! Featuring brand new roof and windows, the heavy lifting has already been startedleaving room for you to bring your vision and add value. The property includes two units! Unit 1: 2 bedrooms, 1 full bath, Unit 2: 1 bedroom, 1 full bath. Currently tenant-occupied and generating income, this is a solid option for investors or savvy buyers looking to house hack. With a little TLC, this duplex has the potential to significantly increase its value and rental income. Whether you're looking to grow your portfolio or get started in real estate investing, this one checks the boxes, location, income, and upside!
Key facts
- Brand new roof
- Two units
- Brand new windows
Tags
Neighborhood map
What this means for you Summary
Snapshot
- This is a 4-bed/2.0-bath single-family listed at $120k.
Deal economics
- At list price, monthly cash flow is $1k ($12k/yr) — positive.
- The deal already cash-flows at list — no discount required.
- Meets the 1% rule at list price ($2k rent vs $120k).
- Recommended offer: $113k (6.0% below list) — sets the bar for market timing.
- Cap rate 16.3% vs local median 6.2% in Wilmington — top-decile yield for the area; either an underpriced asset or a hidden risk that comps aren't pricing in. Stress-test before assuming the spread holds.
Location & tenants
- Location reads 77/100 on livability (#202 in OH, #3,127 nationally) — a middle-class / working-renter tenant base. Strengths: cost of living A+, housing A+, health & safety A+; Watch: schools C-, amenities D, commute F.
- Wilmington City (town): math 42% / reading 51% proficiency, ranked #492 of 656 in OH (top 75%) — families likely to look elsewhere, expect single-tenant / working-renter base with shorter leases.
- Market conditions: 107 active listings in the ZIP; 2 comparable units currently listed for rent nearby; 119 units permitted in Clinton County in 2024 (0 in 5+ unit buildings).
- This rent runs 38% of the median local income ($70k/yr) — at the standard rent-burdened threshold; future hikes will face affordability resistance.
Forward outlook
- Local home prices are declining (-3.0%/yr); year-one equity from $829 of loan paydown is wiped out by about $4k of value loss. Plan a longer hold.
- Clinton County population projected at -12% by 2050 — secular population decline; favor cash flow + early exit over multi-decade hold.
- At projected returns (-3.0% appreciation + 3.0% rent growth), your $34k cash investment doubles in ~4 years — after that, you're playing with house money.
Negotiation context
- It's been on market 70 days — a 6% lower offer ($113k) is reasonable based on typical stale-listing flexibility.
- 2 sale attempts since 5y ago; this cycle's ask has dropped $30k (20%) from the opening price — seller is motivated, your offer sets the floor, not the list.
- Current owner paid $55k; list at $120k implies a 118% gain — meaningful room to come down on a strong offer.
Risks & watch-outs
- Watch-outs: built in 1900 — expect roof / HVAC / electrical / plumbing capex.
Questions for the listing agent
- It's been on market 70 days. Have you received any prior offers? Is the seller open to a 6% concession, seller financing, or rate buy-down credit?
- Built in 1900 — when were the roof, HVAC, electrical panel, plumbing, and water heater last replaced?
- Why hasn't it sold? Are there any deal-killer items the seller is aware of (foundation, flood, title, zoning, code violations)?
- Is there a deadline driving the sale (1031 exchange, divorce, estate, relocation)? That informs how much negotiation room exists.
- What's the average days-on-market for RENTAL listings here right now (not sales)? A rising rental-DOM trend means longer vacancies and softer asking-rent achievability than the comps imply.
- What's the recent tenant-quality profile in this submarket — average credit score on applications, eviction rate, late-payment / NSF rate, and stable-employment percentage? A property-management company in the area should have these aggregated.
- How much new for-sale + rental construction is in the pipeline within 1–3 miles? Heavy new supply typically softens prices + rents 12–24 months out; constrained supply supports both.
Investment metrics
- 1% rule
- 1.88% ✓
- Cap rate
- 16.33%
- Cash-on-cash
- 35.86%
- DSCR
- 2.60
- GRM
- 4.4
CMA / ARV
- ARV (median comp)
- $188,814
- List price
- $119,900
- Delta
- -36.50%
- Verdict
- UNDERPRICED
- Comps
- 6 within 1.0 mi
Show comp detail 12 sales within ~0.75 mi
| Address | Dist | Beds/Ba | Sqft | Sold | Price | $/sf | Match |
|---|---|---|---|---|---|---|---|
| 69 W Vine St | 0.10mi | 4/2.0 | 1,638 (-0%) | 2mo | $225,000 | $137 | 94 |
| 570 N Walnut St | 0.33mi | 4/2.0 | 1,605 (-2%) | 1mo | $220,000 | $137 | 80 |
| 231 Thorne Ave | 0.35mi | 3/2.5 (-1) | 1,677 (+2%) | 1mo | $255,700 | $152 | 72 |
| 996 N South St | 0.61mi | 3/2.5 (-1) | 1,657 (+1%) | 3mo | $250,000 | $151 | 61 |
| 978 N South St | 0.61mi | 3/2.5 (-1) | 1,657 (+1%) | 3mo | $250,000 | $151 | 61 |
| 966 N South St | 0.61mi | 3/2.5 (-1) | 1,657 (+1%) | 3mo | $250,000 | $151 | 61 |
| 324 S Walnut St | 0.67mi | 3/1.0 (-1) | 1,655 (+1%) | 6mo | $169,000 | $102 | 54 |
| 302 Lorish Ave | 0.51mi | 3/2.0 (-1) | 1,476 (-10%) | 2mo | $265,000 | $180 | 52 |
| 1015 N South St | 0.61mi | 4/2.5 | 1,844 (+12%) | 6mo | $304,900 | $165 | 44 |
| 346 Virginia Cir | 0.45mi | 3/3.0 (-1) | 1,888 (+15%) | 1mo | $295,000 | $156 | 44 |
| 269 Virginia Cir | 0.52mi | 3/1.5 (-1) | 1,408 (-14%) | 2mo | $260,000 | $185 | 43 |
| 328 A St | 0.53mi | 3/2.0 (-1) | 1,400 (-15%) | 6mo | $254,500 | $182 | 41 |
Match score weights: distance 35% · size 25% · config 20% · recency 20%. Top-matched comps best support the ARV.
Projected returns pro-forma
-3.0% appreciation · 3.0% rent growth · sell at horizon
- IRR
- 31.5%
- Equity multiple
- 2.32×
- Total profit
- $44,461
- Equity at exit
- $17,877
- IRR
- 38.7%
- Equity multiple
- 4.60×
- Total profit
- $120,986
- Equity at exit
- $10,367
Cash invested: $33,572 (down + closing). Projections, not guarantees.
Landlord ↔ Tenant lean methodology
- Overall (STATE)
- 73 Landlord-Friendly
- State Ohio
- 73 Landlord-Friendly · R+6
- County
- — inherits STATE
- City
- — inherits STATE
ZIP-level market 45177
- Active inventory
- 107
- Price-to-rent
- 4.4×
Monthly cashflow live
- Estimated rent
- $2,250 medium interval (Pro) →
- Mortgage (P&I)
- −$629
- Tax from tax record
- −$96 /mo · $1,148/yr
- Insurance
- −$50
- HOA
- −$0
- Vacancy / Maint / Mgmt
- −$472
- Net cashflow
- $1,003
Break-even live
UW: 25.0% down · 7.5% · 30yr · 1.5% tax · 5.0% vac · 8.0% maint · 8.0% mgmt
Financing live
Cash to close
- Down payment
- $29,975
- Closing costs
- $3,597
- Reserves months
- —
- Total cash needed
- —
Loan-product check · same deal, 3 products live
Conventional
25% down · 7.5% · 30yr
- Down + closing
- —
- Monthly P&I
- —
- Monthly cashflow
- —
- DSCR
- —
- Eligible?
- —
Personal DTI + credit; lowest rate.
DSCR
20% down · 8.5% · 30yr
- Down + closing
- —
- Monthly P&I
- —
- Monthly cashflow
- —
- DSCR
- —
- Eligible?
- —
No personal income docs; deal must DSCR.
Hard money
10% down · 12.0% · 12mo
- Down + closing
- —
- Monthly P&I
- —
- Monthly cashflow
- —
- DSCR
- —
- Eligible?
- —
Short-term bridge; refi at stabilization.
Rent comps 2 comps
| Address | Beds | Baths | Sqft | Rent | $/sqft | DOM | Units | Dist |
|---|---|---|---|---|---|---|---|---|
| 996 N South St Wilmington, OH | 3.0 | 2.5 | 1657 | $2,300 | $1.39 | 43d | 1 | 0.62mi |
| 978 N South St Wilmington, OH | 3.0 | 2.5 | 1657 | $2,200 | $1.33 | 2d | 1 | 0.62mi |
Listing history 23 events
-
2026-06-18days on market $119,900 Active 70 DOM
-
2026-06-17days on market $119,900 Active 69 DOM
-
2026-06-16days on market $119,900 Active 68 DOM
-
2026-06-15days on market $119,900 Active 67 DOM
-
2026-06-14days on market $119,900 Active 65 DOM
-
2026-06-10days on market $119,900 Active 62 DOM
-
2026-06-09days on market $119,900 Active 61 DOM
-
2026-06-08pricedays on market $119,900 Active 60 DOM
-
2026-06-07days on market $129,900 Active 59 DOM
-
2026-06-05days on market $129,900 Active 56 DOM
-
2026-06-03days on market $129,900 Active 55 DOM
-
2026-06-02days on market $129,900 Active 54 DOM
-
2026-06-01days on market $129,900 Active 53 DOM
-
2026-05-31days on market $129,900 Active 52 DOM
-
2026-05-31days on market $129,900 Active 51 DOM
-
2026-05-12price $129,900 697-char remark
Show marketing remark (697 chars)
Opportunity is knocking with this income-producing duplex in a highly desirable location! Featuring brand new roof and windows, the heavy lifting has already been startedleaving room for you to bring your vision and add value. The property includes two units! Unit 1: 2 bedrooms, 1 full bath, Unit 2: 1 bedroom, 1 full bath. Currently tenant-occupied and generating income, this is a solid option for investors or savvy buyers looking to house hack. With a little TLC, this duplex has the potential to significantly increase its value and rental income. Whether you're looking to grow your portfolio or get started in real estate investing, this one checks the boxes, location, income, and upside!
-
2026-04-27price $139,900 697-char remark
Show marketing remark (697 chars)
Opportunity is knocking with this income-producing duplex in a highly desirable location! Featuring brand new roof and windows, the heavy lifting has already been startedleaving room for you to bring your vision and add value. The property includes two units! Unit 1: 2 bedrooms, 1 full bath, Unit 2: 1 bedroom, 1 full bath. Currently tenant-occupied and generating income, this is a solid option for investors or savvy buyers looking to house hack. With a little TLC, this duplex has the potential to significantly increase its value and rental income. Whether you're looking to grow your portfolio or get started in real estate investing, this one checks the boxes, location, income, and upside!
-
2026-04-08$149,900 Active 697-char remark
Show marketing remark (697 chars)
Opportunity is knocking with this income-producing duplex in a highly desirable location! Featuring brand new roof and windows, the heavy lifting has already been startedleaving room for you to bring your vision and add value. The property includes two units! Unit 1: 2 bedrooms, 1 full bath, Unit 2: 1 bedroom, 1 full bath. Currently tenant-occupied and generating income, this is a solid option for investors or savvy buyers looking to house hack. With a little TLC, this duplex has the potential to significantly increase its value and rental income. Whether you're looking to grow your portfolio or get started in real estate investing, this one checks the boxes, location, income, and upside!
-
2021-06-07soldstatus $55,000
-
2021-05-28soldstatus $55,000 Sold 223-char remark
Show marketing remark (223 chars)
Two unit being sold as is. Will need a cash or conventional buyer. Downstairs apartment has living room, dining room, kitchen and bath. Upstairs has living room, 2 bedrooms, kitchen and bath. $1000 gross monthly income.
-
2021-05-15historical Contingency Pending 223-char remark
Show marketing remark (223 chars)
Two unit being sold as is. Will need a cash or conventional buyer. Downstairs apartment has living room, dining room, kitchen and bath. Upstairs has living room, 2 bedrooms, kitchen and bath. $1000 gross monthly income.
-
2021-04-22$55,000 Active 223-char remark
Show marketing remark (223 chars)
Two unit being sold as is. Will need a cash or conventional buyer. Downstairs apartment has living room, dining room, kitchen and bath. Upstairs has living room, 2 bedrooms, kitchen and bath. $1000 gross monthly income.
-
2018-03-06soldstatus $1,990,500
ⓘ Source: listings_history table (triggers on properties + properties_extension) + one-shot
backfill from property_details.listing_events for pre-trigger history.
Tax reassessment forecast OH · Partial reset (capped growth)
- Current annual tax
- $1,148 · $96/mo
- Projected year-2 tax
- $1,509 · $126/mo
- Expected delta
- +$361/yr (+$30/mo · 31.5%)
ⓘ Screening estimate from a state-policy table — verify with the county assessor before closing.
Climate risk First Street
- Flood 1/10 Low FEMA zone X (unshaded) · 0% chance over 30 yrs
- Wildfire 1/10 Low
- Heat 3/10 Moderate 7 d/yr ≥99°F today · 19 d/yr by 30 yrs out
- Wind 2/10 Low 100% chance of damaging wind over 30 yrs
- Air quality 2/10 Low 1 unhealthy d/yr today · 2 by 30 yrs out
Nearby sold comps map
Loading sold comps map…
Walkable amenities ~0.75 mi
Loading nearby amenities…
Taxation est. · year 1
- Rental income
- $27,000
- − Mortgage interest
- −$6,716
- − Property taxes
- −$1,148
- − Insurance
- −$600
- − Repairs & maintenance
- −$2,160
- − Management
- −$2,160
- − Depreciation
- −$3,488
- Taxable income
- $10,728
- Est. tax owed @ 24.0%
- −$2,575
- After-tax cash flow
- $9,463/yr
For passive investors: Depreciation is non-cash, so a rental often shows a tax loss while cash-flowing — sheltering income. Rental losses are passive: they offset passive income freely, and up to $25,000/yr can offset ordinary (W-2) income if you actively participate and your MAGI is under $100k (phasing out to $0 by $150k); unused losses carry forward. On sale, claimed depreciation is recaptured at up to 25%, and gains may owe capital-gains tax (a 1031 exchange can defer both). Figures are a year-1 estimate at your 24.0% rate — not tax advice; consult a CPA.
Schools (NCES district)
- District
- Wilmington City
- NCES district ID
- 3904511
- Math proficiency
- 42% ▼ -16.00%
- Reading proficiency
- 51% ▼ -6.00%
- Median HH income
- $43,201
- Composite
- 39.2/100
- National rank
- #4020
- State rank
- #492 of 656 in OH
Livability — Wilmington
- Score
- 77/100
- State rank
- #202
- US rank
- #3127
Category grades
Schools grade is shown separately in the Schools card above.
Census & demographics
- Census place
- Wilmington, OH
- County
- Clinton · 46,911 people
- Population (ZIP)
- 22,442
- Household income
- $70,483
- Rent vs Own
- Severe rent burden
- 9.5
Population outlook (Clinton County) Hauer SSP2
- Today (2025)
- 41,352 people
- By 2030
- 40,831 · -1.3%
- By 2040
- 39,049 · -5.6%
- By 2050
- 36,408 · -12.0%
- By 2075
- 29,652 · -28.3%
- By 2100
- 20,736 · -49.9%
Race, ethnicity, and origin ACS 2023
- Neighborhood character
- Predominantly White (91%)
- Race & ethnicity
- White 91% Two or more races 3% Black 3% Hispanic / Latino 2% Asian 1%
- Common ancestry
- Lithuanian 2% Slovak 2% Romanian 2%
- Foreign-born
- 3% · Canada, Jamaica
- Languages at home
- 97% English-only · Spanish 1% Other Asian/Pacific 1%
Political lean MEDSL · Clinton
- 2024 margin
- Solid R (+54.6) · D 22.3% · R 76.9%
- 2008→2024 swing
- -24.3pp toward R · 2008: -30.3pp · 2024: -54.6pp
- All cycles
- 2024: R+54.6 2020: R+52.6 2016: R+52.6 2012: R+35.2 2008: R+30.3
Not yet ingested
- Civics
- —
Market trends
- HPI YoY
- ▼ -150.35%
- Current HPI
- 238.9182
- Rent YoY
- —
- Metro
- —
- State GDP YoY
- ▲ 1.98%
- F500 in state
- 48
Industry mix (Fortune 500 HQ in OH)
| Industry | F500 HQs | Revenue |
|---|---|---|
| Insurance | 3 | $145B |
|
||
| Industrial Machinery | 3 | $49B |
|
||
| Financial Services | 3 | $24B |
|
||
| Consumer Goods | 2 | $93B |
|
||
| Aerospace / Defense | 2 | $47B |
|
||
| Utilities | 2 | $33B |
|
||
Price history
-93.5% since first listed8 events — show timeline
- 2026-05-12 Price Changed $129,900 Cincy MLS
- 2026-04-27 Price Changed $139,900 Cincy MLS
- 2026-04-08 Listed $149,900 Cincy MLS
- 2021-06-07 Sold (Public Records) $55,000 Public Records
- 2021-05-28 Sold (MLS) $55,000 Cincy MLS
- 2021-05-15 Contingent — Cincy MLS
- 2021-04-22 Listed $55,000 Cincy MLS
- 2018-03-06 Sold (Public Records) $1,990,500 Public Records
Property tax history
+3.4%/yrLatest (2025): $1,148 · -3.4% YoY. Source: county tax records.
Cash-flow waterfall
monthlySold comps — $/sqft
last 12 mo · ≤1 miLoading sold comps…