1420 Atlantic Shores Blvd #237 · Hallandale Beach, FL
Flood risk No data
- FEMA flood zone
- —
- Chance of flooding over 30 yrs
- —
- Est. flood insurance / yr
- —
Fire risk No data
- Est. fire insurance / yr
- —
Heat risk No data
- Hot days now (above threshold)
- —
- Hot days in 30 yrs
- —
Wind risk No data
- Chance of severe wind over 30 yrs
- —
Air-quality risk No data
- Unhealthy air days now
- —
- Unhealthy air days in 30 yrs
- —
Risk factors via First Street. Map © Google.
Why this score? — see what drove the B grade
The composite is a weighted blend of 9 inputs, each scored 0–100. Each bar is that input's sub-score; the figure is the points it added to the 100-point composite (weight × sub-score).
- Cash flow +30.0/30.0
- 1% rule +10.0/10.0
- DSCR +10.0/10.0
- ARV discount +7.5/15.0
- Schools +4.1/10.0
- Livability +4.0/5.0
- Rent growth +2.6/5.0
- Condition / age +2.5/5.0
- Appreciation +0.0/10.0
$240,900
🖨 Deal sheet 📄 Offer letter ✓ Due diligence
Listing remarks MLS
Spacious 2 Bed/2 Baths Condo at Hallandale Beach. Fully Furnished. Minutes from the Beach and to Diplomat Golf Course. Great opportunity for investors. Cap rate 7.5% . Must see
Key facts
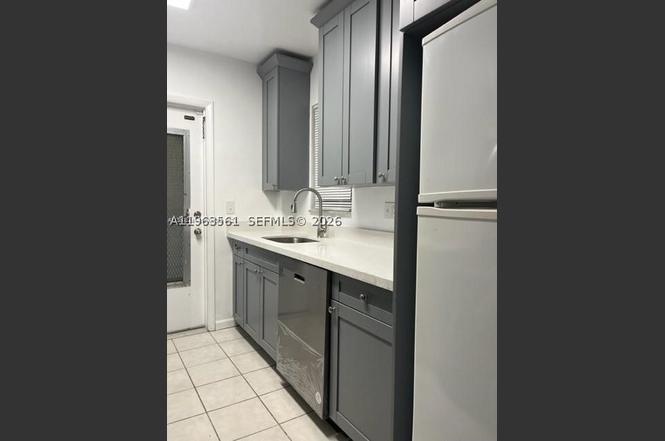
- Tile floors
- A/c
- Kitchen cabinets
Tags
Property features AI
Finance
- Financial info: Lease considered; Pets allowed with restrictions
- HOA & community: Monthly association fee of $453; Association covers common areas, laundry, grounds maintenance, structure maintenance, pest control, and water; Association amenities: Laundry and elevators
Exterior
- Parking: 1 covered garage space; Guest parking available; One additional parking space
- Utilities: Water service included in association; Cooling: Central air
- Home design: 3-story building; Entry on level 2
- Construction: Block construction; Resale property
- Exterior features: Property attached (multi-unit)
Interior
- Kitchen: Dishwasher; Electric range; Microwave; Refrigerator
- Flooring: Tile
- Bathrooms: 2 full bathrooms
- Heating & cooling: Central air conditioning
- Interior features: Second-floor entry; Elevator; Additional interior features
- Laundry & utility: Common area laundry
Neighborhood map
What this means for you Summary
Snapshot
- This is a 2-bed/2.0-bath condo listed at $241k.
Deal economics
- At list price, monthly cash flow is $1k ($17k/yr) — positive.
- The deal already cash-flows at list — no discount required.
- Meets the 1% rule at list price ($5k rent vs $241k).
- Recommended offer: $219k (9.0% below list) — sets the bar for market timing.
- Cap rate 13.3% vs local median 5.2% in Hallandale Beach — top-decile yield for the area; either an underpriced asset or a hidden risk that comps aren't pricing in. Stress-test before assuming the spread holds.
Location & tenants
- Location reads 81/100 on livability (#86 in FL, #1,400 nationally) — a professional / high-income tenant draw. Strengths: commute A+, health & safety A+, crime B+; Watch: schools C-, employment D-.
- Broward (suburban): math 42% / reading 53% proficiency, ranked #46 of 73 in FL (top 63%) — families likely to look elsewhere, expect single-tenant / working-renter base with shorter leases.
- Market conditions: Rents flat; 1373 active listings in the ZIP; 40 comparable units currently listed for rent nearby; rentals at typical pace (median 15d on market — plan ~3-4 weeks tenant-placement turnaround); 2,111 units permitted in Broward County in 2024 (1,265 in 5+ unit buildings).
- At $4,584/mo this rent would consume 106% of the median local household income ($52k/yr) (locally 3293% of renters already pay >50% of income on rent) — very limited rent-growth headroom before tenants either downsize or default.
Forward outlook
- Local home prices are declining (-3.0%/yr); year-one equity from $2k of loan paydown is wiped out by about $7k of value loss. Plan a longer hold.
- Broward County population projected at +34% by 2050 — long-run rental-demand tailwind backs the buy-and-hold thesis.
- At projected returns (-3.0% appreciation + 0.4% rent growth), your $67k cash investment doubles in ~6 years — after that, you're playing with house money.
Negotiation context
- It's been on market 120 days — a 9% lower offer ($219k) is reasonable based on typical stale-listing flexibility.
- 3 sale attempts since 9y ago with the ask held roughly flat each time — persistent listings suggest the price (not the market) is what's stuck; bring a comps-based counter.
Questions for the listing agent
- It's been on market 120 days. Have you received any prior offers? Is the seller open to a 9% concession, seller financing, or rate buy-down credit?
- Built in 1966 — when were the roof, HVAC, electrical panel, plumbing, and water heater last replaced?
- What does the HOA fee cover, when was the last increase, and are there any pending special assessments or reserve-fund shortfalls?
- Any open or pending special assessments — roof, HVAC, plumbing, elevator, façade? What's the per-unit balance and payoff schedule, and is the seller paying it off at close or rolling it to the buyer?
- Why hasn't it sold? Are there any deal-killer items the seller is aware of (foundation, flood, title, zoning, code violations)?
- Is there a deadline driving the sale (1031 exchange, divorce, estate, relocation)? That informs how much negotiation room exists.
- What's the average days-on-market for RENTAL listings here right now (not sales)? A rising rental-DOM trend means longer vacancies and softer asking-rent achievability than the comps imply.
- What's the recent tenant-quality profile in this submarket — average credit score on applications, eviction rate, late-payment / NSF rate, and stable-employment percentage? A property-management company in the area should have these aggregated.
- How much new apartment / multifamily construction is in the pipeline within 1–3 miles? Heavy new supply (>2% of stock underway) typically softens rents 12–24 months out; light construction supports rent growth.
Investment metrics
- 1% rule
- 1.90% ✓
- Cap rate
- 13.29%
- Cash-on-cash
- 25.00%
- DSCR
- 2.11
- GRM
- 4.4
CMA / ARV
No comps found within radius.
Projected returns pro-forma
-3.0% appreciation · 0.43% rent growth · sell at horizon
- IRR
- 15.1%
- Equity multiple
- 1.58×
- Total profit
- $39,309
- Equity at exit
- $35,919
- IRR
- 21.5%
- Equity multiple
- 2.57×
- Total profit
- $106,079
- Equity at exit
- $20,829
Cash invested: $67,452 (down + closing). Projections, not guarantees.
Landlord ↔ Tenant lean methodology
- Overall (STATE)
- 87 Strongly Landlord-Friendly
- State Florida
- 87 Strongly Landlord-Friendly · R+3
- County
- — inherits STATE
- City
- — inherits STATE
ZIP-level market 33009
- Rents YoY
- 0.4%
- Active inventory
- 1373
- Price-to-rent
- 4.4×
Monthly cashflow live
- Estimated rent
- $4,584 high interval (Pro) →
- Mortgage (P&I)
- −$1,263
- Tax from tax record
- −$400 /mo · $4,797/yr
- Insurance
- −$100
- HOA
- −$453
- Vacancy / Maint / Mgmt
- −$963
- Net cashflow
- $1,405
Break-even live
UW: 25.0% down · 7.5% · 30yr · 1.5% tax · 5.0% vac · 8.0% maint · 8.0% mgmt
Financing live
Cash to close
- Down payment
- $60,225
- Closing costs
- $7,227
- Reserves months
- —
- Total cash needed
- —
Loan-product check · same deal, 3 products live
Conventional
25% down · 7.5% · 30yr
- Down + closing
- —
- Monthly P&I
- —
- Monthly cashflow
- —
- DSCR
- —
- Eligible?
- —
Personal DTI + credit; lowest rate.
DSCR
20% down · 8.5% · 30yr
- Down + closing
- —
- Monthly P&I
- —
- Monthly cashflow
- —
- DSCR
- —
- Eligible?
- —
No personal income docs; deal must DSCR.
Hard money
10% down · 12.0% · 12mo
- Down + closing
- —
- Monthly P&I
- —
- Monthly cashflow
- —
- DSCR
- —
- Eligible?
- —
Short-term bridge; refi at stabilization.
Rent comps 40 comps
| Address | Beds | Baths | Sqft | Rent | $/sqft | DOM | Units | Dist |
|---|---|---|---|---|---|---|---|---|
| 906 NE 6th St Hallandale Beach, FL | 3.0 | 2.0 | 1080 | $4,250 | $3.94 | 12d | 1 | 0.38mi |
| 906 NE 6th St Hallandale Beach, FL | 3.0 | 2.0 | 1080 | $4,250 | $3.94 | 24d | 1 | 0.38mi |
| 906 NE 6th St Hallandale Beach, FL | 3.0 | 2.0 | 1080 | $4,250 | $3.94 | 5d | 1 | 0.38mi |
| 101 Diplomat Pkwy Hallandale Beach, FL | 1.0 | 1.0 | 859 | $3,740 | $4.35 | 24d | 1 | 0.63mi |
| 401 N Federal Hwy Hallandale Beach, FL | 1.0–3.0 | 1.0–2.0 | 973 | $2,765 | $2.84 | 15d | 48 | 0.68mi |
| 1180 E Hallandale Beach Blvd Unit 1241877P Hallandale Beach, FL | 1.0–2.0 | 1.0–2.0 | 844 | $5,453 | $6.46 | 4d | 2 | 0.75mi |
| 200 E Pembroke Rd Hallandale Beach, FL | 3.0 | 1.0–2.0 | 1006 | $3,480 | $3.46 | 2d | 62 | 0.81mi |
| 2601 E Hallandale Beach Blvd Unit 1227344P Hallandale Beach, FL | 1.0–2.0 | 1.0–2.0 | 844 | $4,219 | $5.00 | 2d | 2 | 0.92mi |
| 2602 E Hallandale Beach Blvd Hallandale Beach, FL | 3.0 | 1.0–3.0 | 1011 | $5,495 | $5.44 | 2d | 5 | 0.93mi |
| 2602 E Hallandale Beach Blvd Hallandale Beach, FL | 1.0–2.0 | 1.0–2.0 | 1070 | $5,950 | $5.56 | 21d | 4 | 0.93mi |
| 2602 E Hallandale Beach Blvd Hallandale Beach, FL | 1.0–2.0 | 1.0–2.0 | 1092 | $5,950 | $5.45 | 24d | 3 | 0.93mi |
| 2600 E Hallandale Beach Blvd Unit T3307 Hallandale Beach, FL | 2.0 | 2.0 | 1030 | $4,500 | $4.37 | 24d | 1 | 0.94mi |
| 2600 E Hallandale Beach Blvd Unit T3208 Hallandale Beach, FL | 2.0 | 2.0 | 1030 | $6,950 | $6.75 | 24d | 1 | 0.94mi |
| 2600 E Hallandale Beach Blvd Unit T3110 Hallandale Beach, FL | 2.0 | 2.0 | 1028 | $3,650 | $3.55 | 24d | 1 | 0.94mi |
| 4010 S Ocean Dr Hollywood, FL | 1.0–3.0 | 1.0–3.5 | 1078 | $7,250 | $6.73 | 24d | 5 | 0.98mi |
| 2721 E Hallandale Beach Blvd Unit 1049818P Hollywood, FL | 1.0–2.0 | 1.0–2.0 | 946 | $5,897 | $6.23 | 4d | 2 | 1.01mi |
| 3505 S Ocean Dr Hollywood, FL | 1.0–2.0 | 1.5–2.0 | 1085 | $6,500 | $5.99 | 13d | 17 | 1.01mi |
| 3505 S Ocean Dr Hollywood, FL | 1.0–2.0 | 1.5–2.0 | 1085 | $6,500 | $5.99 | 10d | 18 | 1.01mi |
| 4010 S Ocean Dr Unit T3509 Hollywood, FL | 2.0 | 2.0 | 1060 | $6,000 | $5.66 | 22d | 1 | 1.01mi |
| 4010 S Ocean Dr Unit T3609 Hollywood, FL | 2.0 | 2.0 | 1060 | $6,300 | $5.94 | 24d | 1 | 1.01mi |
| 4010 S Ocean Dr Unit 1388506P Hollywood, FL | 2.0 | 2.0 | 1097 | $4,881 | $4.45 | 8d | 1 | 1.01mi |
| 4010 S Ocean Dr Unit R2102 Hollywood, FL | 2.0 | 2.0 | 1075 | $6,500 | $6.05 | 24d | 1 | 1.01mi |
| 4010 S Ocean Dr Unit R504 Hollywood, FL | 3.0 | 2.0 | 1122 | $10,000 | $8.91 | 8d | 1 | 1.01mi |
| 4010 S Ocean Dr Unit 1227485P Hollywood, FL | 2.0–3.0 | 2.0 | 1118 | $5,049 | $4.51 | 15d | 2 | 1.01mi |
| 4010 S Ocean Dr Unit T3609 Hollywood, FL | 2.0 | 2.0 | 1060 | $6,300 | $5.94 | 3d | 1 | 1.01mi |
| 4010 S Ocean Dr Unit R504 Hollywood, FL | 3.0 | 2.0 | 1122 | $10,000 | $8.91 | 24d | 1 | 1.01mi |
| 3505 S Ocean Dr Unit 1049820P Hollywood, FL | 1.0 | 1.0 | 785 | $4,827 | $6.15 | 3d | 1 | 1.02mi |
| 2501 S Ocean Dr Hollywood, FL | 1.0–2.0 | 1.0–2.0 | 971 | $5,800 | $5.97 | 14d | 7 | 1.04mi |
| 2501 S Ocean Dr Hollywood, FL | 1.0–2.0 | 1.0–2.0 | 971 | $5,800 | $5.97 | 19d | 8 | 1.04mi |
| 2501 S Ocean Dr Hollywood, FL | 1.0–2.0 | 1.0–2.0 | 971 | $5,800 | $5.97 | 11d | 6 | 1.04mi |
| 2501 S Ocean Dr Hollywood, FL | 1.0–2.0 | 1.0–2.0 | 971 | $5,400 | $5.56 | 8d | 7 | 1.04mi |
| 3725 S Ocean Dr Hollywood, FL | 2.0–3.0 | 2.0 | 1377 | $4,000 | $2.90 | 14d | 8 | 1.05mi |
| 3725 S Ocean Dr Hollywood, FL | 2.0–3.0 | 2.0 | 1377 | $4,000 | $2.90 | 3d | 7 | 1.05mi |
| 3801 S Ocean Dr Unit 4R Hollywood, FL | 1.0 | 1.0 | 812 | $3,850 | $4.74 | 24d | 1 | 1.07mi |
| 3901 S Ocean Dr Unit 10M Hollywood, FL | 1.0 | 1.0 | 874 | $5,000 | $5.72 | 24d | 1 | 1.08mi |
| 3901 S Ocean Dr Unit 11M Hollywood, FL | 1.0 | 1.0 | 874 | $4,400 | $5.03 | 24d | 1 | 1.08mi |
| 3901 S Ocean Dr Unit 11M Hollywood, FL | 1.0 | 1.0 | 874 | $4,400 | $5.03 | 4d | 1 | 1.08mi |
| 3901 S Ocean Dr Unit 10Z Hollywood, FL | 1.0 | 1.0 | 874 | $4,000 | $4.58 | 4d | 1 | 1.08mi |
| 3901 S Ocean Dr Unit 10Z Hollywood, FL | 1.0 | 1.0 | 874 | $4,000 | $4.58 | 24d | 1 | 1.08mi |
| 3901 S Ocean Dr Unit 1227197P Hollywood, FL | 1.0–2.0 | 1.0–2.0 | 1054 | $3,820 | $3.62 | 2d | 2 | 1.08mi |
HOA detail condo
- Monthly dues
- $453 · $5,436/yr
- Assessments
- None detected in remarks — confirm with the listing agent.
Listing history 26 events
-
2026-06-18days on market $240,900 Active 120 DOM
-
2026-06-17days on market $240,900 Active 119 DOM
-
2026-06-16days on market $240,900 Active 118 DOM
-
2026-06-15days on market $240,900 Active 117 DOM
-
2026-06-13days on market $240,900 Active 115 DOM
-
2026-06-09days on market $240,900 Active 111 DOM
-
2026-06-07days on market $240,900 Active 109 DOM
-
2026-06-04days on market $240,900 Active 106 DOM
-
2026-06-03days on market $240,900 Active 105 DOM
-
2026-06-02days on market $240,900 Active 104 DOM
-
2026-06-01days on market $240,900 Active 103 DOM
-
2026-05-31days on market $240,900 Active 102 DOM
-
2026-02-11$240,900 Active
-
2024-11-15soldstatus $260,000
-
2024-11-08historical
-
2024-10-24price $270,000
-
2024-10-24$27,000 Active
-
2023-07-21historical
-
2017-08-15soldstatus $145,000
-
2017-08-11soldstatus $145,000 Sold 177-char remark
Show marketing remark (177 chars)
Spacious 2 Bed/2 Baths Condo at Hallandale Beach. Fully Furnished. Minutes from the Beach and to Diplomat Golf Course. Great opportunity for investors. Cap rate 7.5% . Must see
-
2017-07-11status Backup Contract 177-char remark
Show marketing remark (177 chars)
Spacious 2 Bed/2 Baths Condo at Hallandale Beach. Fully Furnished. Minutes from the Beach and to Diplomat Golf Course. Great opportunity for investors. Cap rate 7.5% . Must see
-
2017-06-25price $154,900 177-char remark
Show marketing remark (177 chars)
Spacious 2 Bed/2 Baths Condo at Hallandale Beach. Fully Furnished. Minutes from the Beach and to Diplomat Golf Course. Great opportunity for investors. Cap rate 7.5% . Must see
-
2017-04-27$159,900 Active 177-char remark
Show marketing remark (177 chars)
Spacious 2 Bed/2 Baths Condo at Hallandale Beach. Fully Furnished. Minutes from the Beach and to Diplomat Golf Course. Great opportunity for investors. Cap rate 7.5% . Must see
-
2012-03-30soldstatus $90,000
-
2012-03-30soldstatus $90,000
-
1992-04-23soldstatus $43,500
ⓘ Source: listings_history table (triggers on properties + properties_extension) + one-shot
backfill from property_details.listing_events for pre-trigger history.
Tax reassessment forecast FL · Resets to sale price
- Current annual tax
- $4,797 · $400/mo
- Projected year-2 tax
- $4,797 · $400/mo
- Expected delta
- $0/yr ($0/mo · 0.0%)
ⓘ Screening estimate from a state-policy table — verify with the county assessor before closing.
Nearby sold comps map
Loading sold comps map…
Walkable amenities ~0.75 mi
Loading nearby amenities…
Taxation est. · year 1
- Rental income
- $55,011
- − Mortgage interest
- −$13,494
- − Property taxes
- −$4,797
- − Insurance
- −$1,204
- − Repairs & maintenance
- −$4,401
- − Management
- −$4,401
- − HOA
- −$5,436
- − Depreciation
- −$7,008
- Taxable income
- $14,270
- Est. tax owed @ 24.0%
- −$3,425
- After-tax cash flow
- $13,437/yr
For passive investors: Depreciation is non-cash, so a rental often shows a tax loss while cash-flowing — sheltering income. Rental losses are passive: they offset passive income freely, and up to $25,000/yr can offset ordinary (W-2) income if you actively participate and your MAGI is under $100k (phasing out to $0 by $150k); unused losses carry forward. On sale, claimed depreciation is recaptured at up to 25%, and gains may owe capital-gains tax (a 1031 exchange can defer both). Figures are a year-1 estimate at your 24.0% rate — not tax advice; consult a CPA.
Schools (NCES district)
- District
- Broward
- NCES district ID
- 1200180
- Math proficiency
- 42% ▼ -18.00%
- Reading proficiency
- 53% ▼ -5.00%
- Median HH income
- $52,139
- Composite
- 40.88/100
- National rank
- #3621
- State rank
- #46 of 73 in FL
Livability — Hallandale Beach
- Score
- 81/100
- State rank
- #86
- US rank
- #1400
Category grades
Schools grade is shown separately in the Schools card above.
Census & demographics
- Census place
- Hallandale Beach, FL
- County
- Broward County · 1,963,430 people
- City population
- 44,021
- Metro
- Miami-Fort Lauderdale-Pompano Beach, FL
- Population (ZIP)
- 44,502
- Household income
- $52,079
- Rent vs Own
- Severe rent burden
- 3293.0
Population outlook (Broward County) Hauer SSP2
- Today (2025)
- 2,207,033 people
- By 2030
- 2,360,704 · +7.0%
- By 2040
- 2,661,208 · +20.6%
- By 2050
- 2,946,698 · +33.5%
- By 2075
- 3,602,273 · +63.2%
- By 2100
- 3,970,984 · +79.9%
Race, ethnicity, and origin ACS 2023
- Neighborhood character
- Diverse neighborhood (Simpson 0.67)
- Race & ethnicity
- Hispanic / Latino 39% White 39% Two or more races 24% Black 17% Asian 1%
- Hispanic origin (detail)
- Mexican 2% Puerto Rican 3% Cuban 9% Dominican 3% Salvadoran 2%
- Common ancestry
- Scotch-Irish 5% Hispanic 5% Subsaharan African 3%
- Foreign-born
- 51% · Canada, Jamaica, Dominican Republic
- Languages at home
- 38% English-only · Spanish 36% Russian/Polish/Slavic 12% French/Haitian/Cajun 7%
Political lean MEDSL · Broward
- 2024 margin
- D (+17.0) · D 58.0% · R 41.0%
- 2008→2024 swing
- -17.8pp toward R · 2008: 34.7pp · 2024: 17.0pp
- All cycles
- 2024: D+17.0 2020: D+29.8 2016: D+35.0 2012: D+34.9 2008: D+34.7
Not yet ingested
- Civics
- —
Market trends
- HPI YoY
- ▼ -299.13%
- Current HPI
- 329.9081
- Rent YoY
- ▲ 0.43%
- Metro
- Miami-Fort Lauderdale-Pompano Beach, FL
- State GDP YoY
- ▲ 3.28%
- F500 in state
- 36
Industry mix (Fortune 500 HQ in FL)
| Industry | F500 HQs | Revenue |
|---|---|---|
| Industrial Technology | 2 | $29B |
|
||
| Insurance | 2 | $17B |
|
||
| Retail | 1 | $60B |
|
||
| Technology Distribution | 1 | $58B |
|
||
| Homebuilding | 1 | $35B |
|
||
| Technology Manufacturing | 1 | $35B |
|
||
Price history
+453.8% since first listed14 events — show timeline
- 2026-02-11 Listed $240,900 MARMLS
- 2024-11-15 Sold (Public Records) $260,000 Public Records
- 2024-11-08 Listing Removed — MARMLS
- 2024-10-24 Price Changed $270,000 MARMLS
- 2024-10-24 Listed $27,000 MARMLS
- 2023-07-21 Rental Removed — MARMLS
- 2017-08-15 Sold (Public Records) $145,000 Public Records
- 2017-08-11 Sold (MLS) $145,000 MARMLS
- 2017-07-11 Pending — MARMLS
- 2017-06-25 Price Changed $154,900 MARMLS
- 2017-04-27 Listed $159,900 MARMLS
- 2012-03-30 Sold (Public Records) $90,000 Public Records
- 2012-03-30 Sold (MLS) $90,000 MARMLS
- 1992-04-23 Sold (Public Records) $43,500 Public Records
Property tax history
+9.0%/yrLatest (2025): $4,797 · +11.0% YoY. Source: county tax records.
Cash-flow waterfall
monthlySold comps — $/sqft
last 12 mo · ≤1 miLoading sold comps…