 Triplex
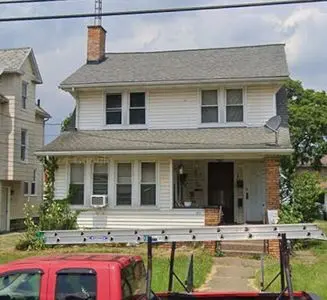
1217 18th St NW · Canton, OH
Flood risk 1/10 · Minimal
- FEMA flood zone
- X (unshaded)
- Chance of flooding over 30 yrs
- 0.0%
- Est. flood insurance / yr
- $473 – $860
Fire risk 1/10 · Minimal
- Est. fire insurance / yr
- $713 – $1,323
Heat risk 3/10 · Minor
- Hot days now (above 96°F)
- 7 days/yr
- Hot days in 30 yrs
- 17 days/yr
Wind risk 1/10 · Minimal
- Chance of severe wind over 30 yrs
- —
Air-quality risk 2/10 · Minimal
- Unhealthy air days now
- 0 days/yr
- Unhealthy air days in 30 yrs
- 1 days/yr
Risk factors via First Street. Map © Google.
Why this score? — see what drove the C+ grade
The composite is a weighted blend of 9 inputs, each scored 0–100. Each bar is that input's sub-score; the figure is the points it added to the 100-point composite (weight × sub-score).
- Cash flow +30.0/30.0
- 1% rule +10.0/10.0
- DSCR +10.0/10.0
- Rent growth +3.7/5.0
- Livability +3.6/5.0
- ARV discount +2.9/15.0
- Condition / age +2.5/5.0
- Schools +1.7/10.0
- Appreciation +0.0/10.0
$121,000
🖨 Deal sheet 📄 Offer letter ✓ Due diligence
Multi-family units
County records classify this as Multi-Family (2-4 Unit). Listing-text estimate: 3 units. confirmed
Listing remarks
Triplex, 3- 1 bedroom units Unit #1, has dining room, sunroom, partial basement with laundry hookups and 1 car garage Unit #2, second floor, has access to attic for storage Unit #3, in lower level, has laundry hookups longterm tenants, unit#1, 20 years, unit#2 7 years, unit #3 1year, relative of unit 1 landlord pays all utilities, for 2025 Electric, gass, Water/trash average $500 per month. total rents currently $1900, rents below local avergae
Key facts
- Partial basement
- Sunroom
- Dining room
Tags
Neighborhood map
What this means for you Summary
Snapshot
- This is a 3 × 1-bed/1.0-bath units multifamily listed at $121k.
Deal economics
- At list price, monthly cash flow is $933 ($11k/yr) — positive. Per door: $311/mo.
- The deal already cash-flows at list — no discount required.
- Meets the 1% rule at list price ($2k rent vs $121k).
- Recommended offer: $119k (1.5% below list) — sets the bar for market timing.
- Cap rate 15.5% vs local median 5.1% in Canton — top-decile yield for the area; either an underpriced asset or a hidden risk that comps aren't pricing in. Stress-test before assuming the spread holds.
Location & tenants
- Location reads 71/100 on livability (#441 in OH) — a middle-class / working-renter tenant base. Strengths: commute A+, cost of living A+, housing A; Watch: crime F, employment F.
- Canton City (urban): math 17% / reading 26% proficiency, ranked #627 of 656 in OH (top 96%) — low school quality limits family demand, transient renter base, plan for 1-2y turnover; 76% free/reduced lunch — lower-income household profile, screen leases tightly.
- Market conditions: Rents rising fast (+4.6%/yr); 30 active listings in the ZIP; 5 comparable units currently listed for rent nearby; rentals at typical pace (median 21d on market — plan ~3-4 weeks tenant-placement turnaround); 40% of comp listings sitting > 30 days — soft ceiling on asking rent; lower-income renter base — watch delinquency; 528 units permitted in Stark County in 2024 (84 in 5+ unit buildings).
- At $2,190/mo this rent would consume 82% of the median local household income ($32k/yr) (locally 644% of renters already pay >50% of income on rent) — very limited rent-growth headroom before tenants either downsize or default.
Forward outlook
- Local home prices are declining (-3.0%/yr); year-one equity from $837 of loan paydown is wiped out by about $4k of value loss. Plan a longer hold.
- Stark County population projected to shrink 8% by 2050 — rents likely to lag national; underwrite the cash flow, not the appreciation.
- At projected returns (-3.0% appreciation + 4.6% rent growth), your $34k cash investment doubles in ~4 years — after that, you're playing with house money.
Negotiation context
- It's been on market 22 days — a 2% lower offer ($119k) is reasonable based on typical stale-listing flexibility.
- 5 sale attempts since 33y ago with the ask held roughly flat each time — persistent listings suggest the price (not the market) is what's stuck; bring a comps-based counter.
- Current owner paid $53k; list at $121k implies a 127% gain — meaningful room to come down on a strong offer.
Questions for the listing agent
- Can we see the unit-by-unit rent roll, current vacancy, and any below-market leases? What's the average tenancy length?
- What capital expenditures (roof, boiler, parking lot, exteriors) have been made in the last 5 years, and what's planned in the next 2?
- Built in 1960 — when were the roof, HVAC, electrical panel, plumbing, and water heater last replaced?
- Is there a deadline driving the sale (1031 exchange, divorce, estate, relocation)? That informs how much negotiation room exists.
- Crime grade is F in this area — have there been break-ins, vandalism, or insurance claims at this property in the last 3 years? What carrier currently insures it and at what premium?
- What's the average days-on-market for RENTAL listings here right now (not sales)? A rising rental-DOM trend means longer vacancies and softer asking-rent achievability than the comps imply.
- What's the recent tenant-quality profile in this submarket — average credit score on applications, eviction rate, late-payment / NSF rate, and stable-employment percentage? A property-management company in the area should have these aggregated.
- How much new apartment / multifamily construction is in the pipeline within 1–3 miles? Heavy new supply (>2% of stock underway) typically softens rents 12–24 months out; light construction supports rent growth.
Investment metrics
- 1% rule
- 1.81% ✓
- Cap rate
- 15.55%
- Cash-on-cash
- 33.05%
- DSCR
- 2.47
- GRM
- 4.6
CMA / ARV
- ARV (on-the-fly)
- $109,728
- Comps found
- 9
Show comp detail 9 sales within ~0.75 mi
| Address | Dist | Beds/Ba | Sqft | Sold | Price | $/sf | Match |
|---|---|---|---|---|---|---|---|
| 1105 19th St NW | 0.09mi | 2/2.0 (-1) | 1,962 (-3%) | 6mo | $160,500 | $82 | 76 |
| 1248 18th St NW | 0.07mi | 3/2.0 | 1,872 (-8%) | 17mo | $105,000 | $56 | 66 |
| 2112 Iris Ct NW | 0.34mi | 4/2.0 (+1) | 2,208 (+9%) | 1mo | $120,000 | $54 | 60 |
| 1814 Woodland Ave NW | 0.28mi | 4/2.0 (+1) | 2,232 (+10%) | 9mo | $150,000 | $67 | 54 |
| 1117-1119 18th St NW | 0.09mi | 4/2.0 (+1) | 1,768 (-13%) | 20mo | $131,000 | $74 | 48 |
| 1324-1326 Shorb Ave NW | 0.48mi | 2/2.0 (-1) | 1,872 (-8%) | 11mo | $43,000 | $23 | 46 |
| 949 Fulton Rd NW | 0.73mi | 3/3.0 | 1,868 (-8%) | 12mo | $95,000 | $51 | 42 |
| 1301 Fulton Rd NW | 0.48mi | 3/1.5 | 1,828 (-10%) | 21mo | $42,550 | $23 | 38 |
| 907 14th St NW | 0.41mi | 4/2.0 (+1) | 1,740 (-14%) | 19mo | $51,000 | $29 | 32 |
Match score weights: distance 35% · size 25% · config 20% · recency 20%. Top-matched comps best support the ARV.
Projected returns pro-forma
-3.0% appreciation · 4.61% rent growth · sell at horizon
- IRR
- 30.0%
- Equity multiple
- 2.28×
- Total profit
- $43,443
- Equity at exit
- $18,041
- IRR
- 38.2%
- Equity multiple
- 4.83×
- Total profit
- $129,685
- Equity at exit
- $10,462
Cash invested: $33,880 (down + closing). Projections, not guarantees.
Landlord ↔ Tenant lean methodology
- Overall (STATE)
- 73 Landlord-Friendly
- State Ohio
- 73 Landlord-Friendly · R+6
- County
- — inherits STATE
- City
- — inherits STATE
ZIP-level market 44703
- Home prices YoY
- -20.5%
- Rents YoY
- 4.6%
- Active inventory
- 30
- Price-to-rent
- 13.8×
Monthly cashflow live
- Estimated rent
- $2,190 high interval (Pro) →
- Mortgage (P&I)
- −$635
- Tax from tax record
- −$112 /mo · $1,343/yr
- Insurance
- −$50
- HOA
- −$0
- Vacancy / Maint / Mgmt
- −$460
- Net cashflow
- $933
Break-even live
3-unit breakdown (identical units grouped — click to expand)
| Units | Beds | Baths | Est. rent |
|---|---|---|---|
| 3× units | 1 | 1 | $2,190 |
| #1 | 1 | 1 | $730 |
| #2 | 1 | 1 | $730 |
| #3 | 1 | 1 | $730 |
| Total (3 units) | $2,190 | ||
UW: 25.0% down · 7.5% · 30yr · 1.5% tax · 5.0% vac · 8.0% maint · 8.0% mgmt
Financing live
Cash to close
- Down payment
- $30,250
- Closing costs
- $3,630
- Reserves months
- —
- Total cash needed
- —
Loan-product check · same deal, 3 products live
Conventional
25% down · 7.5% · 30yr
- Down + closing
- —
- Monthly P&I
- —
- Monthly cashflow
- —
- DSCR
- —
- Eligible?
- —
Personal DTI + credit; lowest rate.
DSCR
20% down · 8.5% · 30yr
- Down + closing
- —
- Monthly P&I
- —
- Monthly cashflow
- —
- DSCR
- —
- Eligible?
- —
No personal income docs; deal must DSCR.
Hard money
10% down · 12.0% · 12mo
- Down + closing
- —
- Monthly P&I
- —
- Monthly cashflow
- —
- DSCR
- —
- Eligible?
- —
Short-term bridge; refi at stabilization.
Rent comps 5 comps
| Address | Beds | Baths | Sqft | Rent | $/sqft | DOM | Units | Dist |
|---|---|---|---|---|---|---|---|---|
| 1220 Market Ave N Unit 4 Canton, OH | 3.0 | 1.0 | 1400 | $1,100 | $0.79 | 43d | 1 | 0.87mi |
| 1137 7th St NW Canton, OH | 3.0 | 1.0 | 1736 | $1,095 | $0.63 | 43d | 1 | 0.93mi |
| 2510 10th St NW Canton, OH | 3.0 | 1.5 | 1468 | $1,175 | $0.80 | 20d | 1 | 1.19mi |
| 924 Spring Ave NE Canton, OH | 4.0 | 1.5 | 1407 | $1,395 | $0.99 | 20d | 1 | 1.29mi |
| 3034 12th St NW Canton, OH | 2.0 | 1.0 | 1724 | $1,125 | $0.65 | 20d | 1 | 1.39mi |
Listing history 29 events
-
2026-06-18days on market $121,000 Active 22 DOM
-
2026-06-17days on market $121,000 Active 21 DOM
-
2026-06-16days on market $121,000 Active 20 DOM
-
2026-06-15days on market $121,000 Active 19 DOM
-
2026-06-14days on market $121,000 Active 17 DOM
-
2026-06-13days on market $121,000 Active 16 DOM
-
2026-06-10days on market $121,000 Active 14 DOM
-
2026-06-09days on market $121,000 Active 13 DOM
-
2026-06-08days on market $121,000 Active 12 DOM
-
2026-06-07days on market $121,000 Active 11 DOM
-
2026-06-05days on market $121,000 Active 8 DOM
-
2026-06-03days on market $121,000 Active 7 DOM
-
2026-06-02days on market $121,000 Active 6 DOM
-
2026-06-01days on market $121,000 Active 5 DOM
-
2026-05-31days on market $121,000 Active 4 DOM
-
2026-05-30days on market $121,000 Active 3 DOM
-
2026-05-28$121,000 Active
-
2010-03-19soldstatus $53,200
-
2008-10-16historical
-
2008-07-16$64,900
-
2006-07-31historical
-
2006-02-15$79,850
-
2006-02-13historical
-
2005-11-14$82,000
-
1994-08-30soldstatus $58,000
-
1994-07-01historical
-
1993-10-21$64,900
-
1991-12-03soldstatus $53,000
-
1990-06-08soldstatus $51,000
ⓘ Source: listings_history table (triggers on properties + properties_extension) + one-shot
backfill from property_details.listing_events for pre-trigger history.
Tax reassessment forecast OH · Partial reset (capped growth)
- Current annual tax
- $1,343 · $112/mo
- Projected year-2 tax
- $1,615 · $135/mo
- Expected delta
- +$272/yr (+$23/mo · 20.3%)
ⓘ Screening estimate from a state-policy table — verify with the county assessor before closing.
Climate risk First Street
- Flood 1/10 Low FEMA zone X (unshaded) · 0% chance over 30 yrs
- Wildfire 1/10 Low
- Heat 3/10 Moderate 7 d/yr ≥96°F today · 17 d/yr by 30 yrs out
- Wind 1/10 Low
- Air quality 2/10 Low 0 unhealthy d/yr today · 1 by 30 yrs out
Nearby sold comps map
Loading sold comps map…
Walkable amenities ~0.75 mi
Loading nearby amenities…
Taxation est. · year 1
- Rental income
- $26,280
- − Mortgage interest
- −$6,778
- − Property taxes
- −$1,343
- − Insurance
- −$605
- − Repairs & maintenance
- −$2,102
- − Management
- −$2,102
- − Depreciation
- −$3,520
- Taxable income
- $9,829
- Est. tax owed @ 24.0%
- −$2,359
- After-tax cash flow
- $8,840/yr
For passive investors: Depreciation is non-cash, so a rental often shows a tax loss while cash-flowing — sheltering income. Rental losses are passive: they offset passive income freely, and up to $25,000/yr can offset ordinary (W-2) income if you actively participate and your MAGI is under $100k (phasing out to $0 by $150k); unused losses carry forward. On sale, claimed depreciation is recaptured at up to 25%, and gains may owe capital-gains tax (a 1031 exchange can defer both). Figures are a year-1 estimate at your 24.0% rate — not tax advice; consult a CPA.
Schools (NCES district)
- District
- Canton City
- NCES district ID
- 3904371
- Math proficiency
- 17% ▼ -17.00%
- Reading proficiency
- 26% ▼ -12.00%
- Median HH income
- $28,825
- Composite
- 17.1/100
- National rank
- #9116
- State rank
- #627 of 656 in OH
Livability — Canton
- Score
- 71/100
- State rank
- #441
- US rank
- #7259
Category grades
Schools grade is shown separately in the Schools card above.
Census & demographics
- Census place
- Canton, OH
- County
- Stark County · 272,865 people
- City population
- 103,614
- Metro
- Canton-Massillon, OH
- Population (ZIP)
- 8,070
- Household income
- $31,957
- Rent vs Own
- Severe rent burden
- 644.0
Population outlook (Stark County) Hauer SSP2
- Today (2025)
- 373,708 people
- By 2030
- 371,245 · -0.7%
- By 2040
- 361,331 · -3.3%
- By 2050
- 345,290 · -7.6%
- By 2075
- 302,669 · -19.0%
- By 2100
- 238,870 · -36.1%
Race, ethnicity, and origin ACS 2023
- Neighborhood character
- Diverse neighborhood (Simpson 0.62)
- Race & ethnicity
- White 58% Two or more races 19% Black 19% Hispanic / Latino 8% Pacific Islander 1%
- Hispanic origin (detail)
- Mexican 1% Puerto Rican 1% Cuban 3%
- Common ancestry
- Italian 15% Romanian 2% Lithuanian 2%
- Foreign-born
- 2% · Canada
Political lean MEDSL · Stark
- 2024 margin
- Strong R (+21.9) · D 38.6% · R 60.5%
- 2008→2024 swing
- -27.4pp toward R · 2008: 5.5pp · 2024: -21.9pp
- All cycles
- 2024: R+21.9 2020: R+18.5 2016: R+17.4 2012: R+0.4 2008: D+5.5
Not yet ingested
- Civics
- —
Market trends
- HPI YoY
- ▼ -56.64%
- Current HPI
- 220.0551
- Rent YoY
- ▲ 4.61%
- Metro
- Canton-Massillon, OH
- State GDP YoY
- ▲ 1.98%
- F500 in state
- 48
Industry mix (Fortune 500 HQ in OH)
| Industry | F500 HQs | Revenue |
|---|---|---|
| Insurance | 3 | $145B |
|
||
| Industrial Machinery | 3 | $49B |
|
||
| Financial Services | 3 | $24B |
|
||
| Consumer Goods | 2 | $93B |
|
||
| Aerospace / Defense | 2 | $47B |
|
||
| Utilities | 2 | $33B |
|
||
Price history
+137.3% since first listed13 events — show timeline
- 2026-05-28 Listed $121,000 FSBO.com
- 2010-03-19 Sold (Public Records) $53,200 Public Records
- 2008-10-16 Listing Removed — MLSNOW
- 2008-07-16 Listed $64,900 MLSNOW
- 2006-07-31 Listing Removed — MLSNOW
- 2006-02-15 Listed $79,850 MLSNOW
- 2006-02-13 Listing Removed — MLSNOW
- 2005-11-14 Listed $82,000 MLSNOW
- 1994-08-30 Sold (Public Records) $58,000 Public Records
- 1994-07-01 Listing Removed — MLSNOW
- 1993-10-21 Listed $64,900 MLSNOW
- 1991-12-03 Sold (Public Records) $53,000 Public Records
- 1990-06-08 Sold (Public Records) $51,000 Public Records
Property tax history
+7.4%/yrLatest (2024): $1,343 · +24.5% YoY. Source: county tax records.
Cash-flow waterfall
monthlySold comps — $/sqft
last 12 mo · ≤1 miLoading sold comps…