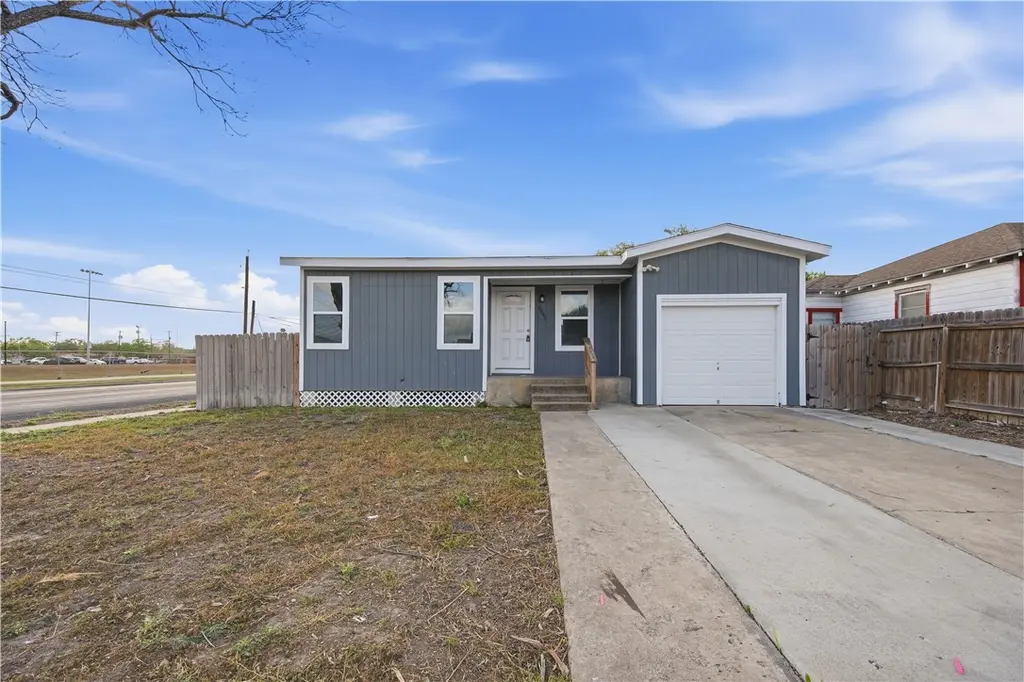
4845 Johnston Dr · Corpus Christi, TX
Flood risk 5/10 · Moderate
- FEMA flood zone
- X (unshaded)
- Chance of flooding over 30 yrs
- 0.65%
- Est. flood insurance / yr
- $507 – $1,088
Fire risk 1/10 · Minimal
- Est. fire insurance / yr
- $1,222 – $2,270
Heat risk 10/10 · Severe
- Hot days now (above 107°F)
- 7 days/yr
- Hot days in 30 yrs
- 26 days/yr
Wind risk 9/10 · Severe
- Chance of severe wind over 30 yrs
- 99.0%
Air-quality risk 1/10 · Minimal
- Unhealthy air days now
- 0 days/yr
- Unhealthy air days in 30 yrs
- 0 days/yr
Risk factors via First Street. Map © Google.
Why this score? — see what drove the D grade
The composite is a weighted blend of 9 inputs, each scored 0–100. Each bar is that input's sub-score; the figure is the points it added to the 100-point composite (weight × sub-score).
- Cash flow +20.4/30.0
- DSCR +6.5/10.0
- 1% rule +4.7/10.0
- Livability +3.9/5.0
- Rent growth +3.1/5.0
- Schools +2.8/10.0
- Condition / age +2.5/5.0
- ARV discount +0.0/15.0
- Appreciation +0.0/10.0
$210,000
🖨 Deal sheet (PDF) 📄 Offer letter ✓ Due diligence
Listing remarks MLS
Welcome to 4845 Johnston Dr a versatile property offering space, flexibility, and value all in one! The main home features 3 bedrooms and 2 full bathrooms with thoughtful updates throughout, including granite countertops, upgraded fixtures, laminate flooring, and vinyl windows. The primary bathroom showcases a double vanity and a tiled tub/shower combo, giving it a clean, modern feel. Fresh interior and exterior paint, along with durable hardie board siding, add to the home’s move-in ready appeal. What truly sets this property apart is the fully equipped guest house—a 1 bedroom, 1 bathroom space complete with its own living area, cabinetry, sink, and laundry connections. Whether you’re looking for multi-generational living, rental income potential, or a private office setup, this space offers endless possibilities. Additional features include a 1-car garage, central HVAC, gas water heater, ceiling fans throughout, and ample front and side parking. Schedule your showing today!
Key facts
- Upgraded fixtures
- Private office setup
- Granite countertops
Tags
Neighborhood map
What this means for you Summary
Snapshot
- This is a 4-bed/3.0-bath single-family listed at $210k.
Deal economics
- At list price, monthly cash flow is $273 ($3k/yr) — positive.
- The deal already cash-flows at list — no discount required.
- To meet the 1% rule (rent ≥ 1% of price), the offer needs to be $205k (2.6% below list).
- Recommended offer: $197k (6.0% below list) — sets the bar for market timing.
- Cap rate 7.9% vs local median 3.6% in Corpus Christi — top-decile yield for the area; either an underpriced asset or a hidden risk that comps aren't pricing in. Stress-test before assuming the spread holds.
Location & tenants
- Location reads 78/100 on livability (#66 in TX, #2,404 nationally) — a middle-class / working-renter tenant base. Strengths: commute A+, cost of living A+, housing A+; Watch: crime F.
- Corpus Christi ISD (urban): math 31% / reading 35% proficiency, ranked #562 of 826 in TX (top 68%) — families likely to look elsewhere, expect single-tenant / working-renter base with shorter leases; 63% free/reduced lunch — lower-income household profile, screen leases tightly.
- Zoned schools: Windsor Park G/T (math 85% / reading 90%, grade A+, #6 of 4,322 statewide, top 0%, 609 students, 29% FRL); Adkins Middle (math 40% / reading 39%, grade F, #660 of 1,662 statewide, top 41%, 956 students, 48% FRL); Moody H S (math 33% / reading 26%, grade F, #1,112 of 1,632 statewide, top 70%, 1,382 students, 84% FRL).
- Zoned-school proficiency averages 52% at this address vs 33% district-wide (+19 pts) — the actual schools serving this property are materially stronger than the Corpus Christi ISD average implies; a family-tenant draw the district grade alone would hide.
- Market conditions: Rents rising (+2.3%/yr); 434 active listings in the ZIP; 10 comparable units currently listed for rent nearby; rentals lingering (median 46d on market — plan ~5-8 weeks vacancy on turnover, expect pricing pressure); 60% of comp listings sitting > 30 days — soft ceiling on asking rent; 1,397 units permitted in Nueces County in 2024 (47 in 5+ unit buildings).
- This rent runs 45% of the median local income ($55k/yr) — at the standard rent-burdened threshold; future hikes will face affordability resistance.
Forward outlook
- Local home prices are declining (-3.0%/yr); year-one equity from $1k of loan paydown is wiped out by about $6k of value loss. Plan a longer hold.
- Nueces County population projected at +36% by 2050 — long-run rental-demand tailwind backs the buy-and-hold thesis.
Negotiation context
- It's been on market 78 days — a 6% lower offer ($197k) is reasonable based on typical stale-listing flexibility.
- 3 sale attempts since 2y ago with the ask held roughly flat each time — persistent listings suggest the price (not the market) is what's stuck; bring a comps-based counter.
Risks & watch-outs
- Watch-outs: built in 1950 — expect roof / HVAC / electrical / plumbing capex.
- Climate carrying-cost: moderate flood risk; severe wind risk, 99% chance of damaging wind over 30y; extreme-heat days projected 7→26/yr by 2055 (HVAC capex compounding) — expect insurance premiums to compound above CPI over the hold.
Questions for the listing agent
- It's been on market 78 days. Have you received any prior offers? Is the seller open to a 6% concession, seller financing, or rate buy-down credit?
- Built in 1950 — when were the roof, HVAC, electrical panel, plumbing, and water heater last replaced?
- Why hasn't it sold? Are there any deal-killer items the seller is aware of (foundation, flood, title, zoning, code violations)?
- Is there a deadline driving the sale (1031 exchange, divorce, estate, relocation)? That informs how much negotiation room exists.
- Crime grade is F in this area — have there been break-ins, vandalism, or insurance claims at this property in the last 3 years? What carrier currently insures it and at what premium?
- The area grade is low — what's the realistic commute time and amenity access for the typical tenant pool here? Any planned neighborhood developments (good or bad) we should know about?
- What's the average days-on-market for RENTAL listings here right now (not sales)? A rising rental-DOM trend means longer vacancies and softer asking-rent achievability than the comps imply.
- What's the recent tenant-quality profile in this submarket — average credit score on applications, eviction rate, late-payment / NSF rate, and stable-employment percentage? A property-management company in the area should have these aggregated.
- How much new for-sale + rental construction is in the pipeline within 1–3 miles? Heavy new supply typically softens prices + rents 12–24 months out; constrained supply supports both.
Investment metrics
- 1% rule
- 0.97% ✗
- Cap rate
- 7.85%
- Cash-on-cash
- 5.57%
- DSCR
- 1.25
- GRM
- 8.6
CMA / ARV
- ARV (median comp)
- $167,956
- List price
- $210,000
- Delta
- 25.03%
- Verdict
- OVERPRICED
- Comps
- 20 within 1.0 mi
Show comp detail 11 sales within ~0.75 mi
| Address | Dist | Beds/Ba | Sqft | Sold | Price | $/sf | Match |
|---|---|---|---|---|---|---|---|
| 4341 Ramsey St | 0.70mi | 4/3.0 | 1,860 (+0%) | 1mo | $229,900 | $124 | 66 |
| 4342 Cambridge Dr | 0.62mi | 4/2.0 | 1,824 (-1%) | 1mo | $199,500 | $109 | 64 |
| 4642 Brookdale Dr | 0.27mi | 4/3.0 | 1,669 (-10%) | 18mo | $175,000 | $105 | 56 |
| 5206 Larcade Dr | 0.43mi | 5/2.0 (+1) | 1,776 (-4%) | 12mo | $184,900 | $104 | 54 |
| 4602 Christie | 0.47mi | 3/2.5 (-1) | 1,954 (+6%) | 10mo | $120,000 | $61 | 53 |
| 4910 Hakel Dr | 0.57mi | 3/2.0 (-1) | 1,748 (-6%) | 17mo | $229,000 | $131 | 41 |
| 2709 Milo St | 0.49mi | 3/2.0 (-1) | 1,718 (-7%) | 23mo | $129,900 | $76 | 38 |
| 5338 Alejandro St | 0.62mi | 4/2.0 | 1,591 (-14%) | 8mo | $120,000 | $75 | 37 |
| 5210 Hitching Post | 0.70mi | 3/3.0 (-1) | 2,062 (+12%) | 7mo | $219,000 | $106 | 37 |
| 4738 Hakel Dr | 0.59mi | 3/2.0 (-1) | 1,664 (-10%) | 14mo | $238,800 | $144 | 35 |
| 4409 Ivy | 0.65mi | 3/2.0 (-1) | 1,724 (-7%) | 22mo | $189,000 | $110 | 31 |
Match score weights: distance 35% · size 25% · config 20% · recency 20%. Top-matched comps best support the ARV.
Projected returns pro-forma
-3.0% appreciation · 2.32% rent growth · sell at horizon
- IRR
- -8.4%
- Equity multiple
- 0.69×
- Total profit
- $-18,080
- Equity at exit
- $31,312
- IRR
- 0.2%
- Equity multiple
- 1.01×
- Total profit
- $858
- Equity at exit
- $18,157
Cash invested: $58,800 (down + closing). Projections, not guarantees.
Landlord ↔ Tenant lean methodology
- Overall (STATE)
- 87 Strongly Landlord-Friendly
- State Texas
- 87 Strongly Landlord-Friendly · R+5
- County
- — inherits STATE
- City
- — inherits STATE
ZIP-level market 78415
- Rents YoY
- 2.3%
- Active inventory
- 434
- Price-to-rent
- 8.6×
Monthly cashflow live
- Estimated rent
- $2,046 high interval (Pro) →
- Mortgage (P&I)
- −$1,101
- Tax from tax record
- −$155 /mo · $1,859/yr
- Insurance
- −$88
- HOA
- −$0
- Vacancy / Maint / Mgmt
- −$430
- Net cashflow
- $273
Break-even live
Sensitivity live
| Price | -10% $392 | -5% $332 | +0% $273 | +5% $213 | +10% $154 |
|---|---|---|---|---|---|
| Rent | -10% $111 | -5% $192 | +0% $273 | +5% $354 | +10% $434 |
| Rate | -1.0pp $379 | -0.5pp $326 | base $273 | +0.5pp $218 | +1.0pp $163 |
UW: 25.0% down · 7.5% · 30yr · 1.5% tax · 5.0% vac · 8.0% maint · 8.0% mgmt
Financing live
Cash to close
- Down payment
- $52,500
- Closing costs
- $6,300
- Reserves months
- —
- Total cash needed
- —
Loan-product check · same deal, 3 products live
Conventional
25% down · 7.5% · 30yr
- Down + closing
- —
- Monthly P&I
- —
- Monthly cashflow
- —
- DSCR
- —
- Eligible?
- —
Personal DTI + credit; lowest rate.
DSCR
20% down · 8.5% · 30yr
- Down + closing
- —
- Monthly P&I
- —
- Monthly cashflow
- —
- DSCR
- —
- Eligible?
- —
No personal income docs; deal must DSCR.
Hard money
10% down · 12.0% · 12mo
- Down + closing
- —
- Monthly P&I
- —
- Monthly cashflow
- —
- DSCR
- —
- Eligible?
- —
Short-term bridge; refi at stabilization.
Rent comps 10 comps
| Address | Beds | Baths | Sqft | Rent | $/sqft | DOM | Units | Dist |
|---|---|---|---|---|---|---|---|---|
| 4241 Green Grove Dr Corpus Christi, TX | 3.0 | 2.0 | 1345 | $1,700 | $1.26 | 45d | 1 | 0.73mi |
| 5541 Candace St Corpus Christi, TX | 3.0 | 2.0 | 1484 | $1,795 | $1.21 | 15d | 1 | 0.92mi |
| 4005 Green Grove Dr Corpus Christi, TX | 3.0 | 2.0 | 1406 | $1,695 | $1.21 | 45d | 1 | 0.97mi |
| 4845 Concord St Corpus Christi, TX | 4.0 | 2.0 | 1437 | $1,750 | $1.22 | 15d | 1 | 1.10mi |
| 2041 Harvard St Corpus Christi, TX | 3.0 | 2.0 | 1230 | $1,400 | $1.14 | 15d | 1 | 1.23mi |
| 1522 Cambridge Dr Corpus Christi, TX | 3.0 | 1.5 | 1278 | $1,600 | $1.25 | 45d | 1 | 1.25mi |
| 2930 Water Lily Dr Unit 1268443P Corpus Christi, TX | 3.0 | 2.0 | 2540 | $4,994 | $1.97 | 45d | 1 | 1.27mi |
| 4634 Weir Dr Corpus Christi, TX | 3.0 | 2.0 | 1540 | $1,800 | $1.17 | 45d | 1 | 1.34mi |
| 1446 Annapolis Dr Corpus Christi, TX | 3.0 | 2.0 | 1500 | $1,700 | $1.13 | 45d | 1 | 1.36mi |
| 1405 Annapolis Dr Corpus Christi, TX | 3.0 | 1.5 | 1502 | $2,000 | $1.33 | 15d | 1 | 1.48mi |
Listing history 21 events
-
2026-06-21days on market $210,000 Active 78 DOM
-
2026-06-18days on market $210,000 Active 75 DOM
-
2026-06-17days on market $210,000 Active 74 DOM
-
2026-06-16days on market $210,000 Active 73 DOM
-
2026-06-15days on market $210,000 Active 72 DOM
-
2026-06-14days on market $210,000 Active 70 DOM
-
2026-06-10days on market $210,000 Active 67 DOM
-
2026-06-09days on market $210,000 Active 66 DOM
-
2026-06-08days on market $210,000 Active 65 DOM
-
2026-06-07days on market $210,000 Active 64 DOM
-
2026-06-05days on market $210,000 Active 61 DOM
-
2026-06-03days on market $210,000 Active 60 DOM
-
2026-06-02days on market $210,000 Active 59 DOM
-
2026-06-01days on market $210,000 Active 58 DOM
-
2026-05-31days on market $210,000 Active 57 DOM
-
2026-05-30days on market $210,000 Active 56 DOM
-
2026-04-01$210,000 Active 1008-char remark
Show marketing remark (1008 chars)
Welcome to 4845 Johnston Dr a versatile property offering space, flexibility, and value all in one! The main home features 3 bedrooms and 2 full bathrooms with thoughtful updates throughout, including granite countertops, upgraded fixtures, laminate flooring, and vinyl windows. The primary bathroom showcases a double vanity and a tiled tub/shower combo, giving it a clean, modern feel. Fresh interior and exterior paint, along with durable hardie board siding, add to the home’s move-in ready appeal. What truly sets this property apart is the fully equipped guest house—a 1 bedroom, 1 bathroom space complete with its own living area, cabinetry, sink, and laundry connections. Whether you’re looking for multi-generational living, rental income potential, or a private office setup, this space offers endless possibilities. Additional features include a 1-car garage, central HVAC, gas water heater, ceiling fans throughout, and ample front and side parking. Schedule your showing today!
-
2025-05-10$219,900 Active
-
2024-08-13price $214,900
-
2024-06-11$224,900 Active
-
2015-03-09soldstatus
ⓘ Source: listings_history table (triggers on properties + properties_extension) + one-shot
backfill from property_details.listing_events for pre-trigger history.
Tax reassessment forecast TX · Resets to sale price
- Current annual tax
- $1,859 · $155/mo
- Projected year-2 tax
- $3,843 · $320/mo
- Expected delta
- +$1,984/yr (+$165/mo · 106.7%)
ⓘ Screening estimate from a state-policy table — verify with the county assessor before closing.
Climate risk First Street
- Flood 5/10 Major FEMA zone X (unshaded) · 65% chance over 30 yrs
- Wildfire 1/10 Low
- Heat 10/10 Extreme 7 d/yr ≥107°F today · 26 d/yr by 30 yrs out
- Wind 9/10 Extreme 99% chance of damaging wind over 30 yrs
- Air quality 1/10 Low 0 unhealthy d/yr today · 0 by 30 yrs out
Nearby sold comps map
Loading sold comps map…
Walkable amenities ~0.75 mi
Loading nearby amenities…
Taxation est. · year 1
- Rental income
- $24,554
- − Mortgage interest
- −$11,763
- − Property taxes
- −$1,859
- − Insurance
- −$1,050
- − Repairs & maintenance
- −$1,964
- − Management
- −$1,964
- − Depreciation
- −$6,109
- Taxable loss
- −$156
- Est. tax savings @ 24.0%
- +$37
- After-tax cash flow
- $3,311/yr
For passive investors: Depreciation is non-cash, so a rental often shows a tax loss while cash-flowing — sheltering income. Rental losses are passive: they offset passive income freely, and up to $25,000/yr can offset ordinary (W-2) income if you actively participate and your MAGI is under $100k (phasing out to $0 by $150k); unused losses carry forward. On sale, claimed depreciation is recaptured at up to 25%, and gains may owe capital-gains tax (a 1031 exchange can defer both). Figures are a year-1 estimate at your 24.0% rate — not tax advice; consult a CPA.
Schools (NCES district)
- District
- Corpus Christi ISD
- NCES district ID
- 4815270
- Math proficiency
- 31% ▼ -18.00%
- Reading proficiency
- 35% ▼ -7.00%
- Median HH income
- $45,672
- Composite
- 28.27/100
- National rank
- #6793
- State rank
- #562 of 826 in TX
Livability — Corpus Christi
- Score
- 78/100
- State rank
- #66
- US rank
- #2404
Category grades
Schools grade is shown separately in the Schools card above.
Census & demographics
- Census place
- Corpus Christi, TX
- County
- Nueces County · 296,836 people
- City population
- 296,836
- Metro
- Corpus Christi, TX
- Population (ZIP)
- 43,080
- Household income
- $54,990
- Rent vs Own
- Severe rent burden
- 1730.0
Population outlook (Nueces County) Hauer SSP2
- Today (2025)
- 418,037 people
- By 2030
- 447,123 · +7.0%
- By 2040
- 505,911 · +21.0%
- By 2050
- 567,522 · +35.8%
- By 2075
- 729,686 · +74.6%
- By 2100
- 847,087 · +102.6%
Race, ethnicity, and origin ACS 2023
- Neighborhood character
- Predominantly Hispanic (83%)
- Race & ethnicity
- Hispanic / Latino 83% Two or more races 41% White 12% Black 3%
- Hispanic origin (detail)
- Mexican 75%
- Foreign-born
- 9% · Canada
- Languages at home
- 59% English-only · Spanish 40%
Political lean MEDSL · Nueces
- 2024 margin
- R (+11.5) · D 43.8% · R 55.3%
- 2008→2024 swing
- -7.1pp toward R · 2008: -4.4pp · 2024: -11.5pp
- All cycles
- 2024: R+11.5 2020: R+2.9 2016: R+1.5 2012: R+3.2 2008: R+4.4
Not yet ingested
- Civics
- —
Market trends
- HPI YoY
- ▼ -173.20%
- Current HPI
- 158.011
- Rent YoY
- ▲ 2.32%
- Metro
- Corpus Christi, TX
- State GDP YoY
- ▲ 3.95%
- F500 in state
- 110
Industry mix (Fortune 500 HQ in TX)
| Industry | F500 HQs | Revenue |
|---|---|---|
| Energy | 16 | $1,198B |
|
||
| Technology | 5 | $198B |
|
||
| Engineering / Construction | 4 | $72B |
|
||
| Energy Services | 3 | $60B |
|
||
| Utilities | 3 | $41B |
|
||
| Healthcare | 2 | $330B |
|
||
Price history
-6.6% since first listed5 events — show timeline
- 2026-04-01 Listed $210,000 CBMLS
- 2025-05-10 Listed $219,900 CBMLS
- 2024-08-13 Price Changed $214,900 CBMLS
- 2024-06-11 Listed $224,900 CBMLS
- 2015-03-09 Sold (Public Records) — Public Records
Property tax history
+5.9%/yrLatest (2025): $1,859 · -47.1% YoY. Source: county tax records.
Cash-flow waterfall
monthlySold comps — $/sqft
last 12 mo · ≤1 miLoading sold comps…