10677 Hilltop Cir · Quinlan, TX
Flood risk 1/10 · Minimal
- FEMA flood zone
- X (unshaded)
- Chance of flooding over 30 yrs
- 0.0%
- Est. flood insurance / yr
- $507 – $1,088
Fire risk 5/10 · Moderate
- Est. fire insurance / yr
- $1,222 – $2,270
Heat risk 7/10 · Major
- Hot days now (above 110°F)
- 7 days/yr
- Hot days in 30 yrs
- 23 days/yr
Wind risk 6/10 · Moderate
- Chance of severe wind over 30 yrs
- 27.0%
Air-quality risk 2/10 · Minimal
- Unhealthy air days now
- 1 days/yr
- Unhealthy air days in 30 yrs
- 1 days/yr
Risk factors via First Street. Map © Google.
Why this score? — see what drove the B+ grade
The composite is a weighted blend of 9 inputs, each scored 0–100. Each bar is that input's sub-score; the figure is the points it added to the 100-point composite (weight × sub-score).
- Cash flow +30.0/30.0
- 1% rule +10.0/10.0
- DSCR +10.0/10.0
- Appreciation +10.0/10.0
- ARV discount +7.5/15.0
- Livability +3.2/5.0
- Schools +2.6/10.0
- Rent growth +2.5/5.0
- Condition / age +2.5/5.0
$99,999
🖨 Deal sheet 📄 Offer letter ✓ Due diligence
Listing remarks MLS
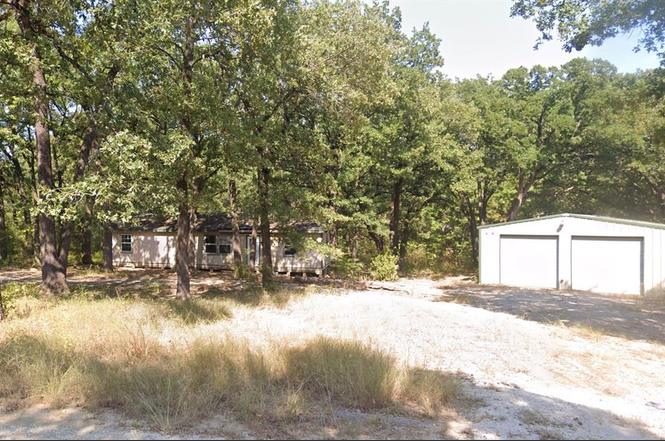
PROPERTY HAS THREE BEDROOM AND TWO BATH WITH SEPARATE LIVING ROOM, DINING ROOM, LAUNDRY ROOM, PORCH AND PATIO COVERED AND PROPERTY HAS 62291 SQ FT LOT SIZE WITH CONVENIENT TWO DETACHED CAR GARAGE.
Key facts
- Rolling terrain
- Concrete slab
- Oversized lot
Tags
Property features AI
Finance
- Other: Property type: Residential — Single Family Residence; Subdivision: Whiskers Retreat Ph 2-2; County: Hunt; Country: United States
- Financial info: No second mortgage indicated; Listing is for sale
- HOA & community: No association
Exterior
- Parking: 2 covered parking spaces; 2-car garage; Parking surfaces: Concrete and gravel
- Security: Video surveillance present
- Utilities: Aerobic septic; City water; Co-op electric service; Not in a municipal utility district
- Home design: Single-family residence; One story; Residential property
- Construction: Built in 1981; Board & Batten siding; Pillar/post/pier foundation
- Exterior features: Workshop with electric; Lot approximately 1.43 acres; Directions: Northeast on Hwy 34, right on FM 3701, left on Hilltop Cir, follow around the bend; property on the left
Interior
- Kitchen: No appliances included
- Bedrooms: Primary bedroom (15 x 15) on main level; Total of 3 bedrooms
- Flooring: No flooring information provided
- Bathrooms: 2 full bathrooms
- Heating & cooling: No heating or cooling information provided
- Interior features: Open plan with two living areas; One dining area; Other interior features
- Laundry & utility: No specific laundry/utility appliances listed
Neighborhood map
What this means for you Summary
Snapshot
- This is a 3-bed/2.0-bath single-family listed at $100k.
Deal economics
- At list price, monthly cash flow is $471 ($6k/yr) — positive.
- The deal already cash-flows at list — no discount required.
- Meets the 1% rule at list price ($2k rent vs $100k).
- Cap rate 11.9% vs local median 4.6% in Quinlan — top-decile yield for the area; either an underpriced asset or a hidden risk that comps aren't pricing in. Stress-test before assuming the spread holds.
Location & tenants
- Location reads 64/100 on livability (#746 in TX) — a middle-class / working-renter tenant base. Strengths: cost of living A+, housing A+, crime A; Watch: amenities F, commute F, employment F.
- Quinlan ISD (rural): math 27% / reading 34% proficiency, ranked #610 of 826 in TX (top 74%) — families likely to look elsewhere, expect single-tenant / working-renter base with shorter leases.
- Zoned schools: D C Cannon El (765 students, 81% FRL) — zoned schools average 81% FRL vs 60% district-wide (22 pts higher); higher-poverty schools than district average — tighter screening recommended.
- Market conditions: 335 active listings in the ZIP; 1 comparable units currently listed for rent nearby; 1,289 units permitted in Hunt County in 2024 (527 in 5+ unit buildings).
- This rent runs 31% of the median local income ($64k/yr) — at the standard rent-burdened threshold; future hikes will face affordability resistance.
Forward outlook
- In year one you build about $11k of equity ($691 loan paydown + $10k appreciation (10.0% local appreciation)).
- Hunt County population projected at +15% by 2050 — modest demand growth; plan on rents tracking national, not racing it.
- At projected returns (10.0% appreciation + 3.0% rent growth), your $28k cash investment doubles in ~2 years — after that, you're playing with house money.
- By year 4, paydown + projected appreciation supports a ~$38k cash-out refi (75% LTV) — recoverable capital for the next deal without selling this one.
Negotiation context
- Only 1 days on market — expect competitive offers; lowballing is unlikely to land.
- 2 sale attempts since 10y ago with the ask held roughly flat each time — persistent listings suggest the price (not the market) is what's stuck; bring a comps-based counter.
Risks & watch-outs
- Watch-outs: property tax is 3.0% of price.
- Climate carrying-cost: major wind risk, 27% chance of damaging wind over 30y; moderate wildfire risk; extreme-heat days projected 7→23/yr by 2055 (HVAC capex compounding) — expect insurance premiums to compound above CPI over the hold.
Questions for the listing agent
- Property tax is high relative to price — has the assessment been appealed recently, and will the sale trigger a re-assessment?
- Is there a deadline driving the sale (1031 exchange, divorce, estate, relocation)? That informs how much negotiation room exists.
- Schools are D-rated, which usually means shorter tenancies and higher turnover. Who's the typical renter profile here, and what's been the actual vacancy rate?
- What's the average days-on-market for RENTAL listings here right now (not sales)? A rising rental-DOM trend means longer vacancies and softer asking-rent achievability than the comps imply.
- What's the recent tenant-quality profile in this submarket — average credit score on applications, eviction rate, late-payment / NSF rate, and stable-employment percentage? A property-management company in the area should have these aggregated.
- How much new for-sale + rental construction is in the pipeline within 1–3 miles? Heavy new supply typically softens prices + rents 12–24 months out; constrained supply supports both.
Investment metrics
- 1% rule
- 1.63% ✓
- Cap rate
- 11.94%
- Cash-on-cash
- 20.17%
- DSCR
- 1.90
- GRM
- 5.1
CMA / ARV
- ARV (on-the-fly)
- $356,720
- Comps found
- 2
Show comp detail 2 sales within ~0.75 mi
| Address | Dist | Beds/Ba | Sqft | Sold | Price | $/sf | Match |
|---|---|---|---|---|---|---|---|
| 10883 Lakeview Trl | 0.42mi | 3/2.0 | 1,440 (-1%) | 24mo | $53,500 | $37 | 59 |
| 10434 Pecan Valley Rd | 0.52mi | 3/2.0 | 1,556 (+7%) | 18mo | $380,500 | $245 | 50 |
Match score weights: distance 35% · size 25% · config 20% · recency 20%. Top-matched comps best support the ARV.
Projected returns pro-forma
10.0% appreciation · 3.0% rent growth · sell at horizon
- IRR
- 39.4%
- Equity multiple
- 4.02×
- Total profit
- $84,541
- Equity at exit
- $90,087
- IRR
- 33.9%
- Equity multiple
- 9.06×
- Total profit
- $225,589
- Equity at exit
- $194,276
Cash invested: $28,000 (down + closing). Projections, not guarantees.
Landlord ↔ Tenant lean methodology
- Overall (STATE)
- 87 Strongly Landlord-Friendly
- State Texas
- 87 Strongly Landlord-Friendly · R+5
- County
- — inherits STATE
- City
- — inherits STATE
ZIP-level market 75474
- Home prices YoY
- 7.5%
- Active inventory
- 335
- Price-to-rent
- 5.1×
Monthly cashflow live
- Estimated rent
- $1,630 medium interval (Pro) →
- Mortgage (P&I)
- −$524
- Tax from tax record
- −$251 /mo · $3,012/yr
- Insurance
- −$42
- HOA
- −$0
- Vacancy / Maint / Mgmt
- −$342
- Net cashflow
- $471
Break-even live
UW: 25.0% down · 7.5% · 30yr · 1.5% tax · 5.0% vac · 8.0% maint · 8.0% mgmt
Financing live
Cash to close
- Down payment
- $25,000
- Closing costs
- $3,000
- Reserves months
- —
- Total cash needed
- —
Loan-product check · same deal, 3 products live
Conventional
25% down · 7.5% · 30yr
- Down + closing
- —
- Monthly P&I
- —
- Monthly cashflow
- —
- DSCR
- —
- Eligible?
- —
Personal DTI + credit; lowest rate.
DSCR
20% down · 8.5% · 30yr
- Down + closing
- —
- Monthly P&I
- —
- Monthly cashflow
- —
- DSCR
- —
- Eligible?
- —
No personal income docs; deal must DSCR.
Hard money
10% down · 12.0% · 12mo
- Down + closing
- —
- Monthly P&I
- —
- Monthly cashflow
- —
- DSCR
- —
- Eligible?
- —
Short-term bridge; refi at stabilization.
Rent comps 1 comps
| Address | Beds | Baths | Sqft | Rent | $/sqft | DOM | Units | Dist |
|---|---|---|---|---|---|---|---|---|
| 12046 Center St Unit 200 Quinlan, TX | 3.0 | 2.0 | 1350 | $1,300 | $0.96 | 1d | 1 | 1.23mi |
Listing history 2 events
-
2026-06-18remarks 341-char remark
-
2026-06-18$99,999 Active 1 DOM
ⓘ Source: listings_history table (triggers on properties + properties_extension) + one-shot
backfill from property_details.listing_events for pre-trigger history.
Tax reassessment forecast TX · Resets to sale price
- Current annual tax
- $3,012 · $251/mo
- Projected year-2 tax
- $3,012 · $251/mo
- Expected delta
- $0/yr ($0/mo · 0.0%)
ⓘ Screening estimate from a state-policy table — verify with the county assessor before closing.
Climate risk First Street
- Flood 1/10 Low FEMA zone X (unshaded) · 0% chance over 30 yrs
- Wildfire 5/10 Major
- Heat 7/10 Severe 7 d/yr ≥110°F today · 23 d/yr by 30 yrs out
- Wind 6/10 Major 27% chance of damaging wind over 30 yrs
- Air quality 2/10 Low 1 unhealthy d/yr today · 1 by 30 yrs out
Nearby sold comps map
Loading sold comps map…
Walkable amenities ~0.75 mi
Loading nearby amenities…
Taxation est. · year 1
- Rental income
- $19,561
- − Mortgage interest
- −$5,601
- − Property taxes
- −$3,012
- − Insurance
- −$500
- − Repairs & maintenance
- −$1,565
- − Management
- −$1,565
- − Depreciation
- −$2,909
- Taxable income
- $4,408
- Est. tax owed @ 24.0%
- −$1,058
- After-tax cash flow
- $4,590/yr
For passive investors: Depreciation is non-cash, so a rental often shows a tax loss while cash-flowing — sheltering income. Rental losses are passive: they offset passive income freely, and up to $25,000/yr can offset ordinary (W-2) income if you actively participate and your MAGI is under $100k (phasing out to $0 by $150k); unused losses carry forward. On sale, claimed depreciation is recaptured at up to 25%, and gains may owe capital-gains tax (a 1031 exchange can defer both). Figures are a year-1 estimate at your 24.0% rate — not tax advice; consult a CPA.
Schools (NCES district)
- District
- Quinlan ISD
- NCES district ID
- 4836240
- Math proficiency
- 27% ▼ -10.00%
- Reading proficiency
- 34% ▼ -2.00%
- Median HH income
- $45,461
- Composite
- 26.16/100
- National rank
- #7271
- State rank
- #610 of 826 in TX
Livability — Quinlan
- Score
- 64/100
- State rank
- #746
- US rank
- #13776
Category grades
Schools grade is shown separately in the Schools card above.
Census & demographics
- County
- Hunt County · 71,969 people
- Metro
- Dallas-Fort Worth-Arlington, TX
- Population (ZIP)
- 17,671
- Household income
- $64,103
- Rent vs Own
- Severe rent burden
- 181.0
Population outlook (Hunt County) Hauer SSP2
- Today (2025)
- 97,090 people
- By 2030
- 100,452 · +3.5%
- By 2040
- 106,544 · +9.7%
- By 2050
- 111,218 · +14.6%
- By 2075
- 121,695 · +25.3%
- By 2100
- 123,683 · +27.4%
Race, ethnicity, and origin ACS 2023
- Neighborhood character
- Predominantly White (74%)
- Race & ethnicity
- White 74% Hispanic / Latino 19% Two or more races 8% Asian 1% Black 1%
- Hispanic origin (detail)
- Mexican 17%
- Common ancestry
- Lithuanian 2% Romanian 2% Iranian 1%
- Foreign-born
- 8% · Canada
- Languages at home
- 88% English-only · Spanish 10% Other Asian/Pacific 1%
Political lean MEDSL · Hunt
- 2024 margin
- Solid R (+55.5) · D 21.9% · R 77.4%
- 2008→2024 swing
- -14.9pp toward R · 2008: -40.6pp · 2024: -55.5pp
- All cycles
- 2024: R+55.5 2020: R+52.5 2016: R+56.3 2012: R+51.2 2008: R+40.6
Not yet ingested
- Civics
- —
Market trends
- HPI YoY
- ▲ 33.95%
- Current HPI
- 484.21
- Rent YoY
- —
- Metro
- Dallas-Fort Worth-Arlington, TX
- State GDP YoY
- ▲ 3.95%
- F500 in state
- 110
Industry mix (Fortune 500 HQ in TX)
| Industry | F500 HQs | Revenue |
|---|---|---|
| Energy | 16 | $1,198B |
|
||
| Technology | 5 | $198B |
|
||
| Engineering / Construction | 4 | $72B |
|
||
| Energy Services | 3 | $60B |
|
||
| Utilities | 3 | $41B |
|
||
| Healthcare | 2 | $330B |
|
||
Price history
-14.2% since first listed8 events — show timeline
- 2026-06-18 Listed $99,999 NTREIS
- 2016-09-30 Sold (MLS) — NTREIS
- 2016-08-18 Pending — NTREIS
- 2016-08-17 Price Changed $76,600 NTREIS
- 2016-07-22 Price Changed $86,600 NTREIS
- 2016-06-24 Price Changed $96,600 NTREIS
- 2016-05-24 Price Changed $106,600 NTREIS
- 2016-04-20 Listed $116,600 NTREIS
Property tax history
+5.6%/yrLatest (2025): $3,012 · -3.6% YoY. Source: county tax records.
Cash-flow waterfall
monthlySold comps — $/sqft
last 12 mo · ≤1 miLoading sold comps…